
 ?Mathematical formulae have been encoded as MathML and are displayed in this HTML version using MathJax in order to improve their display. Uncheck the box to turn MathJax off. This feature requires Javascript. Click on a formula to zoom.
Abstract
Energy is vital to economic progress; however, global climate change and environmental damage have been caused by the increased need for fossil fuel resources. The rapid increase in urbanization and the associated construction projects have resulted a significant pollution, such as CO2, SO2, NO2 and particulate matter (PM2.5), which has begun to cause severe health problems and damage environments. This study used a dynamic data envelopment analysis to analyze the environmental energy, CO2, AQI (air quality index), and gross domestic product (GDP) efficiencies in 31 cities in China from 2013 to 2016. It was found that except for five cities – Beijing, Guangzhou, Shanghai, Lhasa and Nanning – that achieved efficiency scores of 1, there was significant room for improvement in urban air pollution indicator efficiencies. The AQI efficiency scores in most cities were generally significantly lower than the CO2 efficiency scores; however, the AQI was observed to have a greater impact. Therefore, emphasis needs to be placed on AQI control and governance. The average efficiency of the eastern region is better than average efficiency of the western region.
Keywords:
Introduction
The availability of energy has been the driving force behind modern development. However, the massive global economic growth and the associated growth in fossil fuel-generated energy consumption in the past century has resulted in the excessive release of CO2 into the atmosphere, which has led to climate change effects and environmental damage. As these carbon dioxide emissions have been found to account for 56.6% of total greenhouse gas emissions, many countries have been focusing on reducing their carbon dioxide emissions. Rapid economic growth has also led to an increase in urbanization, urban construction and car ownership, leading to an increase in air pollutants such as primary pollutants and secondary particulate matter derivatives (PM2.5), many of which have begun to seriously affect health, livelihoods, production activities, the natural climate and the ecological environment.
China’s urbanization and industrialization growth has been sustained for over 30 years, with cities becoming vital to both economic and social development. However, in the past 5 years, the PM2.5 air pollution in China has become increasingly serious. According to the BP Statistical Review of World Energy Citation[1], 87% of the energy used in 2016 was generated from petroleum and coal, with natural gas and other clean energy accounting for only about 13%. In the absence of sufficient quantities of new clean energy to meet global economic growth, fossil fuels will continue to be used and will continue to be the main source of air pollution. Therefore, the all-round development of China’s economy and energy, and the environment, are facing increasingly difficult challenges to improve energy efficiencies, reduce air pollution and carbon dioxide emissions, and move toward carbon-neutral economic growth.
A large amount of energy is required to ensure continuous economic development; however, the result of this increase in energy use is a commensurate increase in dangerous emissions such as carbon dioxide, sulfur dioxide and other types of dust pollution, all of which cause damage to human health and the natural environment.
Energy and environmental issues have been examined for many decades; however, most research has been focused on issues related to energy consumption, carbon emissions and environmental efficiency measures, for which data envelopment analysis (DEA) models have been used for the assessment and comparison of provinces and cities in mainland China Citation[2–12]. Energy and carbon efficiencies have also been examined in Europe and the New York area to assess or compare energy and carbon efficiencies Citation[13–22], and energy and carbon emission efficiencies have been examined in various economic sectors such as agriculture, electricity, steel, thermal power and other industries Citation[23–36].
Most environmental efficiency analyses, which focus on environmental assessments, environmental energy efficiencies and environmental performances, have used DEA to examine the differences between regional and national carbon dioxide emissions levels, with most concluding that a majority of greenhouse gas emissions are the result of energy use Citation[37–40]. Other analyses have examined the environmental energy efficiencies in countries, regions and industries Citation[11, Citation41–50] and still others have examined environmental performance evolution Citation[32, Citation51, Citation52].
Comprehensive energy consumption, CO2 emissions and environmental efficiency indexes have been compiled to enable the above evaluations, with the negative indicators primarily being CO2 and environmental indicators such as sewage and sulfur dioxide. However, significantly fewer studies have focused on air pollutant emissions such as PM2.5, most of which can seriously endanger the health of residents over the medium to long term. Therefore, energy and environmental efficiency analyses need to include an assessment of air pollution and primary pollutants when seeking to comprehensively evaluate urban energy consumption and environmental efficiencies.
Previous studies have evaluated energy and the environment in terms of urban environmental energy efficiency and CO2 efficiency. However, air quality index (AQI) is an important environmental variable in air quality. According to environmental air quality standards and the impact of various pollutions on human health, ecology and the environment, the concentrations of several air pollutants that are routinely monitored can be simplified into a single approximate value. To express the level of air pollution and air quality, the main pollutants involved in air quality assessment are six small items: PM2.5, sulfur dioxide (SO2), nitrogen dioxide (NO2), ozone (O3) and carbon monoxide (CO). These main pollutants as very important variables have not been discussed in the past. This study examines not only urban environmental energy efficiency and CO2 efficiency but also AQI efficiencies and economic efficiencies using a dynamic DEA model with inter-temporal output processes to observe the impact of overall environmental changes over time on energy efficiency and time-varying factors. The main contributions of this article are two. First, the past literature only considers CO2 and energy efficiency analysis; it ignores the AQI air pollution variables in the environment and lacks comprehensive consideration of other air pollution indicators. This article considers the CO2 and AQI variables and aims at a comprehensive understanding of the environmental impact of various variables. Second, previous literature, in terms of method, was mainly based on static analysis; this article uses CO2 and AQI as carry-over variables, and uses dynamic analysis to understand the sustainable development and comparison of energy, CO2 and AQI. In order to solve the static analysis, it is impossible to analyze the comparison of the year and the continuous development of each indicator.
For the DEA model, energy consumption, the labor force, and the fixed assets of 31 cities in China from 2013 to 2016 are taken as the input indicators, the gross domestic product (GDP) in each city is taken as the output indicator, and the CO2 emissions and AQI are taken as the carry-over indicator variables.
The remainder of this article is organized as follows: the next section outlines the research method, the third section presents the empirical results and a comprehensive discussion, and the fourth section gives the conclusions.
Research method
SBM dynamics DEA
Data envelopment analysis (DEA) uses linear programming techniques to assess the relative efficiency of decision-making units (DMU) based on a Pareto optimal solution concept. DEA has been found to be an effective method for prioritizing multiple decision-making scenarios in multi-objective (oriented) environments for efficiency measurements that have multiple inputs and multiple outputs. DEA was first proposed by Farrell in 1957 Citation[53], and has since been modified and expanded. The main theoretical basis is now the 1978 Charnes, Cooper and Rhodes (CCR) Citation[54] model and 1984 Banker, Charnes and Cooper (BCC) Citation[55] model as these are both able to measure radial efficiency and it is assumed that the inputs and outputs are able to proportionally increase or decrease; however, this assumption is not applicable in all cases. Tone Citation[56] then proposed a non-radial slacks-based measure (SBM) that was able to account for both input slack and the differences in terms on a single scalar SBM efficiency measure with a 0 to 1 efficiency value scale; at 1, the DMU is deemed efficient and there are no discrepancies in the production boundary regardless of the inputs or outputs.
Dynamic analysis was proposed and first used in a DEA model by Klopp in 1985 Citation[57], after which the Malmquist index was developed by Färe et al. Citation[58] to enable the use of the model to account for inter-temporal efficiencies. However, as these models are unable to consider the effects of inter-temporal continuations, they are less appropriate for long-term efficiency measurements.
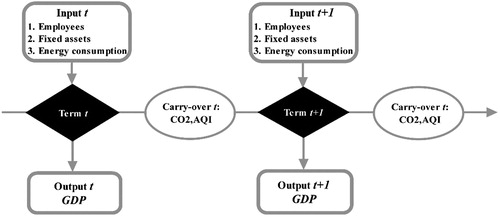
Färe and Grosskopf Citation[59] then incorporated inter-temporal variability into a dynamic model using carry-overs; their model was then further developed by a number of other research studies Citation[60–67]. Following Färe et al., Tone and Tsutsui Citation[68] extended the model to a dynamic analysis of SBMs; the methodology in this study was designed based on Tone and Tsutsui’s Citation[68] assumptions and is described as follows. Suppose there are n DMUs over T terms, with each DMU having different inputs and outputs over a period and a carry-over (link) to the next period (t + 1) ().
Figure 1. Dynamic model. GDP: Gross domestic product.
Suppose the set of decision-making units (DMUs) is and the DMUs are indexed using
(i.e.
).
As the basis for the dynamic DEA model analysis, the DMUs have m inputs and s outputs in each term, and the carry-over activities can be divided into desirable (good), undesirable (bad), discretionary (free), and non-discretionary (fixed); that is, these four carry-over activities (
and
) carry over from period t to period t + 1. This study utilizes the negative (bad) outputs in the carry-over model.
The non-oriented model is shown in the following:
(1)
(1)
EquationEquation (2)(2)
(2) is the connection equation for t and t + 1.
The following is the most efficient solution:
(5)
(5)
Urban energy environmental, CO2, AQI and GDP efficiencies
In line with Hu and Wang Citation[2], a total-factor energy efficiency index is used to overcome any possible bias in the traditional energy efficiency indicators. There are four key features of this study: environmental energy efficiency, CO2 efficiency, AQI efficiency and GDP efficiency. In this study i represents the area and t represents the time.
Environmental energy efficiency
Environmental energy efficiency is the ratio of the target energy input to the actual energy input:
(6)
(6)
When the target energy input is equal to the actual input level, then the environmental energy efficiency equals 1, which indicates efficiency. When the target energy input is less than the actual input level, then the environmental energy efficiency is less than 1, indicating some degree of inefficiency.
CO2 efficiency
CO2 efficiency is the ratio of target undesirable CO2 output to actual undesirable CO2 outputs:
(7)
(7)
When the target CO2 undesirable output is equal to the actual CO2 undesirable output level, then the CO2 efficiency equals 1, indicating efficiency. When the target undesirable CO2 output is less than the actual undesirable CO2 output, then the CO2 efficiency is less than 1, indicating some degree of inefficiency.
AQI efficiency
AQI efficiency is the ratio of target undesirable AQI output to actual undesirable AQI output:
(8)
(8)
When the target undesirable AQI output is equal to the actual undesirable AQI output, then the AQI efficiency equals 1, indicating efficiency. When the target undesirable AQI output is less than the actual undesirable AQI output, then the AQI efficiency is less than 1, indicating some degree of inefficiency.
GDP efficiency
GDP efficiency is the ratio of actual desirable GDP output to target desirable GDP output:
(9)
(9)
When the target desirable GDP output is equal to the actual desirable GDP output, then the GDP efficiency equals 1, indicating efficiency. When the actual desirable GDP output is less than the target desirable GDP output, then the GDP efficiency is less than 1, indicating some degree of inefficiency.
Empirical results and discussion
Data and variables
In previous scholars’ research analyzing energy and environmental efficiency, the main inputs have mainly been employees, fixed assets, and energy consumption [Citation2,Citation3,Citation5,Citation7,Citation8Citation12,Citation20,Citation22,Citation36]. Output is dominated by GDP and CO2 (or SO2), where GDP is a good output and CO2 (or SO2) is a bad output [Citation3,Citation5,Citation6,Citation8,Citation12,Citation20,Citation22,Citation36]. In term of carry-over variables, Li et al. Citation[69] used bad output PM2.5 and SO2 as carry-overs to analyze China’s environment and energy efficiency. Based on the input and output variables adopted by the above scholars, the present study considers employees, fixed assets and energy consumption as inputs, GDP as output, and CO2 and AQI as carry-over variables. The definitions and sources of each variable used to analyze the economic energy and environmental efficiency of 31 cities in China from 2013 to 2016 are given below.
Data source
Panel data (2013 to 2016) for 31 of the most-developed cities from east and west China was collected from the Statistical Yearbook of China Citation[70], the Demographics and Employment Statistical Yearbook of China Citation[71], and the statistical yearbooks from all the cities. The AQI was extracted from China Environmental and Protection Bureau reports Citation[72]. The variables used in the study were as follows ().
Table 1. Input and output items.
Input variables
Employees(em): The registered population in each city at the end of each year. Unit: person.
Fixed assets (asset): Capital stock was calculated based on the fixed assets investment in each city. Unit: 100 million CNY.
Energy consumption (com): Calculated from the total energy consumption in each city.
Output variable
Gross domestic production (GDP): The GDP of each city was taken as the output. Unit: 100 million CNY. The GDP data for each provincial capital were derived from the GDP stated in each province’s statistical yearbook for the given period. If nominal, GDP/price indices = real GDP.
Carry-over variables
AQI: AQI was the measured concentration of pollutants and particulate matter (PM2.5 and PM10 24-hour average concentration), SO2, NO2, O3 and CO. In accordance with China’s environmental protection standards, the AQI represents the short-term air quality conditions and trends in each city. The main pollutants involved in the air quality assessment were fine particles, inhalable particles, sulfur dioxide, nitrogen dioxide, ozone and carbon monoxide. The AQI was considered the maximum value for the individual air quality index (IAQI) for each pollutant. When the AQI was greater than 50, the corresponding pollutant was the primary pollutant, with pollutants with an IAQI greater than 100 being considered excessive.
CO2: The CO2 emissions data for each city were estimated from the energy consumption. CO2 emissions have been recognized as the primary cause of changing global temperatures and rising sea levels.
Statistical description of input and output variables by year
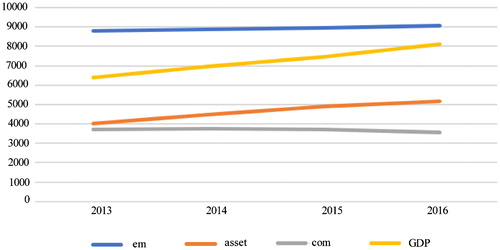
presents the descriptive input and output statistics from 2010 to 2014 and the average trend for each indicator from 2013 to 2016. As can be seen, the average energy consumption dropped from 37.15 billion tonnes in 2013 to about 35.8 billion tonnes in 2016. All other input indicators were rising. The average energy consumption increase fluctuated, and dropped in 2016. Employment, fixed asset investment and GDP growth were rapidly growing, with the GDP rising faster than the other indicators.
Figure 2. Input and output variables by year. GDP: Gross domestic product.
Empirical analysis
In this study, DEA-Solver software PRO 13.0 was used to evaluate and rank the efficiency of the carbon dioxide emissions and the AQI indices in 31 Chinese cities from 2013 to 2016, and to analyze the city efficiency changes over time. The CO2 and AQI data were used as the inter-temporal (carry-over) variables to analyze and evaluate energy consumption efficiency.
City efficiency scores and rank analyses
shows the total efficiency scores and rankings in the 31 cities for energy consumption, CO2 and AQI. There were efficiency improvements in all cities from 2013 to 2016. The table shows that the efficiency scores in five cities reached 1; however, the low efficiency scores in the lowest five cities (Shijiazhuang at 0.29, Xining and Taiyuan at 0.32, Lanzhou at 0.34 and Yinchuan at 0.40) show that there is a need for significant improvement. The efficiency improvement changes from 2013 to 2016 indicate that the efficiency values in most cities were increasing; while some cities had slight fluctuations, the general trend was an increasing efficiency score, indicating that the governance in most cities was relatively effective. These results are consistent with those of Hu and Wang Citation[2] and Wang and Wei Citation[8].
Table 2. City efficiency scores and rankings from 2013 to 2016.
However, seven cities had falling efficiency scores (Fuzhou, Kunming, Lanzhou, Shijiazhuang, Tianjin, Urumqi and Yinchuan); among these, the efficiency scores in Fuzhou and Kunming fell sharply from 1 in 2013 to 0.58 and 0.53, respectively, which indicates that there were some governance problems. Five other cities saw a small drop in their efficiency scores; however, their initial scores were already low. For example, Lanzhou fell from 0.35 to 0.34, Shijiazhuang dropped to 0.28, Yinchuan fell from 0.41 in 2013 to 0.39 in 2016, Tianjin dropped from 0.63 to 0.59, and Urumqi fluctuated slightly from 0.54 in 2013 to 0.53 in 2016. Shijiazhuang was therefore ranked last, and Lanzhou and Yinchuan were ranked 28th and 27th, respectively. These results are consistent with those of Shi et al. Citation[4] and Wu et al. Citation[10].
Environmental energy, CO2 and AQI efficiency scores and ranks
and show the environmental energy, CO2, AQI and GDP energy efficiency data from 2013 to 2016. As can be seen, there were significant differences in the efficiencies.
Figure 3. CO2, Air Quality Index (AQI) and Gross Domestic Product (GDP) efficiency scores in 2013.
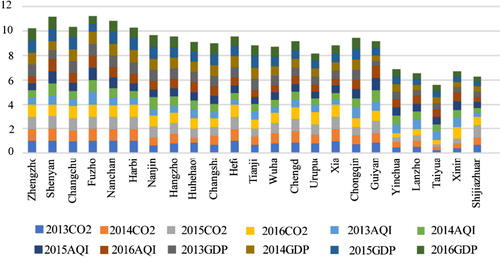
Table 3. Environmental energy, CO2 and air quality index (AQI) efficiency scores and rankingss by city.
Except for Beijing, Guangzhou, Shanghai, Lhasa and Nanning, which had total efficiency scores of 1, the overall efficiency in the cities varied greatly. Jinan, Haikou and Kunming had relatively high total efficiency scores of more than 0.8 to nearly 1. In Jinan, for example, the environmental energy efficiency was 0.9999 in 2014, and the CO2, AQI and GDP efficiencies were all 1.
Kunming’s efficiency scores were affected by the AQI and GDP efficiency scores, which dropped from 1 in the previous 3 years to 0.962 and 0.561 in 2016. Therefore, while the efficiencies were high from 2013 to 2015, there was a large decline in 2016, especially in GDP.
Although Shenyang’s AQI efficiency was low at 0.697 in 2013, it attained 1 in all subsequent years. The GDP efficiency was lower in 2013 and 2014 at 0.728 and 0.731, but was efficient in 2015 and 2016.
While Zhengzhou ranked higher than Shenyang, its efficiencies tended to fluctuate; the AQI efficiency score was 0.552 in 2013, 0.619 in 2014, 0. 532 in 2015 and 0.549 in 2016. Although all other indicators reached 1 in 2016, the AQI efficiency remained low.
Fuzhou’s CO2 and AQI efficiencies were 1 in both 2013 and 2014; however, the CO2 efficiency score declined slightly to 0.983 in 2015 and then slightly increased to 0.9886 in 2016. The AQI efficiency score was consistently good, with all four years achieving 1; however, GDP efficiency dropped from 1 in 2013–2014 to 0.627 in 2015 and only slightly increased to 0.632 in 2016, indicating that improvements in GDP were needed. The environmental energy efficiency in Fuzhou was 1 in both 2013 and 2014, and had a slight decline in 2015 to 0.983 and in 2016 to 0.989, indicating that some improvements were still necessary.
Six other cities had total efficiency scores less than 0.5; these were Guiyang, Yinchuan, Lanzhou, Taiyuan, Xining and Shijiazhuang.
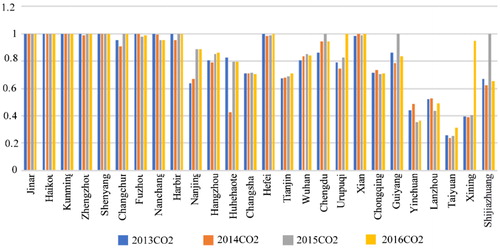
The AQI efficiency in most cities was significantly lower than the CO2 efficiency, with only six cities having a lower CO2 efficiency (Guiyang, Yinchuan, Lanzhou, Taiyuan, Xining and Shijiazhuabg); however, the overall efficiency scores in these cities were also low.
Guiyang’s CO2 efficiency was 0.862 in 2013, then fell to 0.786 in 2014 and achieved 1 in 2015, but dropped again to 0.838 in 2016. Its AQI efficiency score was only 0.735 in 2013 but significantly increased to 0.916 in 2014, 0.994 in 2015 and 1 in 2016. The GDP efficiency score was low at only 0.418 in 2013, but improved marginally to 0.555 by 2016. The energy consumption efficiency score was slightly higher at 0.735 in 2013 and again rose marginally, to 0.838, in 2016. These statistics indicate that Guiyang’s economic growth was generally weak and there was room for improvement. However, as Guiyang’s AQI was high, future economic development needs to maintain the current good air quality through sustainable development planning.
Yinchuan, Lanzhou, Taiyuan and Xining not only had lower AQI and CO2 efficiencies but also had lower energy consumption and GDP efficiencies. The energy consumption efficiency scores in Yinchuan and Lanzhou fell over the examined period, with Yinchuan’s efficiency dropping from 0.488 in 2013 to 0.366 in 2016, and Lanzhou’s dropping from 0.525 in 2013 to 0.492 in 2016.
and show that the CO2 and AQI efficiencies in most cities were rising, reflecting the environmental efforts being made. However, some cities – Chongqing, Tianjin and Urumqi – had falling CO2 and AQI efficiencies. Tianjin’s AQI efficiency declined the most, from 0.692 in 2013 to 0.551 in 2016, and Chongqing’s AQI efficiency declined from 0.846 in 2013 to 0.72 in 2016. While the CO2 efficiency scores in Chongqing, Huhehot, Hefei, Changsha and Nanchang were also declining, these declines were small.
Figure 4. Air Quality Index (AQI) efficiency scores from 2013 to 2016.
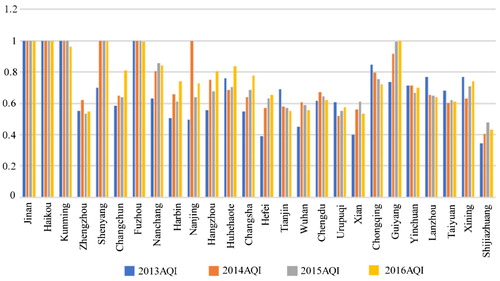
Figure 5. CO2 efficiency scores from 2013 to 2016.
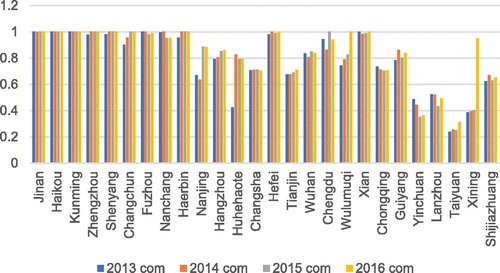
From , it can be seen that, overall, the environmental energy efficiencies in most cities were above 0.5 and were rising. However, in Yinchuan, Taiyuan and Xining, the environmental energy efficiency remained at a relatively low level. Taiyuan, for example, had the lowest environmental energy efficiency score, at 0.238, in 2013, and it rose only to 0.313 in 2016. Yinchuan’s environmental energy efficiency declined from 0.488 in 2013 to 0.366 in 2016, and Xining’s environmental energy efficiency rose from a low of 0.388 in 2013 to 0.404 in 2015 and then to 0.95 in 2016.
Figure 6. Environmental energy efficiency (com) by city from 2013 to 2016.
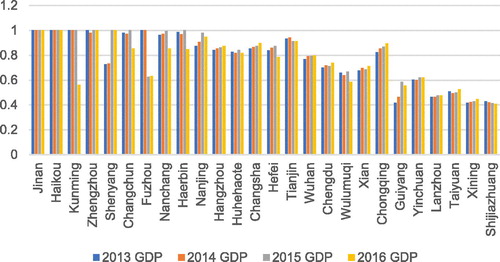
shows that, in general, the GDP efficiency in most cities was above 0.6. However, a few cities (Guiyang, Lanzhou, Xining and Shijiazhuang) had less efficient performances, with Shijiazhuang’s GDP efficiency in particular declining to under 0.5. Although Guiyang, Lanzhou, Taiyuan and Xining had lower GDP efficiencies, they were rising over the study period.
Figure 7. Gross domestic product (GDP) efficiency scores by city from 2013 to 2016.
In general, the environmental efficiency improved in most cities, except for declining AQI and CO2 efficiency in a few cities, with the need for AQI efficiency improvements being overall greater than the need for CO2 efficiency improvements. This result is inconsistent with those of Choi et al. Citation[5] and Bi et al. Citation[32].
Most cities had rising environmental energy efficiency scores above 0.5, with only a few cities needing to significantly improve their environmental energy efficiency. This result is consistent with those of Hu and Wang Citation[2] and Wang and Wei Citation[8].
Analysis of the indicators
shows the input (employee, fixed asset and energy consumption) and output (GDP) variable indicator improvements from 2013 to 2016. Overall, with the exception of Beijing, Guangzhou, Lhasa, Nanning and Shanghai, which were all efficient, different levels of progress are needed, with some cities needing a little improvement in energy consumption but significant improvements in fixed assets and employment. In Chengdu, for example, in 2013, only a 5.6% improvement was needed in energy consumption, which increased to 14% in 2014; the city attained efficiency in 2015, but required a 6% improvement in 2016 again. However, in 2013 a 41.85% improvement was needed in its fixed assets, which by 2016 had not improved as a 41.87% improvement was still required. The situation was similar for employment; in 2013, a 24.84% improvement was needed, and in 2016, a 25.67% improvement was still required. The GDP improvements needed fluctuated from 43% in 2013 to 35% in 2016. Similar situations were observed in Changchun, Harbin, Hefei, Nanchang and Zhengzhou, most of which are second-tier cities in central and western China that are at a critical juncture in their industrial restructuring and economic transformation.
Table 4. Percentage improvements needed from 2013 to 2016.
Ten cities needed improvements in energy consumption – Huhehot, Lanzhou, Nanjing, Shijiazhuang, Taiyuan, Tianjin, Wuhan, Urumqi, Xining, and Yinchuan – most of which also had low efficiencies. Taiyuan had the greatest need for energy consumption improvement, which fell only slightly from 76.16% in 2013 to 68.68% in 2016. The need for GDP improvement was even greater, at 95.91% in 2013, 101.87% in 2014 and 89.53% in 2016.
Yinchuan and Lanzhou produced slightly different results. While the need for energy consumption improvements increased over the study period, less improvement was necessary for GDP. Yinchuan’s need for energy consumption improvements rose from 51.25% in 2013 to 63.45% in 2016, and Lanzhou’s rose from 47.54% in 2013 to 50.77% in 2016; however, Yinchuan’s need for GDP improvement dropped from 65% in 2013 to 60% in 2016, and Lanzhou’s need for GDP improvement fell slightly from 114% in 2013 to 110% in 2016.
Both Xining and Huhehot demonstrated significant improvements in energy consumption over the study period; however, there was little improvement in GDP. The need for energy consumption improvements fell from 61% in 2013 to only 5% in 2016; however, though declining slowly, the need for GDP improvements was still 123% in 2016.
As can be seen, there were vast differences between the cities in terms of efficiencies and the type and extent of improvements needed, which clearly indicates that governance needs to be localized to ensure precise, focused policies. This result is consistent with those of Lv et al. [73] and Bi et al. Citation[32].
Comparisons between eastern and western efficiency scores
Regional development in China exhibits various differences, especially in the development characteristics of cities which vary in resource endowments, geographical location and climatic conditions. Therefore, it would be useful to see the status quo of cities’ development in China by regional analysis and comparison.
In this section the 31 sample cities are divided into western region and eastern region. The western region cities (18 in total) are Chengdu, Changsha, Chongqing, Guiyang, Hefei, Huhehot, Kunming, Lanzhou, Lhasa, Nanchang, Nanning, Taiyuan, Wuhan, Urumqi, Xian, Xining, Yinchuan and Zhengzhou, and the eastern region cities (13 in total) are Beijing, Changchun, Fuzhou, Guangzhou, Harbin, Haikou, Hangzhou, Jinan, Nanjing, Shanghai, Shenyang, Shijiazhuang and Tianjin.
and and show the data average of input and output variables between eastern and western regions in 2013 to 2016. The data trends of input and output variables in 2013 to 2016 are compiled. The trends show that the input variable ‘employees’ in the two regions displays a gap that is large but stable. In both regions, the slope of assets in 2013 to 2016 increased stably. The energy consumption of the eastern region in 2016 dropped slightly. In terms of the output variables, the average GDP of the eastern and western regions is maintained at a steady growth, and the GDP in the eastern region is about twice the GDP of the western region. The average CO2 emission reduction of cities in the eastern region began to decline, and the average effect of CO2 emission reduction in the western region was not obvious. The average AQI in the eastern and western regions dropped sharply in 2014, then maintained a state of slight decrease every year thereafter. The average AQI values of the two regions were close in 2014–2016.
Figure 8. The Cities' data average of input variable by eastern and western region. Input variables include Fixed assets (asset), Energy consumption (com), Gross Domestic Product (GDP), Carbon Dioxide (CO2), Air Quality Index (AQI)
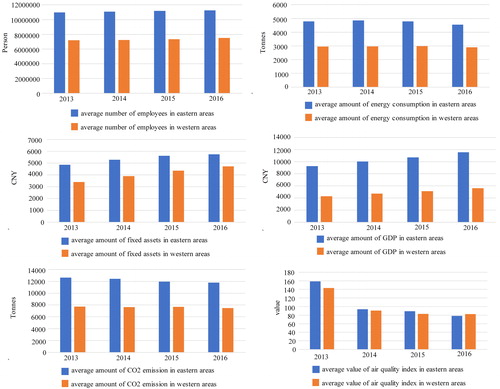
Table 5. The cities’ data average of input variables by region (east vs. west).
Table 6. The cities’ data average of output variables by region (east vs. west).
From , it can be readily seen that the average efficiency gap between eastern and western regions and the efficiency in the eastern region show a slightly improved trend, but the western region remains at the same efficiency level. This result is consistent with those of Wang et al. Citation[6] and Wu et al. Citation[10].
Table 7. Efficiency, overall and by year, compared between eastern and western regions.
indicates that the average energy efficiency of the eastern and western region shows a slight increase. The CO2 average efficiencies fluctuate for eastern region, but are higher than those of the western region, which remain at the same level. The AQI average efficiencies indicate an upward trend in both eastern and western regions, and the eastern region is better than western region.
Table 8. Energy, CO2 and air quality index (AQI) efficiency each year between eastern and western regions.
Ranking comparisons including and not including the CO2 and AQI efficiency scores
shows there were only five cities that had overall efficiencies of 1 (Beijing, Guangzhou, Lhasa, Nanning and Shanghai), with all the other cities needing improvement.
Table 9. Cities with and without CO2 and air quality index (AQI) efficiency scores, and ranking comparisons.
While Jinan, Haikou, Fuzhou and Kunming did not achieve efficiencies of 1, when the AQI index was not included the efficiencies and rankings changed significantly, with Jinan’s ranking dropping from 6th to 12th place and the overall efficiency dropping from 0.9999 to 0.682, Haikou’s ranking dropping to 18th place and the overall efficiency dropping from 0.9985 to 0.682, Fuzhou’s ranking dropping to 23rd place and the overall efficiency dropping from 0.741 to 0.523, and Kunming’s ranking dropping to 25th place and the overall efficiency dropping from 0.823 to 0.422. These results indicate that poor CO2 emissions were affecting the total efficiency score and ranking, as the AQI efficiencies in these cities were relatively high.
When the AQI was not considered, the overall efficiency rankings in most other cities were better than the overall rankings, indicating that these overall efficiency scores were being affected by the AQI index; this was the case for Nanchang, Harbin, Nanjing, Hangzhou, Huhehot, Changsha, Hefei, Tianjin, Chengdu, Wuhan, Urumqi, Xian and Chongqing.
The lowest ranked cities were Guiyang, Yinchuan, Lanzhou, Shenyang, Taiyuan, Xining and Shijiazhuang, as their overall efficiency scores and rankings did not significantly change, indicating that there were serious governance issues with both CO2 emissions and air pollution.
Conclusion
In this article, the total efficiency and rankings of 31 cities were analyzed using a dynamic DEA model to determine the total efficiency and assess changes over time. Further analysis was also conducted on economic growth and social development, and CO2 emission and air quality index (AQI) efficiency improvements. To explore the impact of the CO2 emissions and AQI on the urban efficiency improvements, a composite CO2 and AQI index from 2013 to 2016 was examined.
The main conclusions of this article are:
Most cities in China have attained an overall efficiency of less than 1 and have a huge need for improvement. Among the 31 cities in China examined here, only five achieved efficiencies of 1; these are Beijing, Shanghai, Guangzhou, Lhasa and Nanjing. While there were overall efficiency improvements in most cities, at least five cities only achieved efficiency scores of less than 0.5 (Shijiazhuang at 0.29, Xining and Taiyuan at 0.32, Lanzhou at 0.34 and Yinchuan at 0.40), which shows that there was a need for significant improvement.
The efficiency improvement changes from 2013 to 2016 indicate that the efficiency values in most cities were increasing. While some cities showed slight fluctuations, the general trend was an increasing efficiency score, indicating that the governance in most cities was relatively effective.
The AQI efficiency in most cities was significantly lower than the CO2 efficiency, with only six cities having a lower CO2 efficiency. The cities with higher CO2 efficiency than AQI are Guiyang, Yinchuan, Lanzhou, Taiyuan, and Xining.
CO2 and AQI efficiencies in most cities were rising, reflecting the environmental efforts being made. There are still three cities – Chongqing, Tianjin and Urumqi – that had falling CO2 and AQI efficiencies. Tianjin’s AQI efficiency declined the most, from 0.692 in 2013 to 0.551 in 2016, and Chongqing’s AQI efficiency also declined, from 0.846 in 2013 to 0.72 in 2016. While the CO2 efficiencies in Chongqing, Huhehot, Hefei, Changsha and Nanchang were also declining, these declines were small.
The impact of CO2 and AQI on the efficiency scores and rankings indicates that the AQI had a greater impact than CO2 in most cities. Therefore, for most cities, more emphasis should be placed on AQI control and governance.
There were also significant differences in efficiency scores for employees, fixed assets, energy consumption inputs and GDP output. In most cities, the energy efficiency scores were relatively high, but 9 cities required significant energy consumption improvements: Huhehot, Lanzhou, Nanjing, Shijiazhuang, Tianjin, Wuhan, Urumqi, Xining and Yinchuan. Employee and fixed assets investment did not need significant improvements, except for in Changchun, Chengdu, Harbin, Hefei, Nanchang and Zhengzhou. The cities with the greatest need for GDP improvements were Lanzhou, Shijiazhuang and Xining.
The average efficiency of the eastern region is better than that of the western region. Also, the average energy, CO2 and AQI efficiencies of the eastern region are better than those of the western region.
Policy implications
According to the above analysis, comprehensive management of carbon dioxide emissions and air pollutant emissions is a major challenge for China’s current economic growth and social development. Actively taking administrative measures and employing market mechanisms to carry out effective and fundamental governance has become the top priority. It should be carried out immediately through the development of short-term, mid-term and long-term governance strategies. Recent control and reduction of emissions of air pollutants have been the focus of improvement, but CO2 emissions are still subject to ongoing controls. Therefore, the mid-term and long-term measures of comprehensive management are still major tasks.
The solid measures suggested are as follows:
Central and local governments should integrate resources to establish common governance measures for reduction of CO2 and air pollutants. Since the concerns over the reduction of carbon dioxide emissions are more pressing than the treatment of air pollutants, and indicate that the efficiency of carbon dioxide treatment is better than that of air pollution treatment. However, from the perspective of development over time, there is still room for improvement in the efficiency of carbon dioxide emission reduction, as the annual improvement has not changed much. Moreover, the efficiency of air pollutant reduction has improved significantly. Among the key policies of the past 5 years, the focus on the control and reduction of air pollution emissions is significant, and the effect exceeds the carbon dioxide emissions. Therefore, at the same time, effective policies and measures for comprehensively controlling carbon dioxide emissions and air pollutant emissions are required, and these should be the focus of sustainable policy and the focus of future research.
Due to China's vast land and resources, there are great differences in resource endowments, factor characteristics, natural conditions and geographical conditions between cities. These differences also have a differential impact on carbon dioxide emissions and air pollutant emissions, and their efficiency improvements. Therefore, governance needs to be precisely controlled based on the characteristics of each region, and the central government should allow local governments to take precise measures that aim to target different pollutant and carbon dioxide emissions.
First-tier cities should play a leading demonstrative role, and those cities that do not require efficiency improvement should be actively promoted. In terms of technology transfer and exchange of experience, they should be used as demonstrations and reference for improvement for other cities that do have room for improvement, thereby effectively replicating successful governance experiences, and efficient configuration and utilization of resources. Beijing, Shanghai and Guangzhou are first-tier Chinese cities and have the most advanced economic and social development; therefore, it is not surprising that these cities had the best performance in terms of economic growth and environmental governance. These first-tier cities need to take the lead in industrial restructuring and layout, clean energy use and promotion, developing and utilizing new energy sources, transferring technological achievements to other cities, and providing replicable models or samples to promote efficiency improvements in other parts of the country.
Central cities and western cities should give priority to reducing and controlling emissions of air pollutants, actively accelerate the adjustment of industrial structure and eliminate large-scale polluting petrochemical enterprises that use traditional energy sources, with the goal of reducing carbon dioxide emissions and emissions of air pollutants. Because the level of economic growth and social development is relatively backward, the most polluting industrial enterprises that use traditional petrochemicals are supporting most urban industries. Therefore, these cities generally have significant room for improvement in the emission of carbon dioxide and air pollution. To achieve the carbon dioxide emissions reduction goal for 2020, the Chinese government has been introducing supportive policies to encourage the use of alternative energy and to develop a low-carbon economy. Therefore, the promotion of new energy sources and alternatives to traditional energy development has been rapid. Cities with more serious carbon dioxide emissions than AQI need to further adjust their energy structures and seek to invest in renewable energies and new energy sources to reduce carbon dioxide emissions.
In cities where the carbon dioxide and air pollutant emissions are equally severe, because traditional industries have become the main drivers of local economic growth, it is necessary to encourage and ensure both economic growth and clean energy use. Therefore, introducing new technologies to promote energy conservation and emissions reductions has become a policy priority. At the same time, it is necessary to actively adjust the industrial structures to promote sustainable economic and social development by harnessing regional advantages.
Because different cities have different resource endowments, and particular geographical locations and meteorological conditions, local governments must be encouraged to make their own decisions, as effective policies for urban emissions reduction and air pollution control need to be based on the city's actual emission inventories, emission sources, industrial structures, stge economic development and local conditions. For example, Chengdu is located in the western Sichuan Basin on the Chengdu Plain itself. Due to the basin characteristics, air pollution emissions are difficult to disperse because of the surrounding high mountains, resulting in more serious harm to residents' health. Therefore, governance should be focused on reducing emissions from the root air pollution sources through the monitoring and controlling of mobile sources, restructuring industry by transferring out traditional petrochemical and other polluting enterprises, introducing high-tech industries and service-based industries, and vigorously developing the cultural, creative and tourism industries.
In addition to government-led measures to control carbon dioxide emissions and air pollutant emissions, we should also actively employ market mechanisms and encourage the establishment, development and growth of green sustainable development enterprises through market mechanisms. These measures may address the following: the price of industrial land is too low through reform of the system, from increasing input costs and controlling the development and expansion of highly polluting industries. By reforming the relative tax burden of the service industry, the service industry will be further stimulated to achieve more sustainable economic growth; further increase the tax on coal use, while at the same time increasing the subsidies for the use of new energy technologies, thereby promoting the replacement of old energy by new energy. Actively build regional carbon dioxide emissions trading and regional compensation mechanisms for PM2.5 emission reductions to achieve sustainable and balanced development between regions.
Promote green and environmentally sustainable project investment and development by establishing a green financial policy system. Green bonds can be issued as a major source of financing through the construction of green banks, create a financial discount mechanism to encourage green loans, establish a public welfare environmental cost information system, and provide decision-making departments and investors with evidence and other measures to support the launch, development and growth of more green sustainable industry enterprises.
This study provides an analysis of CO2 emission efficiency and air pollutant efficiency, and an efficiency analysis of energy consumption and economic growth. The study investigated the efficiency improvement trend of carbon dioxide emissions in various cities and the improvement trend of air pollutants efficiency, so as to provide more accurate decision-making reference and advice for the central government and local governments. Unlike other studies that simply study CO2 emission efficiency or simply study SO2 or NO2, this study examines the AQI of 31 provincial capital cities in China, which is the target of this study as air pollutant emission indicators are currently of the utmost concern to the government and the public. And by comparing the efficiency of carbon dioxide emission reductions, it provides a new research perspective on leading cities’ energy consumption, and comprehensive research on the combination of AQI emission control and carbon dioxide emission control. We thus expect to make a beneficial contribution to the academic community, and to provide reference information and considerations for policymakers.
Disclosure statement
No potential conflict of interest was reported by the authors.
Additional information
Funding
Related Research Data
References
- BP Statistical Review of World Energy (2017) LNG Global, 1730 E. Holly Avenue El Segundo, CA, USA.
- Hu JL, Wang SC. Total factor energy efficiency of regions in China. Energy Policy. 2006;34:3206–3217.
- Yeh T-L, Chen T-y, Lai P-y. A comparative study of energy utilization efficiency between Taiwan and China. Energy Policy. 2010;38:2386–2394. doi:10.1016/j.enpol.2009.12.030.
- Shi G-M, Bi J, Wang J-N. Chinese regional industrial energy efficiency evaluation based on a DEA model of fixing non-energy inputs. Energy Policy. 2010;38:6172–6179. doi:10.1016/j.enpol.2010.06.003.
- Choi Y, Zhang N, Zhou P. Efficiency and abatement costs of energy-related CO2 emissions in China: a slacks-based efficiency measure. Appl Energy. 2012;98:198–208. doi:10.1016/j.apenergy.2012.03.024.
- Wang K, Wei Y-M, Zhang X. Energy and emissions efficiency patterns of Chinese regions: a multi-directional efficiency analysis. Appl Energy. 2013;104:105–116.
- Li Y, Sun L, Feng T, et al. How to reduce energy intensity in China: a regional comparison perspective. Energy Policy. 2013;61:513–522. doi:10.1016/j.enpol.2013.06.007.
- Wang K, Wei Y-M. China's regional industrial energy efficiency and carbon emissions abatement costs. Appl Energy. 2014;130:617–631. doi:10.1016/j.apenergy.2014.03.010.
- Ding W, Xu L, Ye W. A comparative study of bioenergy consumption and CO2 emissions in Tibetan region of China. Renewable Energy. 2014;71:344–350. doi:10.1016/j.renene.2014.05.044.
- Wu A-H, Cao Y-Y, Liu B. Energy efficiency evaluation for regions in China: an application of DEA and Malmquist indices. Energy Efficiency. 2014;7:429–439. doi:10.1007/s12053-013--8.
- Chen, Y., Liu, B., Shen, Y. and Wang, X. “The energy efficiency of China's regional construction industry based on the three-stage DEA model and the DEA-DA model.” KSCE Journal Civil Engineering. 2015; 20(1):34–47 .
- Du K, Xie C, Ouyang X. A Comparison of Carbon Dioxide (CO2) Emission trends among provinces in China. Renew Sustain Energy Rev. 2017;73:19–35. doi:10.1016/j.rser.2017.01.102.
- Zhang X-P, Cheng X-M, Yuan J-H, et al. Total-factor energy efficiency in developing countries. Energy Policy. 2011;39:644–650. doi:10.1016/j.enpol.2010.10.037.
- Martínez CIP. Energy efficiency development in German and Colombian non energy- intensive sectors: a non-parametric analysis. Energy Efficiency. 2011;4:115–131.
- Song M-L, Zhang L-L, Liu W, et al. Bootstrap-DEA analysis of BRICS’ energy efficiency based on small sample data. Appl Energy. 2013;112:1049–1055. doi:10.1016/j.apenergy.2013.02.064.
- Cui Q, Kuang H-B, Wu C-y, et al. The changing trend and influencing factors of energy efficiency: the case of nine countries. Energy. 2014;64:1026–1034. doi:10.1016/j.energy.2013.11.060.
- Mallikarjun S, Lewis HF. Energy technology allocation for distributed energy resources: a strategic technology-policy framework. Energy. 2014;72:783–799. doi:10.1016/j.energy.2014.05.113.
- Chang M-C. Energy intensity, target level of energy intensity, and room for improvement in energy intensity: an application to the study of regions in the EU. Energy Policy. 2014;67:648–655. doi:10.1016/j.enpol.2013.11.051.
- Apergis N, Aye GC, Barros CP, et al. Energy efficiency of selected OECD countries: a slacks based model with undesirable outputs. Energy Economics. 2015;51:45–53. doi:10.1016/j.eneco.2015.05.022.
- Pang R-Z, Deng Z-Q, Hu J-L. Clean energy use and total-factor efficiencies: an international comparison. Renew Sustain Energy Rev. 2015;52:1158–1171.
- Makridou G, Andriosopoulos K, Doumpos M, et al. Measuring the efficiency of energy-intensive industries across European countries. Energy Policy. 2016;88:573–583. doi:10.1016/j.enpol.2015.06.042.
- Wang Q, Chiu Y-H, Chiu C-R. Non-radial metafrontier approach to identify carbon emission performance and intensity. Renew Sustain Energy Rev. 2017;69:664–672. doi:10.1016/j.rser.2016.11.199.
- Mousavi-Avval SH, Rafiee S, Jafari A, et al. Improving energy use efficiency of canola production using data envelopment analysis (DEA) approach. Energy. 2011;36:2765–2772. doi:10.1016/j.energy.2011.02.016.
- Martínez PCI, Silveira S. Analysis of energy use and CO2 emission in service industries: evidence from Sweden. Renew Sustain Energy Rev. 2012;6:5285–5294. doi:10.1016/j.rser.2012.04.051.
- Banaeian N, Omid M, Ahmadi H. Greenhouse strawberry production in Iran, efficient or inefficient in energy. Energy Efficiency. 2012;5:201–209. doi:10.1007/s12053-011--7.
- Pahlavan R, Rafiee S, Omid M. Assessing the technical efficiency in potato production in Iran. Int J Green Energy. 2012;9:229–242. doi:10.1080/15435075.2011.621479.
- Khoshnevisan B, Rafiee S, Omid M, et al. Reduction of CO2 emission by improving energy use efficiency of greenhouse cucumber production using DEA approach. Energy. 2013;55:676–682.
- Blancard S, Martin E. Energy efficiency measurement in agriculture with imprecise energy content information. Energy Policy. 2014;66:198–208. doi:10.1016/j.enpol.2013.10.071.
- Morfeldt J, Silveira S. Capturing energy efficiency in European iron and steel production—comparing specific energy consumption and Malmquist productivity index. Energy Efficiency. 2014;7:955–972. doi:10.1007/s12053-014--8.
- Lin B, Yang L. Efficiency effect of changing investment structure on China's power industry. Renew Sustain Energy Rev. 2014;39:403–411. doi:10.1016/j.rser.2014.07.018.
- Ren J, Tan S, Dong L, et al. Determining the life cycle energy efficiency of six biofuel systems in China: a data envelopment analysis. Bioresource Technology. 2014;162:1–7. doi:10.1016/j.biortech.2014.03.105.
- Bi B, Song W, Wu J. A clustering method for evaluating the environmental performance based on slacks-based measure. Computer & Industrial Eng. 2014;72:169–177.
- Nabavi-Pelesaraei A, Abdi R, Rafiee S, et al. Timization of energy required and greenhouse gas emissions analysis for orange producers using data envelopment analysis approach. J Cleaner Produc. 2014;65:311–317. doi:10.1016/j.jclepro.2013.08.019.
- Ebrahimi R, Salehi M. Investigation of CO2 emission reduction and improving energy use efficiency of button mushroom production using data envelopment analysis. J Cleaner Product. 2015;103:112–119. doi:10.1016/j.jclepro.2014.02.032.
- Wu F, Zhou P, Zhou D. Does there exist energy congestion? Empirical evidence from Chinese industrial sectors. Energy Efficiency. 2015;9(2):371–384.
- Yao X, Guo C, Shao S, et al. Total factor Co2 emission performance of China’s provincial industrial sector: a meta-frontier non-radial Malmquist index approach. Appl Energy. 2016;184:1142–1153. doi:10.1016/j.apenergy.2016.08.064.
- Sueyoshi T, Goto M, Sugiyama M. DEA window analysis for environmental assessment in a dynamic time shift: performance assessment of U.S. coal-fired power plants. Energy Economic. 2013;40:845–857. doi:10.1016/j.eneco.2013.09.020.
- Sueyoshi T, Wang D. Radial and non-radial approaches for environmental assessment by data envelopment analysis: corporate sustainability and effective investment for technology innovation. Energy Economic. 2014;45:537–551. doi:10.1016/j.eneco.2014.07.024.
- Sueyoshi T, Goto M. Environmental assessment for corporate sustainability by resource utilization and technology innovation: DEA radial measurement on Japanese industrial sectors. Energy Economic. 2014;46:295–307. doi:10.1016/j.eneco.2014.09.021.
- Goto M, Otsuka A, Sueyoshi T. DEA (Data Envelopment Analysis) assessment of operational and environmental efficiencies on Japanese regional industries. Energy. 2014;66:535–549. doi:10.1016/j.energy.2013.12.020.
- Stiakakis E, Fouliras P. The impact of environmental practices on firms’ efficiency: the case of ICT-producing sectors. Oper Res Int J. 2009;9:311–328. doi:10.1007/s12351-009--9.
- Salazar-Ordóñez M, Pérez-Hernández PP, Martín-Lozano JM. Sugar beet for bioethanol production: an approach based on environmental agricultural outputs. Energy Policy. 2013;55:662–668. doi:10.1016/j.enpol.2012.12.063.
- Zhang N, Choi Y. Environmental energy efficiency of China’s regional economies: a non-oriented slacks-based measure analysis. Soc Sci J. 2013;50:225–234. doi:10.1016/j.soscij.2013.01.003.
- Hathroubi S, Peypoch N, Robinot E. Technical efficiency and environmental management: the Tunisian case. J Hospital Tourism Manag. 2014;21:27–33. doi:10.1016/j.jhtm.2014.03.002.
- Ullah A, Perret SR. Technical-and environmental-efficiency analysis of irrigated cotton-cropping cotton cropping systems in Punjab, Pakistan using data envelopment analysis. Environ Management. 2014;54:288–300. doi:10.1007/s00267-014--4.
- Li M, Wang Q. International environmental efficiency differences and their determinants. Energy. 2014;78:411–420. doi:10.1016/j.energy.2014.10.026.
- Song M, Zhang J, Wang S. Review of the network environmental efficiencies of listed petroleum enterprises in China. Renew Sustain Energy Rev. 2015;43:65–71. doi:10.1016/j.rser.2014.11.050.
- Suzuki S, Nijkamp P, Rietveld P. A target-oriented data envelopment analysis for energy-environment efficiency improvement in Japan. Energy Efficiency. 2015;8:433–446. doi:10.1007/s12053-014--z.
- Chen YX, Han YM, Zhu QX. Energy and environmental efficiency evaluation based on a novel data envelopment analysis: an application in petrochemical industries. Appl Thermal Eng. 2017;119:156–164. doi:10.1016/j.applthermaleng.2017.03.051.
- Geng Z, Dong J, Han Y, et al. Energy and environment efficiency analysis based on an improved environment DEA cross-model: case study of complex chemical processes. Appl Energy. 2017;205:465–476. doi:10.1016/j.apenergy.2017.07.132.
- Köne AÇ, Büke T. A comparison for Turkish provinces’ performance of urban air pollution. Renew Sustain Energy Rev. 2012;16:1300–1310. doi:10.1016/j.rser.2011.10.006.
- Gómez-Calvet R, Conesa D, Gómez-Calvet AR, et al. On the dynamics of eco-efficiency performance in the European Union. Comput Operat Res. 2016;66:336–350. doi:10.1016/j.cor.2015.07.018.
- Farrell MJ. The measurement of productive efficiency. J Royal Statistical Soc. 1957;120:253–281. doi:10.2307/2343100.
- Charnes A, Cooper W, Rhodes E. Measuring the efficiency of decision- making units. Eur J Oper Res. 1978;2:429–444. doi:10.1016/0377-(78)90138-8.
- Banker RD, Charnes RF, Cooper WW. Some models for estimating technical and scale inefficiencies in data envelopment analysis. Manage Sci. 1984;30:1078–1092. doi:10.1287/mnsc.30.9.1078.
- Tone‚ K. A slacks-based measure of efficiency in data envelopment analysis. Eur J Operational Res. 2001;130:498–509. doi:10.1016/S-2217(99)00407-5.
- Klopp GA. (1985), “The Analysis of the Efficiency of Productive Systems with Multiple Inputs and Outputs,” University of Illinois at Chicago, PhD, Doctor of Philosophy, Engineering, Industrial.
- Färe R, Grosskopf S, Norris M, et al. Productivity growth, technical progress, and efficiency change in industrialized countries. Am Eco Rev. 1994;84:66–83. Vol.
- Färe R, Grosskopf S. Productivity and intermediate products: A frontier approach. Econom Lett. 1996;50:65–70. Vol. doi:10.1016/0165-(95)00729-6.
- Bogetoft P, Christensen DL, Damgard I, et al. (2008) Multiparty Computation Goes Live. Financial Cryptography and Data Security. Berlin: Springer Berlin Heidelberg: 325–343.
- Chen CM. Network-DEA, a model with new efficiency measures to incorporate the dynamic effect in production networks. Eur J Oper Res. 2009;194:687–699. Vol. doi:10.1016/j.ejor.2007.12.025.
- Kao C. A linear formulation of the two-level DEA model. Omega. 2008;36:958–962. doi:10.1016/j.omega.2008.01.002.
- Nemoto J, Goto M. Dynamic data envelopment analysis: modeling intertemporal behavior of a firm in the presence of productive inefficiencies. Econom Lett. 1999;64:51–56. doi:10.1016/S-1765(99)00070-1.
- Nemoto J, Goto M. Measurement of dynamic efficiency in production: an application of data envelopment analysis to japanese electric utilities. J Product Analy. 2003;19:191–210. doi:10.1023/A:1022805500570.
- Park KS, Park K. Measurement of multi-period aggregative efficiency. Eur J Oper Res. 2009;193:567–580. Vol. doi:10.1016/j.ejor.2007.11.028.
- Sueyoshi T, Sekitani K. Returns to scale in dynamic DEA. Eur J Oper Res. 2005;161:536–544. doi:10.1016/j.ejor.2003.08.055.
- Chang H, Choy HL, Cooper WW, et al. Using malmquist indexes to measure changes in the productivity and efficiency of us accounting firms before and after the sarbanes. Omega. 2009;37:951–960. doi:10.1016/j.omega.2008.08.004.
- Tone K, Tsutsui M. Dynamic DEA: a slacks-based measure approach. Omega. 2010;38:145–156. doi:10.1016/j.omega.2009.07.003.
- Li YL, Yung-Ho C, Lu LC. Urban energy environment efficiency in China: based on dynamic meta-frontier SBM. J Air Waste Manag Assoc. 2018;69(3):320–332. doi:10.1080/10962247.2018.1537942.
- China Statistical Yearbook. (2017). National Bureau of statistics of China. China Statistical Yearbook. http://www.stats.gov.cn/
- China Statistical Yearbooks Database. (2017), “Demographics and the Employment Statistical Yearbook of China, and the Statistical Yearbooks of all Cities.” China: China Academic Journals Electronic Publishing House, China. http://www.stats.gov.cn/
- Lv W, Hong X, Fang K. Chinese regional energy efficiency change and its determinants analysis: malmquist index and Tobit model. Ann Oper Res. 2015;228:9–22. doi:10.1007/s10479-012-5.