
 ?Mathematical formulae have been encoded as MathML and are displayed in this HTML version using MathJax in order to improve their display. Uncheck the box to turn MathJax off. This feature requires Javascript. Click on a formula to zoom.
Abstract
A study was conducted on mango orchards with different collar diameter in the age group 2–10 years old with the objective of finding out the best growth model for prediction of biomass and carbon stock. The biomass components of mango trees in the orchard were measured and fitted to various growth models, namely Linear, Allometric, Logistic, Gompertz, Richard’s, Negative exponential, Monomolecular, Mitcherlich and Weibull to find out the parameter estimates of the models and validated the best fitted model. Among the models, Gompertz was found best suited for prediction of biomass and carbon stock in mango orchards. The various criteria selected for best fitted model having lowest Akaike information criteria (AICc) of 90.62, lowest root mean square error (RMSE) of 1.56 kg tree−1 and highest adjusted R2 of 0.973. The predicted total biomass varied from 0.53 to 10.5 Mg ha−1 with mean annual increment of 0.26–1.05 Mg ha−1 in 2–10-year-old mango orchards. The highest predicted total biomass carbon in a 10-year-old mango orchard with an average collar diameter of 14.33 cm was 3.87 Mg ha−1. The carbon mitigation potential of a 10-year-old mango orchard was highest with 3.0 Mg ha−1 with a corresponding carbon dioxide mitigation of 11.04 Mg ha−1 in hot and sub-humid climate.
Introduction
Global warming is amongst the most dreaded problems of the new millennium. Carbon emission is the strongest causal factor for global warming. Trees are amongst the most significant elements of any landscape, due to both biomass and diversity. However, it is paradoxical that the vegetation has undergone destruction and degradation in the modern times due to industrial and technological advancement achieved by human society. This advancement has resulted in emission of carbon in the ecosystem. Therefore, there is a need to address environmental issues related to them. Trees are important sinks for atmospheric carbon, that is, carbon dioxide, since 50% of their standing biomass is carbon itself [Citation1].
The terrestrial ecosystem is a major biological scrubber of atmospheric carbon dioxide that can be significantly increased by careful management. Absorbing carbon dioxide from atmosphere and moving into the physiological system and biomass of the plants, and finally into the soil is the only practical way of removing large volumes of the major greenhouse gas (CO2) from the atmosphere into the biological system. Thus, the carbon is sequestered into the plants and then from the plants to the animals. Eventually, after the death of the animals, the detritus decomposes into the soil organic carbon by microbial activities. These sequestered carbons finally act as “sinks” in the forest lands. Fruit trees in orchards are categorized as trees outside forests and have a significant contribution towards carbon sequestration. Sequestering carbon through tree-based systems is considered as an attractive economic opportunity for carbon trading. The majority of the Indian population is dependent on agriculture, so that fruit tree-based systems provide a long-term strategy to increase the amount of carbon along with food crops.
Mango (Mangifera indica L.) is widely cultivated in India and is known as the “King of fruits”. At present the total land area under mango cultivation in India is about 2.26 million ha with a production of 21.8 million tons [Citation2], contributing 40.5% of the total world production of mango. The mango is a juicy stone fruit and is the top fruit crops of India and other Asian countries. Mango trees can be used in C sequestration schemes such as the Clean Development Mechanisms (CDM), so better information is required about above- and below-ground C stocks, and thus, there is a strong need to develop allometric models that could be used to predict the available biomass. This will help in the whole process of reduced emission from deforestation and degradation mechanism which will be in place for mango farmers’ compensation. Growing recognition of the potential economic importance of trees outside the forest could help improve the situation in the same way that forests gained attention [Citation3]. Understanding the carbon storage potential of mango trees will likely provide additional value to farmers’ livelihood in poverty alleviation in carbon market schemes such as REDD+.
An essential aspect of studies on plant growth and reproduction, for perennial plants in particular, is the accurate and non-destructive estimation of key variables of interest such as biomass (above-ground and below-ground), and carbon stock, using the least amount of measurements possible. Such estimation implies the need for accurate and reliable predictive models. Biomass estimation of above-ground and below-ground enables the assessment of the amount of carbon that a forest can store. Biomass assessment is an important factor for National Development Planning as well as for scientific studies of carbon budget [Citation4]. Quantification of biomass and carbon storage has been developed for various forest plants such as Populus deltoids, Eucalyptus, Dalbergia sissoo, Tectona grandis and Grewia optiva by using diameter at breast height (DBH) in various growth models [Citation5–8]. This approach is very commonly practised in forestry, but the same is not true in perennial horticulture. But few attempts have been made to study the potential of fruit trees in carbon sequestration from non-forested area. Mango orchards are established with grafted seedlings and trained with multi-stem below DBH (1.37 m height from ground) to have more canopy spread and fruit yield. In such trees DBH is not practically possible.
In the terrestrial ecosystem, the plant biomass is an important attribute for assessing carbon stocks. The biomass estimation of individual trees or orchards is important for the valuation of the amount of CO2 that is sequestered from the atmosphere as well as changes in the carbon stock. Although biomass has long been of principal importance and interest in forestry, this approach in horticultural plants is very poorly studied. No previous studies to measure the biomass of age series from 2 to 10 years has been attempted in mango orchards of the eastern region of India and information pertaining to biomass, carbon stock and sequestration rates of fruit trees are scanty. Hence we attempted to develop a best fitted model for the estimation of biomass and carbon stock in mango orchards by adopting destructive sampling. The objective of this study was to build best fitted models for estimation of above-ground biomass, below-ground biomass, total biomass and total carbon stock of mango plants of different collar diameter.
Materials and methods
Experimental location
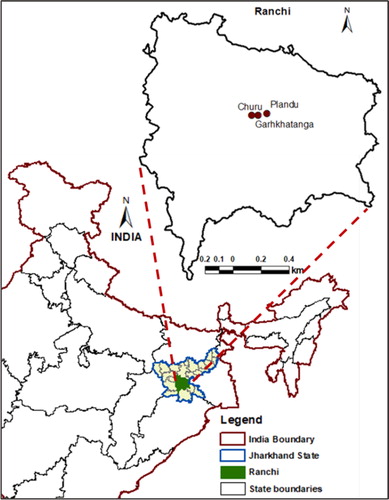
The present investigation was conducted in the eastern plateau and hill region of eastern India between 23° 16' 1.29'' –23° 16' 49.08'' N latitude and 85° 20' 25.21''–85° 24' 32.25'' E longitude. The climate of the area is hot and sub-humid with an annual mean air temperature of 23.7 °C, having a maximum of 37.2 °C (May) and minimum of 10 °C (January). The mean annual rainfall was about 1400 mm (>90% received during June to October). Relative humidity ranged between 55% (winter) and 88% (rainy season). The soils of the region belongs to the order alfisols with acidic (pH 4.5–5.5) in reaction with low levels of organic carbon [Citation9]. Different-aged mango orchards (Cultivar: Amrapalli) of 2–10 years old planted from 2006 to 2014 in Garkhatanga, Churu and Plandu farm of the Indian Council of Agricultural Research Complex for Eastern Region, Research Centre, Ranchi, Jharkhand, India were selected for the investigation (). The mango fruit plants were planted at a spacing of 5 m (between plant) ×5 m (between row) accommodating 400 plants in one hectare. All the fruit orchards received farm yard manure (FYM) at 15 t ha−1 yr−1. Recommended doses of N-P2O5-K2O for mango was 100-30-90 g tree−1 for 1–3 year olds; an annual increase of N-P2O5-K2O for mango was 50-16-30 g tree−1 up to 10 years. The dose of N-P2O5-K2O for mango at 10 years becoming 450-150-300 g tree−1.
Figure 1. Location of the study plots in eastern plateau and hill region of India (Ranchi, India).
Tree biomass sampling
Different-aged mango plants from 2, 4, 6, 8 and 10 years were assessed for above- and below-ground biomass. The mango orchards of all ages cover an area of 2000 m2 with 80 plants having 16 plants in 400 m2 area under each age orchard. An area of 15 × 15 m was marked in each age orchard of 400 m2 area and six plants were randomly selected. The collar diameter was measured at 30 cm above the ground level for all selected trees. From the selected area, 30 trees comprising six trees from each age class were harvested in December 2016. The roots were excavated from the soil volume of 1.5 m3 in each harvested tree. The whole tree was separated into root, bole, branch and leaf. The fresh weight of different components of tree was determined in the field using a heavy weight spring balance and pan balance. Samples of 500 g (fresh weight) of each tree component were oven dried at 60 °C until a constant weight was obtained. The dry weights of different tree components were estimated by using the fresh weight/dry weight factor.
Model fitting and validation
Various growth models were fitted to establish a relationship between biomass (kg plant−1) and the collar diameter (cm) of the tree. A total of nine models were attempted viz. Linear, Allometric, Logistic, Gompertz, Richard’s, Negative exponential, Monomolecular, Mitcherlich and Weibull. All growth functions were fitted to the observed dataset and scattered plots of total biomass vs collar diameter were drawn. For statistical validation of the model, Paired “t” test between the actual observed weights and model predicted weights were performed with the null hypothesis that there is no significant difference between observed and predicted values. Out of the nine models, the best performing model (based on different criteria) was used for establishing a relationship in different components. The relationship between biomass of different tree components was established using Gompertz model as,
Where Y represents dry weight of the component (kg tree−1), X represents collar diameter of individual tree (cm), ε is the random error term with the assumption of normally distributed with mean zero; a, b and c represents the model coefficient.
The measured biomass components viz. bole (stem wood), branches, leaves and roots of 30 mango trees aged 2–10 years were fitted through the Gompertz model using a collar diameter of the tree as an independent variable to calculate the various coefficients of the model, namely, a, b and c.
The root mean square error (RMSE), relative root mean square error (RMSE %) and relative mean bias (%) of biomass were calculated as,
where
is observed value,
is predicted value,
is average observed value, n is the number of trees, and p is the number of parameters.
Biomass and carbon stock estimation
The predicted biomass of different-aged mango orchards were computed by using developed models. The total biomass stock (Mg ha−1) of tree components under the same collar diameter range was obtained by multiplying the tree density (400 trees ha−1) with biomass of each tree component. The carbon content in plant samples was analysed by CHNS analyser (Elementar Vario EL III, Hanau, Germany). Carbon stocks in different plant components were obtained by multiplying their biomass values with their average carbon content. Total carbon stock (Mg ha−1) was estimated by multiplying the total carbon in the individual tree with the plant density. Emitted carbon is represented as the carbon present in the leaves for a short period, whereas stored carbon means carbon in the bole, root and branch stored for a longer period and cumulatively called stored carbon. Then mitigated carbon = stored carbon – emitted carbon.
Statistical analysis
The descriptive statistics (mean, median, variance, coefficient of variation, standard deviation, skewness, kurtosis, Shaphiro-Wilk’s test), fitting of different equations (estimates of model parameters, asymptotic standard error of estimate, confidence interval, adjusted R2 values, Akaike information criteria, root mean square error), plotting of various graphs pertaining to residual diagnostics (auto correlation plots of residuals, plot of residuals against their predicted variate, plot of residual against explanatory variate, plot of explanatory variate against their predicted variate) and model validation (paired t-test between observed and predicted values, fitting of linear regression between observed and predicted values) were computed by using XLSTAT 2017. Different growth functions viz. Linear, Allometric, Logistic, Gompertz, Richard’s, Negative exponential, Monomolecular, Mitcherlich, Von Bertalanffy and Weibull were attempted and choice of the best was based on validation criterions.
Results and discussion
The collar diameter (CD) of 30 different mango trees aged 2–10 years old with their corresponding biomass component is presented in . The collar diameter among the mango trees ranged from 0.9 to 18.5 cm with a mean of 8 cm. The above-ground biomass constituting branch, stem and leaf of tree varied from 0.16 to 24.55 kg tree−1 with a mean 12.67 kg tree−1 among the 30 different-aged mango trees. Further, the below-ground biomass among the mango trees varied from 0.1 to 3.66 kg tree−1 with a mean of 1.88 kg tree−1. The total biomass of mango trees ranged from 0.27 to 28.07 kg tree−1 among the 2–10-year-old mango trees with a mean of 14.55 kg tree−1. The Shaphiro-Wilk’s p-value was smaller than 0.05 for all the biomass components of the tree and thus confirmed the normality of these dependent variables. Colbert et al. [Citation10] confirmed best estimates of maximum basal-area growth of oak trees using Chapman-Richards predictive models and observed one independent variable in predictive models are simple, less time consuming and thus requiring less effort in field measurements. Further Nath et al. [Citation11] indicated that biomass stock of bamboo estimated from DBH without harvesting of the trees was reliable.
Table 1. Summary statistics of collar diameter and dry biomass component of harvested trees of Mangifera indica.
The parameter estimates and the statistics derived from the fit of the growth functions by using the collar diameter and total biomass are showed in . The adjusted R2 of all the growth functions ranged from 0.929 to 0.973, which showed all models are apparently equally efficient. The highest adjusted R2 of 0.973 was observed in Gompertz model. The R2 alone should not be used as a criterion to judge the best fitting growth model [Citation12]. The Akaike information criteria (AIC) is a measure of the relative quality of statistical models for a given data and provides a means for model selection [Citation13]. Hurvich and Tsai [Citation14] further refined this AIC to correct for small data samples as AICc (AIC with a correction for finite sample sizes). AICc is more general and is used in place of AIC to judge the best fitted model. Lower AICc (or AIC) score of the fitted model is the best criteria for selection. The lowest AICc among the fitted model was 90.62 in Gompertz model.
Table 2. Parameter estimates of the models fitted on 80% dataset for total biomass in Mangifera indica.
The explanatory and predicted values of total biomass for all the nine models corresponding to each collar diameter are presented in . The root mean square error (RMSE) for all the nine models varied from 1.56 to 2.589 kg tree−1. Lower value of the RMSE is one of the criteria for selection of best predictive model. The non-linear growth models viz. Monomolecular and Weibull showed negative value of predicted variate and cannot be suitable for prediction purposes. The other six non-linear growth models viz. Allometric, Logistic, Gompertz, Richard’s, Negative exponential and Mitcherlich were tested for suitability for prediction purposes based on RMSE and it was observed that the Gompertz model had the lowest RMSE of 1.510 kg tree−1 with relative RMSE of 10.72% for total biomass. For the linear model, the predicted value of biomass comes out as negative for the lower values of explanatory variate (CD) and hence cannot be recommended for prediction purposes [Citation15]. Out of the nine models, the Gompertz model was found suitable for prediction based on higher adjusted R2, lower AICc and lower RMSE. The results of the present investigation find supports from Devaranavadgi et al. [Citation16], who compared four growth models for different tree species in the dryland of north Karnataka, India and observed that the Gompertz model showed best fit with highest R2 value (0.9968–0.9986) and least standard error (0.0289–0.1279) for nine species of Acacia auriculiformis, Acacia nilotica, Bahunia purpurea, Butea monosperma, Casuarina equsitifolia, Cassia siamea, Inga dulce, Samanea saman and Tamarindus indica. The relative RMSE of biomass components of mango gradually decreased with increasing age of mango plant (). The low relative RMSE of young age orchard was attributed to low biomass stock. Kohl et al. [Citation17] observed year-to-year variations in growth and biomass accumulation in three tropical tree species of Cedrela odorata L., Hymenaea courbaril L. and Goupia glabra Aubl.
Figure 2. Plots of relative RMSE of biomass components of Mangifera indica with age of plants.
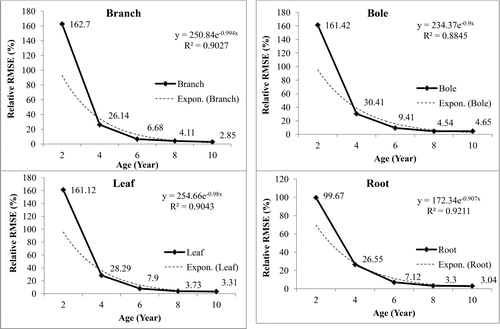
Table 3. Explanatory and predicted values of total dry biomass (kg tree-1) and the associated root mean square error for each fitted model.
All the dataset of total biomass was randomly divided into 80 and 20% mutually exclusive and independent observations, respectively for estimation and validation of the models. For statistical validation of model, the residual measures (the difference between observed and predicted values) for perfect models must coincide and two criterions were considered: 1) the linear regression between observed and predicted values (obs = a + b × pred) should lead to “a” values approaching zero and “b” values approaching one; 2) paired t-test of observed and predicted values should lead to the “t” values approaching zero and p-values approaching one (). Thus, among the growth models, the Gompertz model fulfilled the validation criterions to the best possible extent (approaching closely the standard values).
Table 4. Validation of different models of total biomass-collar diameter on 20% dataset in Mangifera indica.
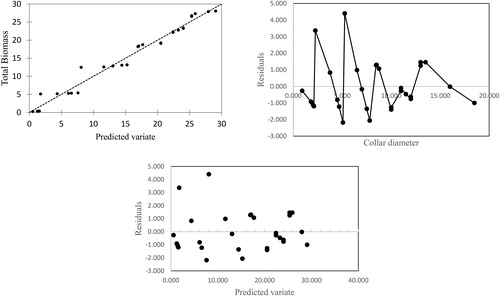
The residual termed as error of prediction is computed as the difference between the observed total biomass and predicted total biomass. Theoretically, the residual should be independently and normally distributed with mean zero and constant variance. The normality of the residuals was tested using Anderson–Darling tests with the null hypothesis that the residuals are normally distributed. The plots of residuals against the explanatory variate (CD) as well as predicted variate ensure that the residuals are not being continuously over/under estimated for total biomass ().
Figure 3. Plots of residual against predicted variate and explanatory variate.
The adjusted R2 for different biomass components in the fitted Gompertz model varied from 0.974 to 0.982 (). The highest adjusted R2 was observed in branch (0.982) and least in bole (0.974). It was observed that the “t” values for all the biomass components were non-significant (p > 0.05) thus indicating that the Gompertz model fitted to different tree components are well validated.
Table 5. Gompertz model [ ] fitted to different biomass components [Y- component biomass (kg tree−1) and X- CD (cm)].
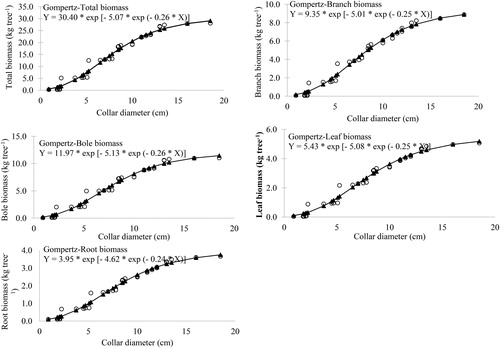
The predicted biomass components of mango were estimated by using the collar diameter and parameter estimates (a, b and c) in the Gompertz model and presented in . The predicted total biomass varied from 0.53 to 10.5 Mg ha−1 among the 2–10-year-old mango orchard and accounted for 84.3–87.26% by above-ground biomass (Bole, Branch and Leaf). Among the different components of mango, the biomass of bole was comparatively higher than the other components irrespective of ages of plant. In general, bole contributed more than branch and the least contribution was made by the leaf. This is because the mango was trained and pruned in such a way that open crown surface increases, which leads to more fruiting and hence increased bole dimension. The bole biomass varied from 0.20 to 4.15 Mg ha−1 with a share of 37.5–39.3% of total biomass among the 2–10-year-old mango orchard. Rathore et al. [Citation18] also reported higher allocation of bole biomass (26.1–31.5%) in Psidium guajava planted in bouldery riverbed lands in the North-Western Himalayas, India. The predicted biomass of branch varied from 0.16 to 3.19 Mg ha−1, which accounted for average 30% of total biomass of mango. Similarly, the leaf biomass ranged from 0.09 to 1.86 Mg ha−1, which was comparable to the values (0.12–0.8 Mg ha−1) reported by Vishwanatham et al. [Citation19] for Grewia optiva. The distribution of biomass components in woody plants is affected by many factors such as growth habit of the species, site quality, age, climatic, edaphic factors and management practices [Citation20, Citation21]. The predicted root biomass of mango in the prevailing low fertile acidic soils [Citation9] was 0.08–1.34 Mg ha−1 and accounted for a average 13.5% of total biomass. The root biomass is comparatively lower than reported by Rathore et al. [Citation18] in Psidium guajava but higher than Litchi chinensis [Citation22]. The mean annual increment (MAI) of different-aged mango orchard varied from 0.26-1.11 Mg ha−1 yr−1 with highest in 8-year-old orchards.
Table 6. Component wise biomass estimates (Mg ha−1) in Mangifera indica.
The scattered plot of collar diameter and biomass components of mango showed the predicted shape of growth functions and fitted well in the scattered plot ().
Figure 4. Gompertz model fitted to the observed dataset of biomass vs collar diameter in Mangifera indica.
Using the Gompertz model, the carbon content in different components of mango tree was estimated and presented in . The measured average carbon content in different components of mango trees was 46.5, 44.6, 44.8 and 44.4% in leaf, branch, bole and root, respectively. The collar diameter of the tree with parameter estimates of the respective tree components was fitted in the model to get the predicted carbon content of their corresponding tree components. The “t” values for all the biomass components were non-significant (p > 0.05) and thereby indicating that Gompertz models for different tree components carbon content were well validated. The scattered plot of collar diameter and biomass carbon components of mango showed the predicted shape of growth functions and fitted well in the scattered plot (). The predicted total biomass carbon stored in mango orchards (branch, bole and root) varied from 0.2 Mg ha−1 in 2-year-old to 3.87 Mg ha−1 in 10-year-old orchards (). The stored carbon was highest in bole ranged from 0.09 to 1.86 Mg ha−1 and accounted for 45–48% of total stored carbon. Swamy et al. [Citation23] confirmed that the carbon storage is directly linked with the site quality, nature of land use, choice of species and crop management practices adopted and observed mean annual carbon accumulation in the tree layer of G. arborea was 4.308 Mg ha−1 year−1. The emitted carbon constituted the carbon stored in leaves and varied from 0.04 to 0.87 Mg ha−1 in 2–10-year-old mango orchards. The mitigation of carbon in 2–10-year-old mango orchards ranged from 0.15 to 3.0 Mg ha−1, which sequestered 0.57–11.04 Mg ha−1 of CO2 from the atmosphere. The C mitigation potential of mango orchards was dependent on the age, structure, tree density and C concentration in different components and thus variations have been observed in similar studies as reported by Swamy and Puri [Citation24] in Gmelina arborea; Kanime et al. [Citation25] in plantations of Populus deltoides, Eucalyptus tereticornis, Dalbergia sissoo, Mangifera indica, Litchi chinensis and Prunus salicina; Oelbermann et al. [Citation26] in Erythrina poeppigiana.
Figure 5. Gompertz model fitted to the observed dataset of biomass carbon vs collar diameter in Mangifera indica.
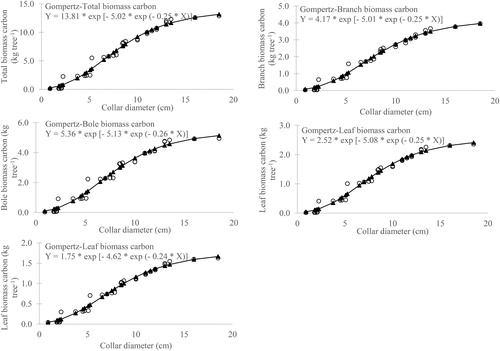
Table 7. Gompertz model [Y = a × exp (-b x exp (-c × X)) + ε] fitted for carbon content at different tree components [Y- component carbon (kg tree-1) and X-CD (cm)].
Table 8. Component wise carbon stock estimates (Mg ha-1) in Mangifera indica.
Conclusions
The mango orchards grown in the eastern plateau and hill region of India help to meet the diverse needs of food, fodder, fuelwood and timber besides producing significant biomass. These orchards also make an important contribution towards C stock by atmospheric CO2 sequestration. The best fitted Gompertz model for mango orchard are only valid within the collar diameter range considered during sampling because they do not include other sources of variation. The distribution of carbon varied among the components of biomass and across the ages of mango orchards. The total biomass carbon increased with increasing collar diameter and ages of mango plants. The large fraction of stored biomass carbon accounted 45–48% in the bole of mango plants. It is concluded from the present study that the carbon sequestration potential of mango orchards varied from 0.57 Mg ha−1 in 2-year-old to 11.04 Mg ha−1 of CO2 in 10-year-old orchards. Hence, the non-destructive estimation of biomass carbon with best fitted Gompertz model has implications for C-estimation through the protection of mango orchards from destruction, thus limiting CO2 emission and ultimately global warming. The component-wise biomass models developed in the present investigation are likely to be useful to mango growers for estimating standing biomass productivity and biomass carbon stock at any stage of growth before harvesting, by simply measuring the collar diameter values and also for estimating additional revenue in terms of carbon credit.
Acknowledgments
The authors wish to acknowledge the Indian Council of Agricultural Research, New Delhi, India for providing funding and facility for carrying out this research. We also thank the anonymous reviewers for their critical comments and suggestions that helped in the improvement of the manuscript.
Disclosure statement
No potential conflict of interest was reported by the authors.
References
- Ravindranath NH, Somashekhar BS, Gadgil M. Carbon flow in Indian forests. Climate Change. 1997;35:297–320.doi:10.1023/A:1005303405404.
- National Horticulture Board (NHB). Final area and production estimates for horticulture crops for 2017–2018, New Delhi, India; 2018. Available from: http://nhb.gov.in/statistics/State_Level/2017-18-(Final).pdf
- Foresta de H, Sommariba E, Temu A, et al. Towards the assessment of trees outside forests: resources assessment. Rome, Italy: Food and Agriculture Organization; 2013. (Working Paper No. 183). p. 335.
- Naveenkumar J, Arunkumar KS, Sundarapandian SM. Biomass and carbon stocks of a tropical dry forest of the Javadi Hills, Eastern Ghats, India. Carbon Manage. 2017;8:351. doi:10.1080/17583004.2017.1362946.
- Ajit, Das DK, Chaturvedi OP, et al. Predictive models for dry weight estimation of above and below ground biomass components of Populus deltoides in India: development and comparative diagnosis. Biomass Bioenergy. 2011;35:1145–1152.
- Bohre P, Chaubey OP, Singhal PK. Biomass accumulation and carbon sequestration in Dalbergia sissoo Roxb. Int J Biosci Biotechnol. 2012;4:29–44.
- Lodhiyal N, Lodhiyal LS. Biomass and net primary productivity of Bhabar Shisham forests in Central Himalaya, India. Forest Ecol Manag. 2003;176:217–235. doi:10.1016/S-1127(02)00267-0.
- Verma A, Kaushal R, Alam NM, et al. Predictive models for biomass and carbon stocks estimation in Grewia optiva on degraded lands in Western Himalaya. Agroforest Syst. 2014;88:895–905. doi:10.1007/s10457-014-9734-1.
- Naik SK, Sarkar PK, Das B, et al. Predictive models for dry biomass and carbon stock estimation in Litchi chinensis under hot and dry sub-humid climate. Arch Agron Soil Sci. 2018a;64:1366–1378. doi:10.1080/03650340.2018.1434718.
- Colbert JJ, Schuckers M, Fekedulegn D, et al. Individual tree basal-area growth parameter estimates for four models. Ecol Modell. 2004;174:115–126. doi:10.1016/j.ecolmodel.2004.01.001.
- Nath AJ, Das G, Das AK. Above ground standing biomass and carbon storage in village bamboos in North East India. Biomass Bioenergy. 2009;33:1188–1196. doi:10.1016/j.biombioe.2009.05.020.
- Prajneshu, Chandran KP. Comparison of compound growth rates in agriculture: revisited. Agric Econ Res Rev. 2005;18:317–324.
- Akaike H. Information theory as an extension of the maximum likelihood principle. In: Petrov BN, Csaki F, editors. Second International Symposium on Information Theory. Budapest: Akademiai Kiado; 1973. p. 267–281.
- Hurvich C, Tsai CL. Regression and time series model selection in small samples. Biometrica 1989;76:297–293. doi:10.2307/2336663.
- Ajit, Srivastava PN, Gupta VK, et al. Linear tree growth models: a limitation of negative estimation of size. Indian Forester. 2000;126:1336–1341.
- Devaranavadgi SB, Bassappa RB, Jolli SY, et al. Height-age growth curve modelling for different tree species in drylands of North Karnataka. Global J Sci Fron Res Agric Vet Sci. 2013;13:11–21.
- Kohl M, Neupane PR, Lotfiomran N. The impact of tree age on biomass growth and carbon accumulation capacity: a retrospective analysis using tree ring data of three tropical tree species grown in natural forests of Suriname. PLoS One. 2017;12:e0181187. doi:10.1371/journal.pone.0181187.
- Rathore AC, Kumar A, Tomar JMS, et al. Predictive models for biomass and carbon stock estimation in Psidium guajava on bouldery riverbed lands in North-Western Himalayas, India. Agroforest Syst. 2018;92:171–182. doi:10.1007/s10457-016-0023-z.
- Vishwanatham MK, Samra JS, Sharma AR. Biomass production of trees and grasses in a silvopasture system on marginal lands of Doon Valley of North-West India. 1. Performance of tree species. Agrofor Syst. 1999;46:181–196.
- Jana BK, Biswas S, Majumder M, et al. Carbon sequestration rate and aboveground biomass carbon potential of four young species. J Ecol Nat Environ. 2009;1:15–24.
- Niu X, Duiker SW. Carbon sequestration potential by afforestation of marginal agricultural land in the Midwestern US. For Ecol Manage. 2006;223:415–427. doi:10.1016/j.foreco.2005.12.044.
- Naik SK, Maurya S, Mukherjee D, et al. Rates of decomposition and nutrient mineralization of leaf litter from different orchards under hot and dry sub-humid climate. Arch Agron Soil Sci. 2018b;64:560–573. doi:10.1080/03650340.2017.1362104.
- Swamy SL, Puri S, Singh AK. Growth, biomass, carbon storage and nutrient distribution in Gmelina arborea stands on red lateritic soils in Central India. Bioresou Technol. 2003;90:109–126. doi:10.1016/S-8524(03)00120-2.
- Swamy SL, Puri S. Biomass production and carbon sequestration of Gmelina arborea in plantation and agroforestry system in India. Agroforest Syst. 2005;64:181–195. doi:10.1007/s10457-004--3.
- Kanime N, Kaushal R, Tewari SK, et al. Biomass production and carbon sequestration in different tree-based systems of Central Himalayan Tarai region. For Trees Livelihoods. 2013;22:38–50. doi:10.1080/14728028.2013.764073.
- Oelbermann M, Voroney RP, Gordon AM. Carbon sequestration in tropical and temperate agroforestry systems: a review with examples from Costa Rica and southern Canada. Agric Ecosyst Environ. 2004;104:359–377. doi:10.1016/j.agee.2004.04.001.