
 ?Mathematical formulae have been encoded as MathML and are displayed in this HTML version using MathJax in order to improve their display. Uncheck the box to turn MathJax off. This feature requires Javascript. Click on a formula to zoom.
Abstract
The changes in land use systems result in remarkable variations in SOC and its dynamics which subsequently govern soil biochemical processes, microbial and metabolic indices in soil. The detail understanding about the responses of different C pools to land uses is essential for maintaining the soil quality. The present study was undertaken in six rainfed land use systems of north eastern Punjab, India comprising of agriculture, horticulture, agri-horticulture, forestry, agroforestry and barren lands. The soil samples (0–15 cm) were collected and analyzed for soil carbon fractions and biochemical activities. The oxidisable carbon fractions i.e. very labile carbon, labile carbon, less labile carbon, recalcitrant carbon and total organic carbon contents in soil varied significantly from 0.09%–0.22%, 0.09%–0.23%, 0.02%–0.15%, 0.15%–0.72% and 0.83%–4.68%, respectively. The soil dehydrogenase activity, soil microbial biomass carbon, metabolic and microbial quotients showed significant variations and ranged from 5.4 –10.9 µg TPF g−1 soil h−1, 34.9 –184.5 µg g−1soil, 0.0011–0.0034, 45.0–195.5, respectively. Agri-horticulture and forestry system were observed to be best environment friendly and sustainable system in rainfed regions. Carbon management index (28.9%), metabolic potential (9.8%) and total organic carbon (5.4%) were three topmost soil quality indicators for soil health in rainfed land use systems.
Introduction
Soil organic carbon (SOC) is the main source of energy for soil microorganisms and plays vital role in regulating climate, water supplies, biodiversity and improving the ecosystems essential for human well-being [Citation1]. SOC is the least understood component of soils due to heterogeneous mixture of organic compounds [Citation2]. SOC play key role in soil’s quality, availability of plant nutrients, environmental functions and global C cycle [Citation3]. SOC fractions provide better understanding about the mechanisms of stabilization, functions [Citation4] and dynamics of soil carbon under different land use systems [Citation5]. The oxidizable soil carbon extracted with 18 N H2SO4 (labile carbon) are often characterized as the active carbon pools which decompose within a few weeks or months. The variations in labile carbon are higher than less labile (oxidizable soil carbon extracted between 18 N to 24 N H2SO4) and recalcitrant carbon (oxidizable soil carbon between total organic cabon and 24 N H2SO4) due to changes in land use systems [Citation6]. The recalcitrant C fractions are known as passive C pool may remain in the soil for years or even decades. Labile fraction of soil organic carbon and soil enzymes serve as sensitive indicators for changes in management-induced soil quality [Citation7]. The passive pools are the more appropriate fractions for carbon sequestration [Citation8]. The changes in land use systems results in variations in soil organic carbon fractions and their dynamics [Citation9], which subsequently govern soil physical, chemical and microbiological processes [Citation10]. The practices like plantation of high biomass-producing crops, crop residue recycling, application of manures, plantation of perennial crops, adopting crop rotation and promotion of agro-forestry systems increase the carbon level in agro-ecosystems [Citation11]. Agroforestry and agri-horticulture systems retain trees or other woody perennials along with the agricultural crops and are considered a suitable practice for soil carbon sequestration [Citation12].
In India, about 58% of the net cultivated area is rainfed i.e. 83.0 million hectares [Citation13], which supports about 44% of the total food production. In Punjab, rainfed agriculture is practiced in 3.97 million hectares (known as Kandi area), which are facing problems of soil fertility reduction, erratic rainfall and low soil moisture is experienced in winter crops. Soil erosion through water is one of the major problems in these areas during monsoons and moisture stress for winter crops [Citation14]. The water table is very deep and rainfall is the only source of water in these areas. In rainfed areas. The mismanagement of land use under rainfed areas has led to significant loss of carbon due to soil erosion, low crop productivity, lower soil water holding capacity, decline in soil biodiversity which result in hunger and poverty in developing countries. The drylands generally have poor fertility and low organic matter content; hence dryland management practices and land-use policies need to be improved to increase the amount of C sequestered in the soil. It is also essential to understand in detail the influence of land use systems on soil organic carbon pools and soil enzymatic activities for environment conservation and for sustaining agricultural production. A little information is available about the soil organic pools in rainfed areas of Punjab. Hence, the present study was undertaken to assess the influence of rainfed land use systems on fraction of soil organic carbon and soil biochemical properties in north eastern region of Punjab, India
Materials and methods
Study site
The study was conducted in north eastern region of Punjab at Balachaur in district Shahid Bhagat Singh (SBS) Nagar, Punjab India, located at 31° 31′ to 34° 61′ N latitude and 74° 55′–76° 35′ E longitude with an average elevation of 296 m (). The region experiences tropical steppe, hot, semi-arid type of climate and bimodal type of rainfall pattern. The mean annual rainfall is about 1055 mm and 80% of which occurs from June to September. The mean maximum temperature ranges from 19.3 °C (January) to 38.5 °C (May) and average minimum temperature ranges from 6.9 °C in December to 25.6 °C in July. The soil moisture regime is ustic with hyperthermic temperature regime. The major soils groups present in the study area are Haplustalfs, Haplustepts and Ustorthens. The region is mainly characterized by loamy sand to sandy clay loam texture and prone to soil-water erosion. The six prominent land use systems in the region (agriculture, horticulture, agri-horticulture, forestry, agroforestry and barren lands) were undertaken for the study. The detail of land use systems is given in .
Figure 1. Location of the study area.
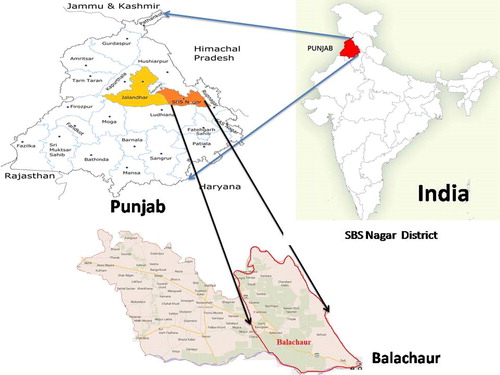
Table 1. Detail of land use systems and standard agronomic practices.
Soil sampling
The study comprised of six main land use systems and 18 sub land use systems. A total of 108 soil samples were collected from 18 sub land use systems with six samples from each sub land use system. The sampling sites were selected in such a manner that the given areas were in juxtaposition having similar soil type. Soil sampling sites were indentified using global positioning system (GPS) and soil samples (0–15 cm) were collected from defined location after the harvest of monsoon season crop. After removing visible root debris, the soil samples from each plot were mixed, sieved (2 mm) and divided into two halves. While, one-half of sample was immediately stored at 4 °C to assay enzymes, the other half was air-dried and stored for analysis of various carbon fractions.
Laboratory analyses
Soil samples were analyzed for soil texture following International pipette method, pH (1:2.5 soil:water suspension), electrical conductivity (EC, 1:2.5 w/v soil:water suspension), soil organic carbon [Citation15], Labile fractions of carbon (KMnO4 oxidizable organic carbon [Citation16], dichromate oxidizable carbon [Citation17], water soluble organic carbon and dissolved organic carbon [Citation18]. The organic matter fractions (viz. humic, fulvic, non-humic, humic acid carbon and humification index) were also estimated by method given by Schnitzer [Citation19].
(1)
(1)
(2)
(2)
The oxidizable carbon fractions (viz. very labile, labile, less labile and recalcitrant carbon) were determined by modified Walkley–Black method using three acid–aqueous solution ratios of 0.5:1, 1:1 and 2:1 [Citation17] and total organic carbon by ignition method [Citation20]. The carbon management index (CMI) determined using following formula
(3)
(3)
Where LI (lability index), C fract1 (very labile carbon); C fract2 (labile carbon); C fract3 (less labile) and TSOC (total soil organic carbon).
(4)
(4)
(5)
(5)
Dehydrogenase activity in soil:One g of fresh soil was mixed with 0.1 g of calcium carbonate (CaC03) and 1 ml of 1% TTC (2,3,5-triphenylterazolium chloride) solution. The mixture was shaken, plugged with a rubber stopper and incubated at 30 °C for 24 h in an incubator. Three replicates were maintained in each case. The resulting slurry was transferred on Whatman filter paper No.1 and extracted with successive aliquots of concentrated methanol. The volume of the filtrate was made to 50 ml by adding methanol. The optical density of the filtrate was read on Spectrophotometer at 485 nm using methanol extract as a blank [Citation21].
Basal soil respiration:Soil respiration rate was determined by alkali absorption method [Citation22]. The 50 g dry weight soils at 60 per cent of field holding capacity were pre-incubated at 25 °C for 20 days. The 10 ml NaOH (0.1 M) solution in each jar was maintained for 24 h at 25 °C. After 24 h, 2 ml of 0.5 M BaCl2 and 2 drops of phenolphthalein indicator were added into alkali and then titrated with 0.1 M HCl. The CO2 absorbed from the soil was calculated using the formula proposed by Anderson and Ingram [Citation23]
Soil microbial biomass carbon (SMBC): It was measured according to the chloroform fumigation-extraction method [Citation24]. Soil samples of 12.5 g of soil (dry weight equivalent) were fumigated with CHCl3 for 24 h at 20 °C in triplicate. Fumigated and non-fumigated samples were extracted with 0.5 M K2SO4 (30 min at 200 rpm), then filtered using a 0.45-µm cellulose ester filter.
(6)
Metabolic indices viz. metabolic quotient (qCO2; microbial respiration per unit microbial biomass), metabolic potential (dehydrogenase activity/water soluble carbon) [Citation25] and microbial quotient (qmic as Soil microbial biomass carbon/total organic carbon) [Citation26] were further determined.
Statistical analysis
Statistical analysis of the results was carried out using analysis of one-way variance of variance (ANOVA) with for comparative evaluation among different sub-land use systems. Comparison between means of the treatments at probability level (p) ≤ 0.05 was considered to be significant at 5% level of significance. Correlations between different soil properties was calculated by Pearson correlation coefficient using IBM SPSS statistics 23Principal component analysis (PCA) was performed on different soil properties by statistically grouping through varimax rotation procedure [Citation27]. The PCs with eigen value more than 1 were selected for further selection of indicators [Citation28, Citation29]. In each PC, the indicator with highest factor loading either positive or negative is selected for further scoring. Each indicator is categorized as “more is better” or “less is better”, for linear scoring. In case “more is better”- highest observed value, “Less is better”- lowest observed value were used to divide each observation and to get the score 1 [Citation30].
Soil quality index (SQI)
The per cent variation of each PC to total percent variation gave the weighted factor (W) for each selected indicator from the PCA [Citation30]. The SQI is computed by integrating score (S) and weight factor (W) of each indicator using the following equation:
Soil having higher index score indicates better performance of soil quality indicators
Results
Soil properties
The soil pH values showed non-significant variations from 7.3 to 7.9 among different land use systems. The electrical conductivity (EC) varied significant (0.31 to 0.61 dS m−1) among different land use systems. The highest value of EC (0.61 dS m−1) was observed in soils of mango-based horticulture system, while lowest EC was observed in soils of peach based agri-horticulture system (). Soil texture varied from loamy sand to sandy loam. The sand, silt and clay contents were observed in the range of 75.6 to 90.0, 4.3 to 11.8 and 9.7 to 19.7%, respectively.
Table 2. Effect of different land use systems on physicochemical properties of soil.
The soil organic carbon (SOC) varied significantly (0.20%–0.63%) among different land use systems. The average highest values soil organic carbon content was observed for agri-horticulture system followed by forestry > horticulture > agroforestry > agriculture > barren land. Among the agri-horticulture system, SOC content varied from 0.54 –0.63% and all the subsystems was found to be statistically at par with each other. In horticulture systems, significant variations were observed within horticulture subsystems. The average SOC value was maximum in horticulture nursery and minimum in mandarin hybrid plantation. The Barren land possessed the lowest soil organic content (0.20%) among all the land uses under the study area ().
Table 3. Effect of different land use systems on soil organic carbon and labile soil carbon fractions.
Soil carbon fractions
The soil carbon fractions analyzed during the study included labile carbon fractions, organic matter fractions, oxidizable carbon fractions, total carbon and carbon management index. The detailed results are discussed as:
The labile carbon fraction includes the potassium permanganate-oxidizable carbon (KMnO4-C), water extractable organic carbon (WEOC), dichromate oxidizable organic carbon (DOXC) and dissolved organic carbon (DOC). The labile carbon fraction showed non-significant variations among different land use systems, however varied from 1392–2636 mg kg−1 for KMnO4-C, 0.013–0.018% for WEOC, 0.47 to 0.85% for DOX and 0.0033 and 0.0043% for DOC content, respectively ().
The soil organic matter includes decomposed and undecomposed products which are non-humic substances and humic substances, respectively. The humic substances further include humic acid, fulvic acid and humic acid carbon. The variations in non-humic and humic substances under different land use systems of the study area were found to be non-significant. The non-humic content varied from 0.006–0.015% and highest was recorded in agri-horticulture systems (0.013%–0.015%). The humic substances, fulvic acid and humic acid carbon content among different land use systems varied from 0.021–0.045, 0.014–0.022 and 133–329%, respectively (). The humification index (HI) also varied from 0.095 in barren land to 0.264 in eucalyptus based forestry system.
Table 4. Effect of different land use systems on organic matter fractions of soil.
Chan et al. [Citation17] worked with different concentrations of extracting agent to determine soil quality by measuring very labile carbon, labile carbon, less labile carbon, recalcitrant carbon and total organic carbon contents in soil. The very labile carbon content depicted the readily available form of carbon occurring in soils and showed non-significant variations (0.09 to 0.22%) among different land use systems. The average highest value for very labile C content was observed in gooseberry based agri-horticulture system and lowest in barren land use systems (). The labile C content showed significant variations among different land use systems and was found to vary between 0.09 and 0.23%. All the land use systems had significantly higher labile C over the barren land system. The less labile C content varied significantly in land use systems and varied from 0.02 and 0.15%. The significant variations within the subsystems were recorded in horticulture, agri-horticulture and agriculture system. In forestry based systems, all the subsystems were found to be statistically at par with each other. The minimum value less labile C content was recorded in barren land use system (0.02%). The recalcitrant form of carbon is stored in the soil complexes and become available to plant during the stress conditions. The recalcitrant carbon in soil varied from 0.15–0.72%. The recalcitrant carbon was highest in mandarin hybrid based agri-horticulture system followed by chinaberry-based forestry and lowest content was observed for barren land use systems (0.15%).
Table 5. Effect of different land use systems on oxidizable fractions of soil carbon.
The total organic carbon (TOC) in soil included both decomposed and undecomposed forms. In our study the total organic carbon content was observed to vary significantly among different land systems. The total organic carbon was observed to be higher under guava (4.68%) based horticulture system followed by mandarin hybrid (3.52%) and horticulture nursery (2.89%). In maize-wheat system (2.58%) had higher TOC than the fodder-oilseed systems (1.81%). Among agri-horticulture system, gooseberry plantation (2.60%) had higher TOC than guava (2.30%), mango (2.05%), mandarin hybrid (1.72%) and peach (1.05%) plantations. Among forestry system, the trend for TOC was populus (1.83%) > chinaberry (1.74%) > eucalyptus (0.83%).
The carbon management index (CMI) is considered as a sensitive indicator of soil management practices and an important indicator of soil quality. The CMI was observed to vary significantly from 11.0 to 27.2%. The highest and lowest CMI was observed for gooseberry based agri-horticulture (27.2%) and barren land use (11.0%) systems, respectively.
Dehydrogenase activity
The dehydrogenase activity (DHA) in soils depicted the overall oxidative activity of soil microorganisms and varied significantly among land use systems. The highest values for DHA were observed in agri-horticulture system on mean basis and in subsystems, the trend was gooseberry (10.5 µg TPF g−1 h−1) > guava (10.2 µg TPF g−1 h−1) > mandarin hybrid (10.0 µg TPF g−1 h−1) > mango (9.9 µg TPF g−1 h−1) > peach (9.5 µg TPF g−1 h−1). Maize – wheat system (8.9 µg TPF g−1 h−1) was observed to have higher DHA content than the fodder-oil seed crops based system (8.4 µg TPF g−1 h−1). The lowest DHA content was observed in barren lands (5.4 µg TPF g−1 h−1).
Microbial and metabolic indices
The microbial and metabolic indices include soil microbial biomass carbon content, basal soil respiration metabolic quotients, metabolic potentials and microbial quotients. The soil microbial biomass carbon (MBC) content was found to vary significantly among different land use systems. The highest MBC content was recorded in mango based agri-horticulture system (184.5 µg g−1soil), followed by gooseberry based agri-horticulture system (173.6 µg g−1soil), eucalyptus-based forestry system (162.3 µg g−1soil) and minimum content was recorded in barren land system (34.9 µg g−1soil). Basal soil respiration (BSR) is regarded as an important indicator of soil health as it indicates the level of microbial activity, SOM content and its decomposition. The soil respiration content in soil showed non-significant variations and varied from 0.13 to 0.27 µg CO2g−1 soil h−1 among the different land use systems (). The land use systems also showed significant variation in metabolic quotients, metabolic potentials and microbial quotients. The metabolic quotients were observed to be higher in eucalyptus based forestry system (0.034) followed by fodder-oilseed based agriculture system (0.030), mango based horticulture system (0.029) and minimum in barren land system (0.011). The values for metabolic potential were higher in the nursery under horticulture system (778.6) followed by populus in forestry system (721.4), mandarin hybrid in agri-horticulture system (714.3) and minimum in barren land system (415.4). Microbial quotients among different land use systems varied from 45.0 to 195.5 with highest values in eucalyptus based forestry system and minimum in barren land.
Table 6. Effect of different land use systems on dehydrogenase activity, microbial and metabolic quotients.
Principal component analysis (PCA)
PCA described the overall pattern of sensitivity of all measured soil parameters and most variable parameters based on factor loadings from each principal component (PC) (). The weightage of each PC on the basis of percent variance to total variance ranged from 0.56 to 0.08 (). The most influential variables for PC1 was carbon management index, metabolic potential for PC2, total organic carbon for PC3, less labile carbon for PC4 and fuvic acid for PC5 on the basis of eigen vector weight value or factor loading (). The soil quality index (SQI) obtained under the land use was maximum under agri-horticulture (0.59%) followed by forestry (0.58%), agroforestry (0.51%), horticulture (0.50%), agriculture (0.49%) and eroded system (0.43%), respectively (). The contribution of selected indicators to soil quality under different land use system is presented in . The order of contribution of the selected indicators to SQI was 28.9% for CMI, 9.8% for MP, 5.4% for TOC, 4.8% for LLC, and 2.7% for FA ().
Figure 2. Principal component analysis for soil properties and systems.
DHA: Dehydrogenase Activity; BSR: Basal Soil Respiration; MBC: Microbial Biomass Carbon; KMnO4-C: Potassium Permanganate Extractable Carbon; WEOC: Water Extractable Organic Carbon; DOXC: Dichromate Oxidizable Carbon; DOC: Dissolved Organic Carbon; NH: Non Humic Substances; HS: Humic Substances; FA: Fulvic Acid; HAC: Humic Acid Carbon; HI: Humification Index; VL: Very Labile Carbon; LC: Labile Carbon; LLC: Less Labile Carbon; RC: Recalcitrant Carbon; TOC: Total Organic Carbon; CMI: Carbon Management Index; MP: Metabolic potential; MQ: Metabolic Quotient; Qmic: Microbial quotient.
FD- Forestry chinaberry based, FE-Forestry eucalyptus based, FP-Forestry populus based, FE-Agroforestry chinaberry based, HG-Horticulture guava based, HK-Horticulture mandarin hybrid based, HM-Horticulture mango based, HN-Horticulture nursery based, HP-Horticulture peach based, AA-Agri-horticulture gooseberry based, AG-Agri-horticulture guava based, AM-Agri-horticulture mango based, AP-Agri-horticulture peach based, MW- Agriculture maize-wheat based, FO-Agriculture fodder-oilseed based
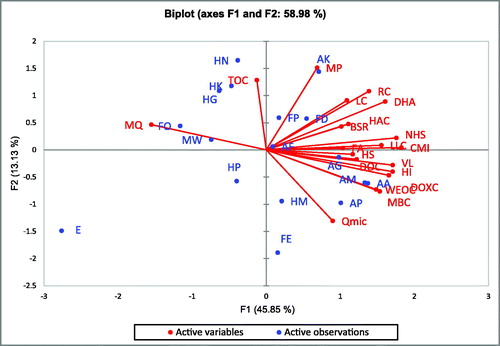
Figure 3. Average effect of different land use systems on soil quality index and the individual contribution of each of the key indicators. CMI-carbon management index, MP-metabolic potential, TOC- total organic carbon, LLC – less labile carbon and FA- fulvic acid.
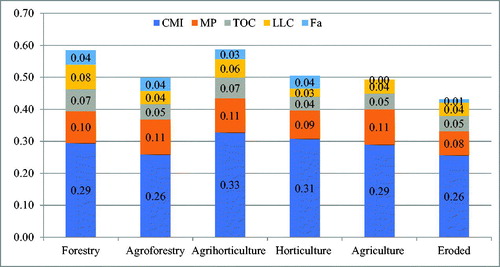
Figure 4. Contribution (%) of selected indicators to soil quality under different land use system (CMI-carbon management index, MP-metabolic potential, TOC- total organic carbon, LLC – less labile carbon and FA- fulvic acid).
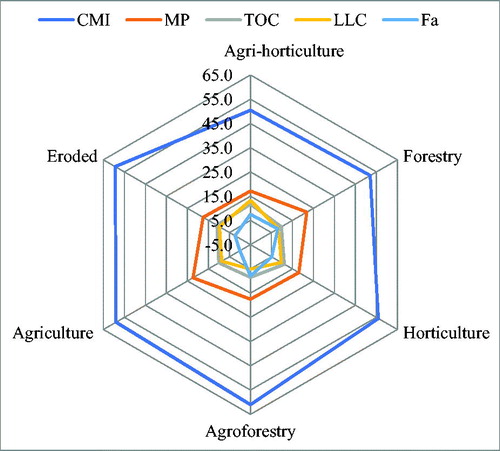
Figure 5. Overall contribution of the selected soil quality indicators to soil quality index. (CMI-carbon management index, MP-metabolic potential, TOC- total organic carbon, LLC – less labile carbon and FA- fulvic acid).
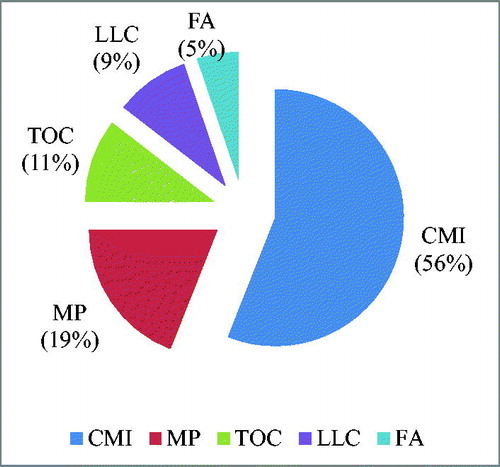
Table 7. Supplementary data indication the loading values and contribution of variable in principal component analysis.
Discussion
Soil physicochemical properties
The soil pH is affected by the factors like climate, topography, land use systems and land management practices [Citation31]. The soils of natural forest and reforested land were significantly more acidic than the grassland and cultivated lands due to higher organic matter content, which released organic acids on decomposition [Citation32]. The low value of EC under in cultivated system was due to excessive leaching of salts and lower organic matter content. The decrease in EC was 6, 16 and, 20 per cent after 8, 16 and 41 years of cultivation, respectively in alpine grassland soils of northern China [Citation33]. The difference in soil particle size distribution was significant among various land use systems. The clay content was highest in forest soils followed by cultivated soils, and least in barren lands [Citation34]. Dhaliwal and Singh [Citation35] reported that forests and cultivated based land use systems had higher clay content as compared to uncultivated and pasture-based systems. The organic matter present in soil also had the significant affect on the soil aggregates. The significantly higher content of clay in forest and grazing land as compared to cultivated land was also observed in different land use systems in Western Ethiopia [Citation36]. The highest value for soil organic carbon content in agri-horticulture system was due to the addition of FYM and pearl millet as main fodder crop in this system. Variations in organic carbon in soils were observed due to varying level leaf litter and their rate of decomposition [Citation37]. Agricultural land use registered lower OC than forest land due to intense cultivation on sloping lands. Land uses have profound influence on many soil attributes through effect on soil organic matter. Intense cultivation reduced soil carbon content and changed the distribution and stability of soil aggregates [Citation38].
Soil carbon fractions
Labile carbon fractions
The labile carbon fractions include KMnO4-C, WEOC, DOXC and DOC. The higher content KMnO4-C in the agri-horticulture system was due to regular addition of crop residue as well as FYM and minimum in barren land due to higher soil erosion effects. The more dense plantation and diverse crop species led to higher litter turnover and higher permanganate oxidizable carbon [Citation39]. Benbi et al. [Citation40] reported higher water extractable organic carbon (WEOC) in agroforestry than the maize–wheat and rice–wheat system, which might be attributed to higher organic matter inputs in agroforestry system than the other two ecosystems. The regular additions of organic matter have priming effect of soil organic matter to increase the soil microbial activities and to enhance the rate of decomposition of SOM [Citation41]. DOC is most mobile and important carbon for microorganisms and easily reflects the soil quality [Citation42].
Organic matter fractions
The organic matter fractions include non-humic substances, humic substances, fulvic acid, humic acid carbon and humification index. The non-humic substances are chemically identifiable plant, microbial and faunal constituents. The values for non-humic substances were higher in agri-horticulture due to regular residue addition to soils under these systems [Citation43]. The humic substances are the unspecified, transformed, dark colored heterogeneous, amorphous and high molecular weight material. The humic acid carbon content was higher in chinaberry-based forestry systems and mandarin hybrid based agri-horticulture system due to higher soil organic matter. The humification index were higher in agri-horticulture and forestry system as compared to other systems.
Oxidizable carbon fractions
Oxidizable carbon fractions include very labile carbon, less labile carbon, labile carbon, recalcitrant carbon and total organic carbon. The trend for very labile carbon was agri-horticulture > forestry > agroforestry > horticulture > agriculture > barren land use system. The labile carbon, less labile carbon, recalcitrant carbon and total carbon content was observed to vary significantly among different land use systems. Benbi et al. [Citation1] reported that agroforestry had higher very labile carbon as compared to uncultivated soils. The higher total carbon content among the agri-horticulture system and forestry based systems might be due to higher rhizodeposition on soils which leads to higher total carbon content than agriculture and barren land use system.
Dehydrogenase activity (DHA)
The higher DHA in nursery under horticulture system was due to the diversities in vegetation, cropping systems, soil amendments and environmental factors affecting the soil properties. The low value of DHA in cropped soils was due to low organic matter content and inhibitory effects of mineral fertilizers [Citation44]. The horticulture and forestry system had higher DHA due to the addition of organic residues on the soil surface which was comparatively higher than the other crops [Citation45]. The organic matter through crop litter could also be considered to stimulate the activity of dehydrogenase by making substrate available for the soil microbial community. The forest systems have more fungal biomass and important component of nutrient cycling in initial stages of organic matter decomposition which resulted in higher DHA in forest soils [Citation46].
Metabolic and microbial indices
The lower soil microbial biomass carbon content in soils under cultivated and barren system was due to rapid oxidation of organic carbon through exposure of the organic matter to microbial attack [Citation42]. The continuous deposition of organic matter through FYM as well as through leaf litter in agri-horticulture system act as source of energy for soil organisms, stimulate the growth of microbial populations and consequently cause the accumulation of carbon in soil microbial biomass [Citation47]. The changes in vegetation might be the reason to alter the above-ground biomass, soil organic matter content, soil microbial communities and plant growth microenvironment which affects the soil respiration and temperature fluctuations [Citation48]. Ashura [Citation49] reported that the forests have higher basal soil respiration than the other land use systems due to relatively dense structure of plants and the continuous deposition of organic matter through leaf litter and fine roots. The land use systems also showed significant variation in metabolic quotients, metabolic potentials and microbial quotients.
Principal component analysis
Principal components analysis (PCA) described that overall sensitivity pattern of soil parameters and most variable parameters depending upon the factor loadings from each principal component (PC). As principal components (PCs) with high eigen values were considered to represent the variations in soil properties [Citation50]. The most imperative soil quality indicator (SQI) variables for PC1 was carbon management index (CMI). The CMI was designed to give an indication of the C dynamics of the system. CMI represents the quality and quantity of soil organic matter of a system relative to a natural forest [Citation51]. The regular addition of organic matter in case of agri-horticulture and forestry systems proved increased potential to increase the CMI by increased inputs and lower losses [Citation52]. CMI lays the foundation to improve productivity of different land use systems using suitable soil management practices [Citation53]. Metabolic potential was the second quality indicator and soil metabolic activity revealed by dehydrogenase enzyme activity in soil. The higher activity of dehydrogenase was explained by the addition of organic residues on the soil surface [Citation16]. Metabolic potential indicated the stimulation of soil metabolism, majorly due to the labile fractions of soil organic matter [Citation54]. TOC was the third quality indicator because stable fraction of carbon accounts for 90 per cent of the total organic carbon (TOC) in terms of particle size distribution [Citation55]. Klotzbücher et al [Citation56] reported that total organic carbon is more affected than the labile portion of carbon by change in land use or management practices. Labile carbon was another important soil quality indicator. Duvala et al [Citation57] reported that soil management practices and soil conditions had significant effects of varying magnitude on soil organic carbon and its labile fractions. Labile carbon disturbance which stabilizes soil aggregates and thus, enhances soil structural properties and soil carbon storage [Citation58]. The fulvic acid was retained due to ample changes in soil organic matter (SOM) which was induced by the anthropogenic interventions like land use system and its management. It also serves as a sensitive indicator of change in organic matter levels and equilibria. Among different land use systems, SQI was highest under agri-horticulture system and forestry system and minimum in eroded system. Nair [Citation59] reported that agro-forestry, agri-horticulture, and grassland systems have the potential to reduce both the runoff and erosion, and maintain better soil organic matter, which in return would help in improving the fertility status of the soil. Islam and Weil [Citation7] reported that conversion of forest land to cultivated system resulted in the deterioration of soil properties. The lowest SQI under the land use eroded system was mainly attributed to less vegetation, plant residue returned to the soil and no build-up of organic matter. Singh et al. [Citation60] reported the same sequence of sustainability index of this area as: forest (1.12) > grasses (0.84) > cultivated (0.75) > bare (0.68).
Summary
In overall, the study revealed that agri-horticulture followed by forestry system is considered as biodiverse, environmentally friendly and sustainable land use by improving soil carbon and biochemical properties. In systems, mango based agri-horticulture system, populus based forestry system were found to have higher values for soil carbon fractions and biochemical activities over other systems. Among different properties, carbon management index is the main component followed by metabolic potential, total organic carbon, labile carbon and fulvic acid were the best quality indicator of soil quality under rainfed land use systems.
Acknowledgement
We sincerely thank Director, Centre of All India Coordinated Research Project for Dryland agriculture, Ballowal Saunkhri, Punjab, Directorate of Research, Head Department of Soil Science, Punjab Agricultural University, Ludhiana and for their financial assistance and technical guidance. The views expressed in this paper are those of individual scientists and do not necessarily reflect the views of the donor or the authors’ institution.
Disclosure statement
The authors declare that they have no conflict of interest.
References
- Benbi DK, Brar K, Toor AS, et al. Total and labile pools of soil organic carbon in cultivated and undisturbed soils in northern India. Geoderma 2015;237:149–158. doi:10.1016/j.geoderma.2014.09.002.
- Blanco-Moure N, Gracia R, Bielsa AC, et al. Soil organic matter fractions as affected by tillage and soil texture under semiarid Mediterranean conditions. Soil Tillage Res. 2016;155:381–389. doi:10.1016/j.still.2015.08.011.
- Srinivasarao C, Vittal KPR, Venkateswarlu B, et al. carbon stocks in different soil types under diverse rainfed production systems in tropical India. Commun Soil Sci Plant Anal. 2009;40(15–16):2338–2356. doi:10.1080/00103620903111277.
- Haynes RJ. Labile organic matter fractions as central components of the quality of agricultural soils, an overview. Adv Agron. 2005;85:221–268.
- Gabarron-Galeote MA, Trigalet S, Wesemael B. Effect of land abandonment on soil organic carbon fractions along a Mediterranean precipitation gradient. Geoderma 2015;249–250:69–78. doi:10.1016/j.geoderma.2015.03.007.
- Yang XY, Ren WD, Sun BH. Zhang SL Effects of contrasting soil management regimes on total and labile soil organic carbon fractions in a Loess soil in China. Geoderma 2012;177–178:49–56. doi:10.1016/j.geoderma.2012.01.033.
- Islam KR, Weil RR. Land use effects on soil quality in a tropical forest ecosystem of Bangladesh. Agric Ecosyst Environ. 2000;79:9–16. doi:10.1016/S0167-8809(99)00145-0.
- Cheng HH, Kimble JM. Characterization of soil organic carbon pools In: Lal R, JM Kimble, R F Follett, and B A Stewart editors. Assessment methods for soil carbon. Boca Raton, FL: Lewis Publishers; 2001.
- Raiesi F, Ghollarata M. Interaction between phosphorus availability and an AM fungus (Glomus intraradices) and their effects on soil microbial respiration, biomass, enzyme activities in calcareous soil. Pediobiologia 2006;50(5):413–425. doi:10.1016/j.pedobi.2006.08.001.
- Li CF, Zhou DN, Kou ZK, et al. Cai ML Effects of tillage and nitrogen fertilizers on CH4 and CO2 emissions and soil organic carbon in paddy fields of central China. Plos One 2012;7:1–9.
- Nieder R, Benbi DK. Carbon and nitrogen in the terrestrial environment. Berlin, Germany: Springer Science + Business Media B.V.; 2008, p. 430.
- Nair PKR, Kumar BM, Nair VD. Agroforestry as a strategy for carbon sequestration. J Plant Nutr Soil Sci. 2009;172(1):10–23. doi:10.1002/jpln.200800030.
- Rao CS, Lal R, Prasad J, et al. Potential challenges of rainfed farming in India. Adv Agron. 2015;133:113–181.
- Arora S. Preliminary assessment of soil and water conservation status in drought prone foothill region in North West India. J. Soil Water Conserv. 2006;1:55–63.
- Walkley A, Black CA. An examination of the degtjareff Method for determining soil organic matter and a proposed modification of the chromic acid titration method. Soil Sci. 1934;37(1):29–78. doi:10.1097/00010694-193401000-00003.
- Blair GJ, Lefroy RDB, Lisle L. Soil carbon fractions, based on their degree of oxidation and the development of a carbon management index for agricultural system. Aust J Agric Res. 1995;46(7):1459–1466. doi:10.1071/AR9951459.
- Chan KY, Bowman A, Oates A. Oxidizible organic carbon fractions and soil quality changes in an oxicpaleustalf under different pasture leys. Soil Sci. 2001;166(1):61–67. doi:10.1097/00010694-200101000-00009.
- Zhang M, He Z. Long-term changes in organic carbon and nutrients of an Ultisol under rice cropping in Southeast China. Geoderma 2004;118(3–4):167–179. doi:10.1016/S0016-7061(03)00191-5.
- Schnitzer M. Organic matter characterization. In: Page AL, Miller RH, and Keeny DR editors, Methods of soil analysis, part 2: Chemical and microbiological methods. Madsion: American Society of Agronomy; 1982, p. 581–594.
- Ball DF. Loss on ignition as an estimate of organic matter and organic carbon in calcareous soils. Journal of Soil Science. 1964;15(1):84–92. doi:10.1111/j.1365-2389.1964.tb00247.x.
- Tabatai MA. Soil enzymes In: Page AL, editor. Methods of Analysis, part 2 Agronomy, 9, 2nd Ed. Madsion: American Society of Agronomy; 1982, p. 903–947.
- Anderson JPE. Soil respiration In: Miller RH and Keeney DR, editors Methods of soil analysis, Part 2. Chemical and microbiological properties, Agronomy Monograph No. 9, Madison, USA: ASA-SSSA Publisher; 1982, p. 831–871.
- Anderson JM. Ingram JSI Tropical Soil Biology and Fertility: A Handbook of Methods. Wallingford, UK: C.A.B. International; 1993.
- Vance ED, Brookes PC, Jenkinson DS. An extraction method for measuring soil microbial biomass carbon. Soil Biol Biochem. 1987;19(6):703–707. doi:10.1016/0038-0717(87)90052-6.
- Anderson TH, Domsch KH. Ratios of microbial biomass carbon to total organic carbon in arable soils. Soil Biol Biochem. 1989;21(4):471–479. doi:10.1016/0038-0717(89)90117-X.
- Anderson TH, Domsch KH. The metabolic quotient for CO2 (qCO2) as a specific activity parameter to assess the effects of environmental conditions, such as pH, on the microbial biomass of forest soils. Soil Biol Biochem. 1993;25(3):393–395. doi:10.1016/0038-0717(93)90140-7.
- Wold S, Esbensen K, Geladi P. Principal component analysis. Chemometr Intell Lab Syst.1987;2(1-3):37–52. doi:10.1016/0169-7439(87)80084-9.
- Brejda JI, Moorman TB, Karlen DL, et al. Identification of regional soil quality factors and indicators of central and southern high plains. Soil Sci Soc Am J. 2000;64(6):2115–2124. doi:10.2136/sssaj2000.6462115x.
- Rezaei SA, Giles RJ, Andrew SS. A minimum data set for assessing soil quality in rangeland. Geoderma 2006;126:229–234. doi:10.1016/j.geoderma.2006.03.021.
- Singh AK, Bordoloi LJ, Kumar MH, et al. Land use impact on soil quality in eastern Himalayan region of India. Environ Monit Assess. 2013;185:314–325. doi:10.1007/s10661-013-3514-7.
- NRCS. Soil Quality Test Kit Guide. Washington, D.C.,: United States Department of Agriculture; 2001, p. 63–67.
- Islam KR, Weil RR. A rapid microwave digestion method for colorimetric measurement of soil organic carbon. Commun Soil Sci Plant Anal. 1998;29(15–16):2269–2284. doi:10.1080/00103629809370110.
- Wu R, Tiessen H. Effect of land use on soil degradation in alpine grassland soil, China. Soil Sci Soc Am J. 2002;66(5):1648–1655. doi:10.2136/sssaj2002.1648.
- Gupta RD, Arora S, Gupta GD, et al. Soil physical variability in relation to soil erodibility under different land uses in foothills of Siwaliks in N-W India. Trop Ecol 2010;51:183–197.
- Dhaliwal SS, Singh B. Depth-wise distribution of microbial populations, macro and micronutrients under different land use systems in submontaneous tract of Punjab. Int J Life Sci. 2013;2(2):120–127. doi:10.5958/j.2319-1198.2.2.016.
- Yitbarek T, Gebrekidan H, Kibret K, et al. Impacts of land use on selected physicochemical properties of soils of Abobo area, western Ethiopia. AFF. 2013;2(5):177–183. doi:10.11648/j.aff.20130205.11.
- Ray R, Mukhopadhyay K, Biswas P. Soil aggregation and its relationship with physico–chemical properties under various land use systems. Indian J Soil Conserv. 2006;34:28–32.
- Six J, Paustian K, Elliott ET, et al. Soil structure and organic matter distribution of aggregate-size classes and aggregate-associated carbon. Soil Sci Soc Am J. 2000;64(2):681–689. doi:10.2136/sssaj2000.642681x.
- Abraham J. Soil health in different land use systems in comparison to a virgin forest in a tropical region of Kerala. Rubber Sci 2015;28:8–21.
- Benbi DK, Brar K, Toor AS, et al. Soil carbon pools under populus-based agroforestry, rice wheat, and maize-wheat cropping systems in semi-arid India. Nutr Cycl Agroecosyst. 2012;92(1):107–118. doi:10.1007/s10705-011-9475-8.
- Brar BS, Dheri GS, Lal R, et al. Cropping system impacts on carbon fractions and accretions in Typic Ustocrept soils of Punjab. J Crop Improv. 2015;29(3):281–300. doi:10.1080/15427528.2015.1016251.
- Sharma V, Hussain S, Sharma KR, et al. Labile carbon pools and soil organic carbon stocks in the foothill Himalayas under different land use systems. Geoderma 2014;232:81–87. doi:10.1016/j.geoderma.2014.04.039.
- Hernández-Hernández RM, Pulido-Moncada M, Caballero R, et al. Influence of land use change on humic substances and aggregate stability of tropical savanna and forest soils. Rev Facult Agron Univ Zulia 2013;30:551–572.
- Kalambukattu JG, Singh R, Patra AK, et al. Soil carbon pools and carbon management index under different land use systems in the Central Himalayan region. Soil Plant Sci. 2013;63:200–205. doi:10.1080/09064710.2012.749940.
- Kuwano BH, Knob A, Fagotti DSL, et al. Soil quality indicators in a rhodickandiudult under different land uses in Northern Parana, Brazil. Rev Bras Ciênc Solo. 2014;38(1):50–59. doi:10.1590/S0100-06832014000100005.
- Blonska E, Lasota J, Zwydak M. The relationship between soil properties, enzyme activity and land use. Forest Res Paper. 2017;78:39–44. doi:10.1515/frp-2017-0004.
- Justin GK, Raj DS, Patra AK, et al. Land use practices in the Central Himalayan region affect soil enzyme activities and their relationship with carbon pools. Acta Agric Scand B Soil Plant Sci. 2013;63:403–408. doi:10.1080/09064710.2013.789124.
- Han GX, Xing QH, Luo YQ, et al. Vegetation types alter soil respiration and its temperature sensitivity at the field scale in an estuary wetland. Plos One. 2014;9:1–11. doi:10.1371/journal.pone.0091182.
- Ashura soil aggregation and organic carbon fractions under different land uses in submontane Punjab [M.Sc thesis]. Punjab Agricultural University, Ludhiana, India; 2015.
- Zhang Q, Junjun W, Yang F, et al. Xiaoli Cheng Alterations in soil microbial community composition and biomass following agricultural land use change. Sci Rep. 2016;6:365–387. doi:10.1038/srep36587.
- Reddy DD. Determination of labile SOC by KMnO4 oxidation technique and its use in carbon management index In: Muralidharadu Y, Reddy SK and SubbaRao A, editors. Farmers Resource based site specific integrated nutrient management and online fertilizer recommendations using GPS and GIS tools. Bhopal: Indian Institute of Soil Science; 2010, p. 66–69.
- Blair N. Impact of cultivation and sugar-cane green trash management on carbon fractions and aggregate stability for a Chromic Luvisol in Queensland, Australia. Soil Tillage Res. 2000;55(3-4):183–191. doi:10.1016/S0167-1987(00)00113-6.
- Thangavel R, Kanchikerimath M, Sudharsanam A, et al. Evaluating organic carbon fractions, temperature sensitivity and artificial neural network modeling of CO2 efflux in soils: Impact of land use change in subtropical India (Meghalaya). Ecol Indic. 2018;93:129–141. doi:10.1016/j.ecolind.2018.04.077.
- Bhattacharjya S, Bhaduri D, Chauhan S, et al. Comparative Evaluation of three contrasting carbon, land use systems for soil microbial and biochemical Indicators in North-Western Himalaya. Ecol Eng. 2017;103:21–30. doi:10.1016/j.ecoleng.2017.03.001.
- Six J, Feller C, Denef K, et al. Albrecht A Soil organic matter, biota and aggregation in temperate and tropical soils-effects of no-tillage. Agronomie 2002;22(7-8):755–775., doi:10.1051/agro:2002043.
- Klotzbücher T, Kaiser K, Guggenberger G, et al. A new conceptual model for the fate of lignin in decomposing plant litter. Ecology 2011;92(5):1052–1062. doi:10.1890/10-1307.1.
- Duval ME, Galantini JA, Martínez JM, et al. Labile soil organic carbon for assessing soil quality: influence of management practices and edaphic conditions. Catena 2018;171:316–326. doi:10.1016/j.catena.2018.07.023.
- Emran M, Gilspert M, Perdini G. Pattern of soil organic carbon, glomalin and structure stability in abandoned Mediterranean terraced land. Euro J Soil Biol. 2012;63:637–649. doi:10.1111/j.1365-2389.2012.01493.x.
- Nair P. Role of trees in soil productivity and conservation. Soil productivity aspect of agro-forestry. Nairobi: International council for research in Agro-forestry. 1984; p. 85.
- Singh MJ, Khera KLS. Priyabrata Selection of soil physical quality indicators in relation to soil erodibility. Arch Agron Soil Sci. 2012;58(6):657–672. doi:10.1080/03650340.2010.537324.