
 ?Mathematical formulae have been encoded as MathML and are displayed in this HTML version using MathJax in order to improve their display. Uncheck the box to turn MathJax off. This feature requires Javascript. Click on a formula to zoom.
Abstract
To achieve China’s CO2 emissions targets, all Chinese provinces need to ensure that their CO2 emissions are maintained at a reasonable level to avoid the shortboard effect. This paper proposed an integrated method, the LSTM-STIRPAT, to predict the CO2 emissions in 30 provinces, and assess the drivers of a different region. We divide 30 provinces according to the prediction result into provinces with peak value(PWP) and provinces without peak value(PWTP) and found that (i) Inner Mongolia, Jiangxi, Shandong, Hainan, Chongqing, Guizhou, Qinghai, Xinjiang are failed to reach their CO2 emissions peak by 2030, but almost all provinces experienced a small peak in their carbon emissions from 2008 to 2013; (ii) The ranking of CO2 emissions influencing factors in the PWTP is energy intensity (+) > population density (+) > energy consumption (+) > urbanization rate (−) > GDP per capita (+) > ratio of secondary industry (+); the ranking of CO2 emissions influencing factors in the PWP is energy intensity (+) > ratio of secondary industry (+) > urbanization rate (−) > population density (+) > energy consumption (+) > GDP per capita (−); (iii) PWTP's CO2 emissions show a significant lag effect, of which the ratio of secondary industry accounts for the most significant impact. According to the research results, we put forward relevant targeted measures to achieve China's carbon emissions peak commitments in 2030: (1) PWTP should give priority to encouraging the development of technology and strengthening the utilization of new energy and renewable energy; (2) PWP should give priority to reducing energy intensity, optimizing the industrial structure and accelerating the process of urbanization; (3) CO2 emission reduction in PWTP is a long-term task, it is necessary to adhere to the optimization and adjustment of the industrial structure.
Introduction
Climate change has emerged as the most significant global challenge of the twenty first century because of the increasing atmospheric concentration of greenhouse gases (GHGs) [Citation1] and especially the CO2 resulting from fossil fuel energy production, population growth and increased economic development [Citation2]. Since 2009, China has been the most extensive global CO2 emitter, which has begun to threaten both economic growth and resident health. Therefore, reducing carbon emissions is necessary for China’s future [Citation3]. China pledged to reduce CO2 emissions by 60%–65% of 2005 levels by 2030 at the Paris Conference on Climate Change in 2015, which has become a binding long-term planning direction for its national economic and social development. Therefore, identifying and analyzing the factors related to CO2 emissions is vital to the development and implementation of effective emissions reduction policies [Citation4, Citation5]. Based on this, we tried to solve the following three problems: whether China reaches the CO2 emissions peak and fulfill the commitment of the Paris Agreement by 2030; what are the drivers that affect provinces with peak and provinces without peak; how China to achieve emission reduction targets ().
Table 1. Some literature on carbon dioxide emissions forecasting over the last decade.
A sound forecasting technique is essential for accurate investment planning for energy production and distribution, environmental protection, and economic development. Current forecasting methods can be divided into three categories: statistical analysis models, grey prediction models, and non-linear intelligent models. Statistical analysis models, including trend analysis [Citation14], regression model [Citation15, Citation16], have been widely utilized for predicting energy-related CO2 emissions. One disadvantage of statistical analysis models is that their precise forecasts strongly rely on having sufficient input data for parameter estimations, which requires considerable additional energy in data collection to produce accurate forecasting results [Citation7, Citation17]. Grey prediction models, including grey forecasting models [Citation18, Citation19], improved multi-variable grey prediction models [Citation7]. Non-linear intelligent models, including genetic algorithms [Citation20], least squares support vector machine (LSSVM) [Citation13], particle swarm optimization (PSO) [Citation21], harmony search [Citation22, Citation23], long short-term memory model (LSTM) [Citation24, Citation25] or improved Gaussian process regression (GPR) [Citation26, Citation27].
It is critical to make sense the drivers of CO2 emissions for policymakers, only by thoroughly studying the impact of various drivers on CO2 emissions can they develop effective reduction measures, so there are many methods and models to explore the relationships between drivers and CO2 emissions. We used CiteSpace to select 500 relevant works of literature from the database of Web of Science in the past five years and made a co-occurrence analysis. The results are shown in . We can find that the STIRPAT model is one of the hot models to estimate the influencing factors of CO2 emissions [Citation28–33]. Besides, the Logarithmic Mean Division index (LMDI), Index decomposition analysis (IDA), and structural decomposition analysis (SDA) have also been popular methods for investigating the driving forces behind CO2 emissions [Citation34, Citation35]. Previous studies have generally found that CO2 emissions were firmly related to socioeconomic factors [Citation36–39], such as economic growth, population density, urbanization, trade openness, and energy consumption ().
Figure 1. (a) co-occurrence analysis of CO2 emissions’ influencing factors. (b) co-occurrence analysis of the STIRPAT model.
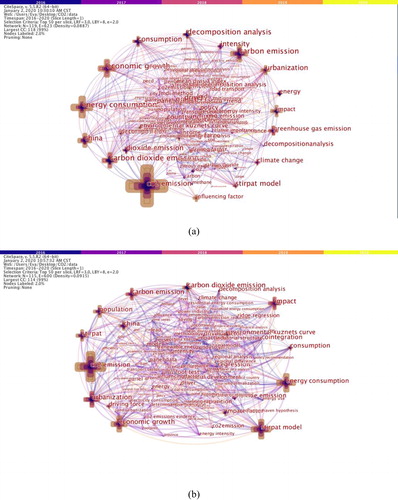
Table 2. Summary of the literature on the influencing factors of carbon emissions.
Existing researches on CO2 emissions prediction are very rich, but each method has a specified scope of application. Based on the previous research, we have deepened the method selection and combined machine learning with classical models. The three innovations of the research in this paper are as follows. First, the long short-term memory model (LSTM) is innovatively combined with the STIRPAT model as an LSTM-STIRPAT model, which is taken to identify the drivers and predict the CO2 emissions peaks in 30 Chinese provinces and proved its stability and accuracy in studying CO2 emissions trends and drivers. By combining deep learning with existing classical models, furtherly enrich the literature on methods for predicting CO2 emissions. Second, CO2 emissions peak is a hot topic, but it is generally predicted from the object of country or urban. Few studies have conducted CO2 emissions predictions by province. We carefully divided the 30 provinces into the provinces with (PWP) or without peak values (PWTP) according to the prediction results and verified the main driving factors through the STIRPAT model. Third, the dynamic relationships between CO2 emissions, economic growth, industry structure, urbanization rate, energy consumption, technology innovation, and population are investigated, and we have drawn the focus of emission reductions between PWP and PWTP by comparison and clarified the targeted policy for CO2 emissions reductions. The remainder of this article is structured as follows: Section “Methodology and data” introduces the LSTM-STIRPAT combined model to explore the CO2 emissions peaks and the associated drivers, Section “China’s CO2 emissions predictions” gives the results for the analyses in 30 Chinese provinces using the proposed LSTM-STIRPAT model, Section “Empirical results and discussion” discusses the empirical results for China’s CO2 emissions driving factors, and Section “Conclusions and policy implications” outlines the policy implications based on the varying regional prediction results.
Methodology and data
LSTM-STIRPAT model
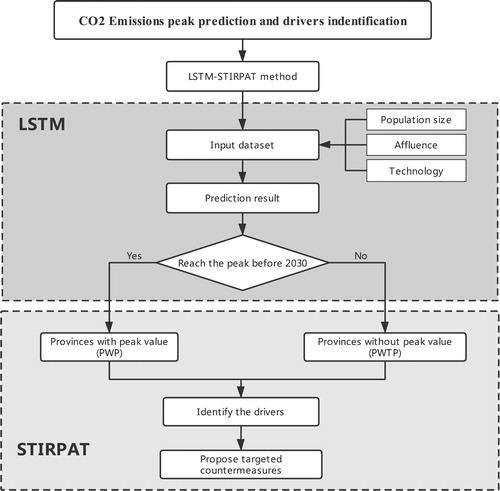
We proposed the LSTM-STIRPAT model to explore and predict the CO2 emissions and the peaks and to identify the associated drivers, which is a combination of the LSTM model and the STIRPAT model. The LSTM is a classic, highly accurate, deep learning method, for which we use the STIRPAT model as a basis for selecting indicators for LSTM input variables and forecast CO2 emissions in 30 provinces. Then, according to the forecast results, 30 provinces will be divided into two parts: one is provinces with peak value (PWP), the other is provinces without peak value (PWTP) depending on whether the peak is reached before 2030. Finally, the empirical analysis of STIRPAT has been adopted to highlights the different priorities of the two regions in reducing emissions and suggested targeted countermeasures. Such a logical framework is for highlighting the differences in driving factors between PWP and PWTP. The LSTM-STIRPAT can form a set of “prediction-identification” methods to conduct in-depth research on regional CO2 emissions, and it also can be applied to other regions and countries to predict the carbon emissions peaks and identify the significant drivers. The LSTM-STIRPAT model flowchart is shown in .
Figure 2. Structure of LSTM-STIRPAT.
Long short-term memory
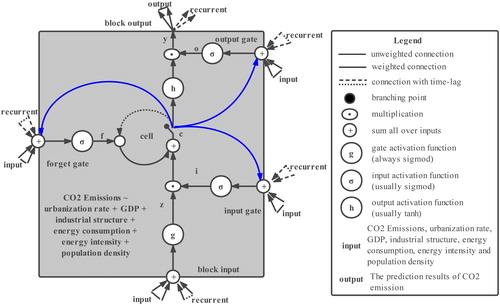
LSTM, which was first proposed by Hochreiter and Schmidhuber [Citation46] and recently improved by Graves [Citation47], has been widely applied because of its high prediction accuracy and excellent time series prediction performances. The LSTM has been able to resolve gradient disappearance problems because of its elaborate network structure, as shown in .
Figure 3. LSTM Structure.
The cells and gates are updated, as shown in EquationEqs. (1)–(6):
(1)
(1)
(2)
(2)
(3)
(3)
(4)
(4)
(5)
(5)
(6)
(6)
Basically, the LSTM has specific memory cells that can add or remove useful information through three gates: input gate (it) , forget gate (ft) , and output gate (ot) , where ct_1 and ct respectively indicate the cell state at times t − 1 and t, gt adds information to the cell state, and the input and hidden layers are represented by xt and ht at time t. denotes the sigmoid function, W and R indicate the input weights and recurrent weights, respectively, and b represents the bias, with the weights being updated by backpropagation using a time algorithm.
To prove the accuracy of the prediction results, we choose MAPE as an indicator to reflect the prediction performance. The smaller the MAPE, the better the prediction accuracy.
(7)
(7)
where
is the real carbon dioxide emissions, and
is the corresponding predicted value.
STIRPAT model
The IPAT model was first proposed by Ehrlich and Holdren [Citation48] to examine the impact of human behavior on the environment, as shown in EquationEq. (8)(8)
(8)
(8)
(8)
where I denotes the environmental pressure, sometimes it could reflect emissions level, P represents the population size, A indicates the affluence, and T is the technology.
However, the IPAT model is unable to identify the different contributions for each of the different factors because it is an accounting equation. To overcome these limitations, Dietz and Rosa [Citation1] improved it and proposed the STIRPAT, which it is a stochastic model that can be used to empirically test hypotheses, by taking the natural logarithmic forms to facilitates estimation and hypothesis testing [Citation49]. The specification of the STIRPAT model is as shown in EquationEqs. (9)(9)
(9) and Equation(10)
(10)
(10)
(9)
(9)
(10)
(10)
where I, P, A, and T have the same indicator as in the IPAT framework, a, b, and c denote the elasticity of population size, economic prosperity, and technology. e indicates the residual error.
The STIRPAT model assumes that environmental pressure is affected by population size, affluence, technology, and many other factors. To determine the driving factors in the Chinese provinces, a STIRPAT model was established and based on previous literature. By summarizing some of the literature on CO2 emission drivers, the results are shown in . GDP per capita, urbanization, energy consumption, population, energy intensity, industrial structure, energy structure, and technology are the main factors affecting carbon emission, so we chose GDP per capita, urbanization, industrial structure, population, technology, and energy consumption as indexes to reflect the I, P, A, T respectively, as shown in EquationEq. (11)(11)
(11) .
(11)
(11)
where i refers to the ith province, CE represents the CO2 emissions, UR denotes the urbanization rate (the percentage of the urban population in the total population), GDP is the affluence (GDP per capita), SEC is the industrial structure (the proportion of secondary industry in GDP), EC is the energy consumption (the consumption of fossil fuels), EI is the technology (energy intensity), PD is the population (population density), and b, c, d, e, f, g indicate the elasticities.
Considering the dependence inertia characteristics of CO2 emissions, that is, a continuous process of dynamic adjustment; CO2 emissions may have a lagged effect. Therefore, based on previous literature and lagged effect test, we introduce a dynamic lagged term of CO2 emissions to control the lagged impact of the CO2 emissions. The extended STIRPAT model was, therefore, as follows:
(12)
(12)
Data processing
From , it can be seen that most studies on CO2 emissions drivers have focused on urbanization, GDP, industrial structure, energy consumption, technology, and population; therefore, the urbanization rate, GDP per capita, the proportion of secondary industry in GDP, fossil fuel consumption, energy intensity, and population density were included in this paper to reflect these indicators. To predict the CO2 emissions peak values in the 30 Chinese provinces, panel data from 1991 to 2017 for each province were extracted as the input variables. As full data for Tibet, Taiwan, Hong Kong, and Macau were not available, these were not included in the analyses. Two kinds of data were collected; data that could be obtained directly and data that needed to be calculated indirectly. GDP and energy consumption data were collected from the China Statistical Yearbook (1991–2017), and the energy consumption data were taken from the China Energy Statistical Yearbooks (1991–2017), which were then converted into the tonnes-coal equivalent. We used the “IPCC Guidelines for National Greenhouse Gas Inventories (IPCC, 2006)” to calculate the energy-related CO2 emissions due to the absence of official data on CO2 emissions. The formulation as follows in EquationEq. (13)(13)
(13) .
(13)
(13)
where I denotes the total CO2 emissions, Ei was the ith kind of primary energy consumption, where i = 1, 2, 3, 4, and represent for coal, oil, natural gas, and non-fossil energy respectively. Ki indicates the fixed carbon emissions coefficient for the ith kind of primary energy, in this paper, Ki were respectively 0.7476, 0.5825, 0.4435 and 0 for coal, oil, natural gas, and non-fossil energy (tonne C/tce). 44/12 represents the ratio of the molecular weights for CO2 and C. The descriptive statistics for all variables, including the definitions, observation numbers, standard deviations, averages, and maximum and minimum values are shown in .
Table 3. Data summary.
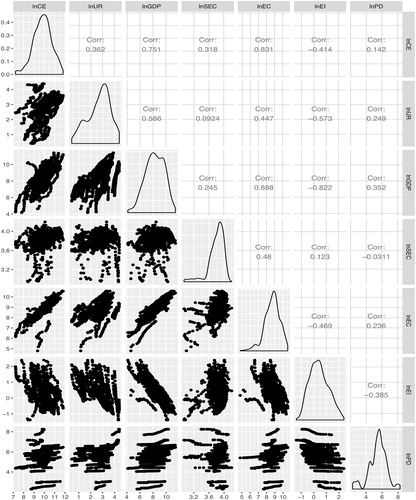
presents the correlation matrix for the dependent and independent variables. As can be seen, the correlation coefficients between lnCE and the explanatory variables were different. Urbanization rate (lnUR), population density (lnPD), secondary industry structure (lnSEC), GDP per capita (lnGDP), and energy consumption (lnEC) were positively correlated with CO2 emissions, and energy intensity (lnEI) and CO2 emissions (lnCE) had a negative correlation. Although almost all correlation coefficients between the different explanatory variables were below 0.8 except for those between GDP per capita and energy consumption, their respective VIFs were smaller than 5, indicating that there was little possibility of multicollinearity.
Figure 4. Pearson’s correlation plots between the variables.
China’s CO2 emissions predictions
As the LSTM is a special type of RNN, it can vanish the gradient because of its “gate” structure. Huang applied the LSTM to predict CO2 emissions and then compared the LSTM, the BPNN, and the GPR results, finding that the LSTM had a higher carbon emissions prediction [Citation50]. From previous literature and the STIRPAT model, it was found that urbanization, GDP per capita, industrial structure, energy consumption, energy intensity, and population density were the significant factors influencing carbon emissions. Therefore, these variables were used as the input variables to predict the carbon emissions peak in the 30 Chinese provinces from 1991 to 2040, and the LSTM was employed to distinguish the provinces with or without peak values. To achieve China’s carbon emissions peak commitment, all provinces need to cooperate and make joint efforts to reach the carbon emissions peak before 2030. Therefore, predicting the CO2 emissions peak in each province is necessary to develop a comprehensive carbon emissions approach. Python was used to determine the LSTM results, with the predictions being shown in .
Figure 5. LSTM prediction results.
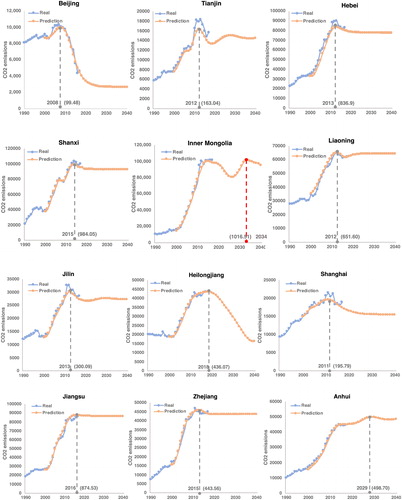
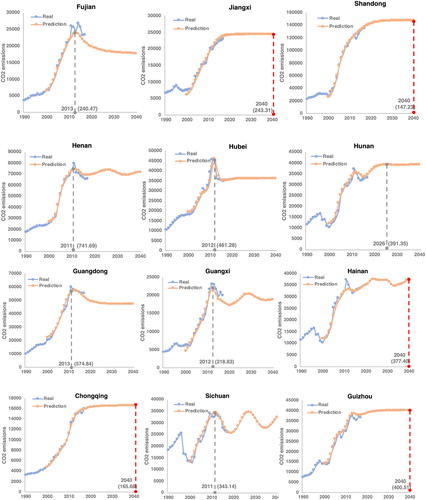
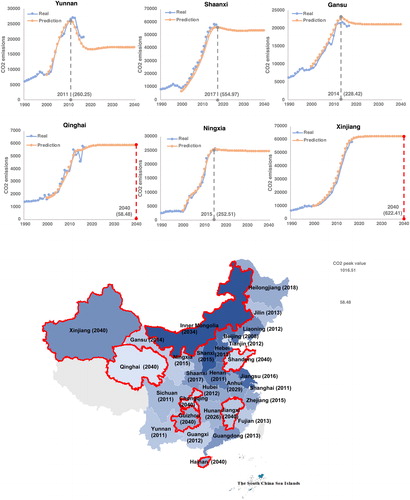
Based on the prediction results, the 30 provinces were divided into those with a CO2 emission peak value (PWP) and those without a CO2 emission peak value (PWTP). As shown in , the provinces with a peak value were Beijing, Tianjin, Hebei, Shanxi, Liaoning, Jilin, Heilongjiang, Shanghai, Jiangsu, Zhejiang, Anhui, Fujian, Henan, Hubei, Hunan, Guangdong, Guangxi, Sichuan, Shaanxi, Gansu, Ningxia; and those without a peak value were Inner Mongolia, Jiangxi, Shandong, Hainan, Chongqing, Guizhou, Qinghai, Xinjiang. Almost all provinces experienced a small peak in their carbon emissions from 2008 to 2013, at which time large scale hazes were being experienced, causing a corresponding rise in respiratory and cardiovascular diseases and generating focused government actions to reduce CO2 emissions. Note that the “Beijing-Tianjin-Hebei” region respectively reached their CO2 emissions peaks in 2008, 2013, 2013 at 99.49 Mt, 163.05 Mt and 836.91 Mt. However, through coordinated regional joint prevention and control efforts as well changes in the industrial structure, the air pollution in “Beijing-Tianjin-Hebei” was controlled, and the carbon emissions began to decrease. Beijing, in particular, introduced several air pollution prevention policies, which resulted in sharp CO2 emissions decreases. From the successful CO2 emission reduction practice of “Beijing-Tianjin-Hebei,” we can learn from that the negative externalities of air pollution make the prevention of air pollution and the reduction of carbon emissions require a systematic awareness, we should strengthen inter-regional cooperation, make full use of regional resources, allocate carbon credits reasonably according to regional development. Besides, the administrative entities in the region should enhance cooperation and information sharing with the surrounding areas. As can be seen, all provinces experienced steep increases in CO2 emissions in the 1990s because of the rapid economic development that was accompanied by a massive increase in the use of fossil fuels. After 2000, Inner Mongolia and Shanxi, as energy production bases, experienced rapid growth in CO2 emissions. For example, CO2 emissions in Inner Mongolia increased almost ten times between 1990 and 20017. The reasons for CO2 emissions in these underdeveloped regions, such as Inner Mongolia and Xinjiang, continue to increase is that these regions serve as energy supply provinces, whose large energy consumption is used for thermal power generation or raw material production and transformed them to other places, such as one-third of the thermal power generation in Inner Mongolia was used to supply electricity to other provinces, and the contribution of energy output value accounts for 50% of its GDP [Citation51]. Correspondingly, developed regions import a large amount of electricity to avoid the local direct emissions; for example, one-third of electricity consumption in Beijing needs to be imported from outside. Besides, due to the lower technological level and labor remuneration of underdeveloped regions, resulting in excessive carbon emission intensity. To sum up, CO2 emissions are a historical issue, because the development mode has established the development orientation of the region, which has affected its regional CO2 emissions. Therefore, reducing CO2 emissions requires long-term unremitting efforts to fundamentally change the local economic development mode, thereby achieving regional sustainable development.
To further demonstrate the prediction accuracy, the MAPE values for each province were calculated. To further illustrate the applicability of the LSTM, the same input variables were used to predict the CO2 emissions in the 30 provinces by using BPNN and GM(1,1), then we compared with the MAPE values among them respectively. It was found that the LSTM had higher stability, a better fitting degree, and higher accuracy in predicting the CO2 emissions (). From the MAPE values with the LSTM, it can be seen the provinces’ MAPE values were all below 10%, indicating that these were accurate prediction results; however, the MAPE values with the BPNN and GM(1,1) had significant fluctuations and errors, especially BPNN shows a larger error in CO2 emissions prediction, which indicates the unparalleled superiority of LSTM in predicting CO2 emissions.
Table 4. MAPE prediction results with the LSTM and the BP.
Empirical results and discussion
From the above prediction results, the provinces without a CO2 emissions peak value were chosen as the research objects to identify the main CO2 emissions drivers using the STIRPAT model, to identify the critical areas on which to focus for future carbon reductions. Variable stationarity was the premise for the balanced panel data, which was determined using the ADF unit root test proposed by Maddala and Wu [Citation52] and the PP test proposed by Choi [Citation53], the results for which are shown in . As can be seen, all variables were found to be stationary, and all passed the panel unit test and the co-integration test.
Table 5. Unit root test for stationarity.
To inform policies to mitigate carbon emissions, it is crucial to understand the factors that influence it. CO2 emissions are influenced by a range of factors; urbanization, economic development, industry structure, energy consumption, energy intensity, and population density. To develop a better understanding of the effects of these factors on CO2 emissions, the STIRPAT model was used to clarify the significant CO2 emissions drivers in the provinces with a peak value (PWP) and the provinces without a peak value (PWTP). Based on the F test and the Hausman test, a fixed-effect model was employed to estimate the PWTP, and a random effect model was used to estimate the PWP.
As shown in , the PWP and PWTP CO2 emissions' main influencing factors were not the same, and the degree of influences varied widely. In the PWTP, UR has a significant inhibitory effect on CO2 emissions. For every 1% increase in the urbanization rate, CO2 emissions decrease by 0.3%. The reasons are complex, of which one might be that rural-urban migration makes people make use of cleaner energy [Citation54]. In contrast, EI, GDP, SEC, PD, and EC have a significant positive effect on CO2 emissions. For every 1% increase in EI, GDP, SEC, PD and EC, CO2 emissions increase by 2.75%, 0.247%, 0.107%, 0.744% and 0.631%. In the PWP, GDP and UR have an inhibitory effect on CO2 emissions. For every 1% increase in GDP and UR, CO2 emissions decrease by 0.004% and 0.671%, respectively. Adversely, SEC, EC, EI, and PD have a significant positive effect on CO2 emissions. For every 1% increase in SEC, EC, EI, and PD, CO2 emissions increase by 1.512%, 0.032%, 1.935%, 0.047%. It is worth mentioning that energy intensity has the most significant impact on CO2 emissions, whether it is PWP or PWTP. Therefore, increasing energy technology innovation, reducing energy intensity, and improving energy efficiency can significantly reduce emissions.
Table 6. Estimated results for the PWP and PWTP.
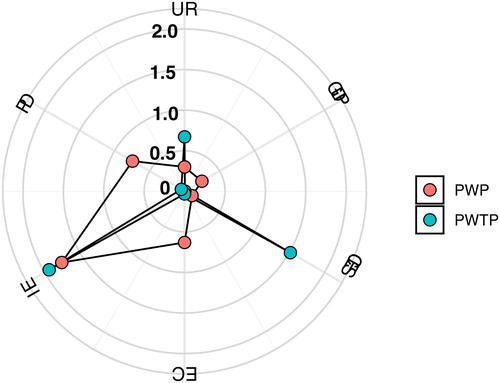
According to the empirical results, we ranked the driving factors, as shown in . We conclude that there is a specific difference in the influencing factors of PWP and PWTP, mainly in that GDP has a negative effect on PWP CO2 emissions, but it has a positive impact on PWTP CO2 emissions. One of the main reasons is the difference in economic development modes. In the PWTP, the economic development of provinces such as Inner Mongolia, Jiangxi, and Shandong is heavily depended on the secondary industry, so CO2 emissions will naturally increase with the development of the economy; however, in the PWP, the economy of provinces represented by Beijing, Shanghai, Guangdong, etc. was dominated by the tertiary industry. Besides, some provinces in PWP are already at a mature stage of economic development, and they pursue high-quality growth. Therefore, more attention is paid to low-carbon, environmental protection, and green economy. Thus, the economic development of PWP can reduce CO2 emissions.
Figure 6. Rank for the CO2 emissions drivers.
After the AR test on the PWP and PWTP models, a lag effect was found in the PWTP but not in the PWP, which further indicated that the CO2 emissions of PWTP were more affected by both current and past factors. Therefore, to also explore the lag effect of PWTP, a lagged term was introduced to reveal the dynamic influence of CO2 emissions, the estimated model results are shown in . We adopted a fixed effect model to estimate the lagged effect of PWTP. As can be seen, the results of the first lagged values of CO2 emissions were significantly positive, indicating that the shock in the first period led to a rise in the current period (0.852***). The confirmation of the lagged effect of CO2 emissions in PWTP shows that early intervention measures can create more space for PWTP emission reductions. The results are consistent with the studies of Wang et al. (2018). It also reflects that CO2 emissions reduction is a long-term task; the achievement may not be evident in the short term. Besides, the ratio of the secondary industry has the most significant lag effect on CO2 emissions, followed by the urbanization rate. Therefore, it is necessary to adhere to the industrial structure adjustment policy for a long time, which is of considerable significance to reducing CO2 emissions.
Table 7. Empirical results for the provinces without a CO2 emission peak value (dynamic).
Conclusions and policy implications
Based on the STIRPAT model, this study selects multiple indicators that affect CO2 emissions and use the LSTM model to predict the CO2 emissions of 30 provinces in China. Then, we conduct an empirical analysis of the influencing factors. The results show that: (1) According to the LSTM-STIRPAT model, eight provinces of China failed to reach their CO2 emissions peak by 2030. They are Inner Mongolia, Jiangxi, Shandong, Hainan, Chongqing, Guizhou, Qinghai, Xinjiang. Besides, almost all provinces experienced a small peak in their carbon emissions from 2008 to 2013; (2) According to the results of the fixed effect model in PWTP and the random effect model in PWP, an increase in population density, the ratio of secondary industry, energy intensity, energy consumption, and GDP would contribute to accelerated CO2 emissions for the PWTP. While an increase in population density, the ratio of secondary industry, energy intensity, and energy consumption would contribute to accelerated CO2 emissions for the PWP. Besides, we conclude that the ranking of CO2 emissions influencing factors in the PWTP is EI(+)> PD(+)>EC(+)>UR(−)>GDP(+)>SEC(+); the ranking of CO2 emissions influencing factors in the PWP is EI(+)>SEC(+)>UR(−)>PD(+)> EC(+)>GDP(−); (3) The PWP CO2 emissions were found to be more affected by current factors, whereas PWTP has been verified that have a significant lag effect on CO2 emissions, which is not only affected by current factors, but also by factors of the past. Among them, the ratio of the secondary industry has the most significant lag effect on CO2 emissions, followed by the urbanization rate.
Since 2011, China has adopted a series of stringent market regulation and administrative means to control air pollution and to fulfill carbon abatement commitments. Taking into account the differences in influencing factors between PWP and PWTP, the emphasis on policy implication in different regions is also different. To reduce CO2 emissions more targeted, some recommendations based on the above research results are provided to reduce CO2 emissions further and contribute to achieving CO2 emissions peak for China as soon as possible: (1) PWTP should give priority to encouraging the development of technology and strengthening the utilization of new energy and renewable energy(e.g. wind energy in Inner Mongolia, Xinjiang, Heilongjiang, etc., solar energy in Tibet, Xinjiang, Gansu, etc., hydropower in the Yangtze River Basin, and biomass energy in Northeast China), monitoring the growth of population (e.g. for Jiangxi and Guizhou) and Regulating energy structure by lowering the proportion of high carbon-intensive energy (e.g. coal, coke). Besides, PWTP must implement new policies to introduce more low-carbon technologies, encourage more environmental-friendly consumption patterns, and formulate stricter environmental regulations to combat climate change (Miao et al., 2019; Yin et al., 2015). (2) PWP should give priority to reducing energy intensity, optimizing industrial structure and accelerating the process of urbanization; (3) CO2 emission reduction in PWTP is a long-term task, it is necessary to adhere to the optimization and adjustment of the industrial structure, which can significantly promote the transformation and upgrading of the industrial structure of PWTP.
This paper innovatively combines the LSTM and STIRPAT models to predict CO2 emissions in 30 provinces, respectively, and to identify its influencing factors, forming a complete system that will help enrich the research of CO2 emissions. However, due to the diversity of prediction methods, the accuracy and applicability of LSTM-STIRPAT may have regional heterogeneity. Therefore, future research should focus on expanding the research area; furtherly apply it to global or some international organizations. Besides, paper selects relevant influencing factors to predict CO2 emissions based on the SATIRPAT model. The influencing factors are only from the perspective of human activities. In the future, the energy perspective will be further considered, and the energy production structure, energy consumption structure, and renewable energy development situation will be considered deeply.
Disclosure statement
No potential conflict of interest was reported by the author(s).
Additional information
Funding
References
- Dietz T, Rosa EA. Effects of population and affluence on CO2 emissions. Proc Natl Acad Sci USA. 1997;94(1):175–179. doi:10.1073/pnas.94.1.175.
- Bong CPC, Lim LY, Ho WS, et al. A review on the global warming potential of cleaner composting and mitigation strategies. J Cleaner Prod. 2017;146:149–157.
- Liu Z. China's carbon emissions report 2016. Cambridge (MA): Harvard Belfer Center for Science and International Affairs; 2016.
- Zhang M, Mu H, Ning Y, et al. Decomposition of energy-related CO2 emission over 1991–2006 in China. Ecol Econ. 2009;68(7):2122–2128.
- Chen CC, Liu CL, Wang H, et al. Examining the impact factors of energy consumption related carbon footprints using the STIRPAT model and PLS model in Beijing. China Environ Sci. 2014; 34(6):1622–1632.
- Fang D, Zhang X, Yu Q, et al. A novel method for carbon dioxide emission forecasting based on improved Gaussian processes regression. J Cleaner Prod. 2018; 173:143–150.
- Pao HT, Fu HC, Tseng CL. Forecasting of CO2 emissions, energy consumption and economic growth in China using an improved grey model. Energy. 2012; 40(1):400–409.
- Niu D, Wang K, Wu J, et al. Can China achieve its 2030 carbon emissions commitment? Scenario analysis based on an improved general regression neural network. J Cleaner Prod. 2020; 243:118558.
- Dai S, Niu D, Han Y. Forecasting of energy-related CO2 emissions in China based on GM (1, 1) and least squares support vector machine optimized by modified shuffled frog leaping algorithm for sustainability. Sustainability. 2018; 10(4):958.
- Ding S, Dang YG, Li XM, et al. Forecasting Chinese CO2 emissions from fuel combustion using a novel grey multivariable model. J Cleaner Prod. 2017; 162:1527–1538.
- Yuan J, Xu Y, Hu Z, et al. Peak energy consumption and CO2 emissions in China. Energy Policy. 2014; 68:508–523.
- Li F, Xu Z, Ma H. Can China achieve its CO2 emissions peak by 2030? Ecol Indic. 2018;84:337–344.
- Sun W, Liu M. Prediction and analysis of the three major industries and residential consumption CO2 emissions based on least squares support vector machine in China. J Cleaner Prod. 2016; 122:144–153.
- Reijnders L, Huijbregts MAJ. Palm oil and the emission of carbon-based greenhouse gases. J Cleaner Prod. 2008; 16(4):477–482.
- Say NP, Yücel M. Energy consumption and CO2 emissions in Turkey: Empirical analysis and future projection based on an economic growth. Energy Policy. 2006; 34(18):3870–3876.
- Auffhammer M, Carson RT. Forecasting the path of China's CO2 emissions using province-level information. J Environ Econ Manage. 2008; 55(3):229–247.
- Wu L, Liu S, Liu D, et al. Modelling and forecasting CO2 emissions in the BRICS (Brazil, Russia, India, China, and South Africa) countries using a novel multi-variable grey model. Energy. 2015;79:489–495.
- Pao HT, Tsai CM. Modeling and forecasting the CO2 emissions, energy consumption, and economic growth in Brazil. Energy. 2011; 36(5):2450–2458.
- Lin CS, Liou FM, Huang CP. Grey forecasting model for CO2 emissions: A Taiwan study. Appl Energy. 2011; 88(11):3816–3820.
- Wang X, Wei Y, Shao Q. Decomposing the decoupling of CO2 emissions and economic growth in China’s iron and steel industry. Resour Conserv Recycl. 2020; 152:104509.
- Sun W, Wang C, Zhang C. Factor analysis and forecasting of CO2 emissions in Hebei, using extreme learning machine based on particle swarm optimization. J Cleaner Prod. 2017; 162:1095–1101.
- Kavoosi H, Saidi MH, Kavoosi M, et al. Forecast global carbon dioxide emission by use of genetic algorithm (GA). Int J Computer Sci Issues (IJCSI). 2012; 9(5):418.
- Chang H, Sun W, Gu X. Forecasting energy CO2 emissions using a quantum harmony search algorithm-based DMSFE combination model. Energies. 2013; 6(3):1456–1477.
- Zhao J, Deng F, Cai Y, et al. Long short-term memory - Fully connected (LSTM-FC) neural network for PM2.5 concentration prediction. Chemosphere. 2019; 220:486–492. doi:10.1016/j.chemosphere.2018.12.128.
- Yang B, Sun S, Li J, et al. Traffic flow prediction using LSTM with feature enhancement. Neurocomputing. 2019; 332:320–327.
- Nair R, Jhingan S, Jain D. Testing the consistency between cosmological measurements of distance and age. Phys Lett B. 2015; 745:64–68.
- Baraldi P, Mangili F, Zio E. A prognostics approach to nuclear component degradation modeling based on Gaussian process regression. Prog Nucl Energy. 2015; 78:141–154.
- Haseeb M, Hassan S, Azam M. Rural–urban transformation, energy consumption, economic growth, and CO2 emissions using STRIPAT model for BRICS countries. Environ Prog Sustainable Energy. 2017; 36(2):523–531.
- Fan Y, Liu LC, Wu G, et al. Analyzing impact factors of CO2 emissions using the STIRPAT model. Environ Impact Assess Rev. 2006; 26(4):377–395.
- Shahbaz M, Chaudhary AR, Ozturk I. Does urbanization cause increasing energy demand in Pakistan? Empirical evidence from STIRPAT model. Energy. 2017; 122:83–93.
- Shahbaz M, Loganathan N, Muzaffar AT, et al. How urbanization affects CO2 emissions in Malaysia? The application of STIRPAT model. Renewable Sustainable Energy Rev. 2016; 57:83–93.
- Mi Z, Wei YM, Wang B, et al. Socioeconomic impact assessment of China's CO2 emissions peak prior to 2030. J Cleaner Prod. 2017; 142:2227–2236.
- Wang ZX, Ye DJ. Forecasting Chinese carbon emissions from fossil energy consumption using non-linear grey multivariable models. J Cleaner Prod. 2017; 142:600–612.
- Su B, Ang BW, Li Y. Input-output and structural decomposition analysis of Singapore's carbon emissions. Energy Policy. 2017; 105:484–492.
- Cansino JM, Román R, Ordóñez M. Main drivers of changes in CO2 emissions in the Spanish economy: A structural decomposition analysis. Energy Policy. 2016; 89:150–159.
- Yang L, Yang Y, Zhang X, et al. Whether China's industrial sectors make efforts to reduce CO2 emissions from production?-A decomposed decoupling analysis. Energy. 2018; 160:796–809.
- Ito K. CO2 emissions, renewable and non-renewable energy consumption, and economic growth: Evidence from panel data for developing countries. Int Econ. 2017; 151:1–6.
- Shen L, Wu Y, Lou Y, et al. What drives the carbon emission in the Chinese cities?—A case of pilot low carbon city of Beijing. J Cleaner Prod. 2018;174:343–354.
- Shuai C, Chen X, Shen L, et al. The turning points of carbon Kuznets curve: evidences from panel and time-series data of 164 countries. J Cleaner Prod. 2017; 162:1031–1047.
- Behera SR, Dash DP. The effect of urbanization, energy consumption, and foreign direct investment on the carbon dioxide emission in the SSEA (South and Southeast Asian) region. Renewable Sustainable Energy Rev. 2017; 70:96–106.
- Li B, Liu X, Li Z. Using the STIRPAT model to explore the factors driving regional CO 2 emissions: a case of Tianjin, China. Nat Hazards. 2015; 76(3):1667–1685.
- Yang T, Pan Y, Yang Y, et al. CO2 emissions in China's building sector through 2050: a scenario analysis based on a bottom-up model. Energy. 2017;128:208–223.
- Zhang Q, Yang J, Sun Z, et al. Analyzing the impact factors of energy-related CO2 emissions in China: what can spatial panel regressions tell us? J Cleaner Prod. 2017; 161:1085–1093.
- Wang Z, Yin F, Zhang Y, et al. An empirical research on the influencing factors of regional CO2 emissions: evidence from Beijing city, China. Appl Energy. 2012; 100:277–284.
- Li H, Mu H, Zhang M, et al. Analysis on influence factors of China's CO2 emissions based on Path–STIRPAT model. Energy Policy. 2011;39(11):6906–6911.
- Hochreiter S, Schmidhuber J. Long short-term memory. Neural Comput. 1997; 9(8):1735–1780. doi:10.1162/neco.1997.9.8.1735.
- Graves A, Mohamed A, Hinton G. Speech recognition with deep recurrent neural networks. 2013 IEEE International Conference on Acoustics, Speech and Signal Processing; IEEE; 2013. p. 6645–6649.
- Ehrlich PR, Holdren JP. Impact of population growth. Science. 1971; 171(3977):1212–1217. doi:10.1126/science.171.3977.1212.
- York R, Rosa EA, Dietz T. STIRPAT, IPAT and ImPACT: analytic tools for unpacking the driving forces of environmental impacts. Ecol Econ. 2003;46(3):351–365.
- Huang Y, Shen L, Liu H. Grey relational analysis, principal component analysis and forecasting of carbon emissions based on long short-term memory in China. J Cleaner Prod. 2019; 209:415–423.
- Liu Z, Guan D, Crawford-Brown D, et al. Energy policy: A low-carbon road map for China. Nature. 2013; 500(7461):143–145. doi:10.1038/500143a.
- Maddala GS, Wu S. A comparative study of unit root tests with panel data and a new simple test. Oxford Bull Econ Stat. 1999; 61(S1):631–652.
- Choi I. Unit root tests for panel data. J Int Money Finance. 2001; 20(2):249–272.
- Shen H, Tao S, Chen Y, et al. Urbanization-induced population migration has reduced ambient PM2.5 concentrations in China. Sci Adv. 2017; 3(7):e1700300. doi:10.1126/sciadv.1700300.