
 ?Mathematical formulae have been encoded as MathML and are displayed in this HTML version using MathJax in order to improve their display. Uncheck the box to turn MathJax off. This feature requires Javascript. Click on a formula to zoom.
Abstract
The imported iron ore transport chain is a complex system concerning different transport modes, means, and routes within water areas and various regions on the land. However, the relevant literature has only tackled the carbon mitigation of a single transport mode in a specific region. Under China’s road-to-rail policy, this article investigates the total transport cost, carbon and nitrogen emissions of the imported iron ore transport chain between Brazil and the steel enterprises in the Bohai Economic Rim (BER), and established a model to select the optimal transport plan. Inspired by the policies calling for capacity structure reform of steel industry and energy structure adjustment of highway transport, the authors set up 12 scenarios and estimate the cost and emissions. The results demonstrate the positive economic and environmental impacts of the road-to-rail policy, the development of multimodal transport of railway and waterway (MTRW), and the capacity structure adjustment of the steel industry. However, the impacts of capacity structure adjustment might be marginalized. Besides, natural gas trucks are proved important to fulfilling the goal of clean highway transport. Finally, the discussion on the recent policy of liquidation mechanism reform reveals that the unit railway transport cost should be reduced moderately. Otherwise, the reduction cannot save total transport cost, but cause greater carbon and nitrogen emissions.
Introduction
With the rapid development of international trade, the emissions generated from transportation have intensified the deterioration of global climate, attracting much attention from the academia. In fact, the transport sector is the leading contributor of greenhouse gas (GHG) emissions [Citation1]. Almost all GHGs emitted from transport sources come from fossil fuel combustion, including carbon dioxide, methane, and nitric oxide. Among them, nitric oxide has a warming effect about 298 times that of carbon dioxide, contributing to around 7% of global warming [Citation2]. The nitrogen emissions also damage the ozone layer, and cause hazards like greenhouse effect and acid rain.
Steel industry is the backbone of Chinese economy. However, the production of each ton of steel generates huge amounts of GHGs. While China is the largest steel producer, its steel industry has fallen into a severe crisis with 1100 (21.4%) loss-making enterprises in 2018 [Citation3]. The crisis was sparked by unreasonable capacity structure and soaring production cost: low value-added steel products are oversupplied, while high value-added ones are in short supply, relying heavily on imported iron ore. Each year, China imports more iron ore than any other country, because the domestic iron ore reserves are large in quantity but features poor quality and high price. In 2018 alone, the iron ore imports of China reached 1.038 billion tons, 65.3% of the global iron ore trade volume [Citation4]. More than half of the imports went to Bohai Economic Rim (BER), which produces over 50% of crude steel in China.
Steel enterprises are dotted across the BER. Each destination port of the imported iron ore needs to serve multiple enterprises. It would be very inefficient and environmental unfriendly to transport imported iron ore to enterprises by trucks. By contrast, the railway transport outshines highway transport in energy efficiency and emissions reduction [Citation5]. On average, trains are four times more fuel efficient than trucks, i.e. railway transport emits 25% less GHGs than highway transport [Citation6]. However, highway remains the dominant transport mode in China, carrying up to 78% of the total domestic freight, despite a 9.1% rise in rail freight volume in 2018 [Citation7].
Concerned about the resource-efficiency of freight transport, the Chinese government has already rolled out policies on the reform of freight transport structure. On July 2, 2018, the State Council issued the Three-Year Action Plan to Win the Defence of Blue Sky, in a bid to improve air quality. The Action Plan calls for increasing the freight volume of railway by 30% from 2017 to 2020, building up multimodal freight hubs, and transporting bulk cargo from major coastal ports by railway or waterway. Through the reform, the government expected to lower the carbon and nitrogen emissions and particulate matters (PM) by 100 million tons, 1.1 million tons and 55,000 tons, respectively. Against this backdrop, the road-to-rail policy is of great significance to the transform of the freight transport structure. It is very meaningful to explore the practical effects, economic benefits and environmental benefits of such a policy.
The aim of putting forward the road-to-rail policy is to shift the iron ore transport from highway to railway. However, considering the necessity to invest in nationwide railway infrastructure, it may take years to finally complete the shift. In the short term, highway transport will remain the dominant transport mode for imported iron ore. To mitigate carbon emissions in the entire transport chain, the carbon efficiency (i.e. the energy structure) in highway transport of imported iron ore must be improved. Natural gas trucks, the cleaner means in highway transport, are also under consideration by the Chinese government. But it takes more time to achieve the transition from diesel trucks to natural gas trucks.
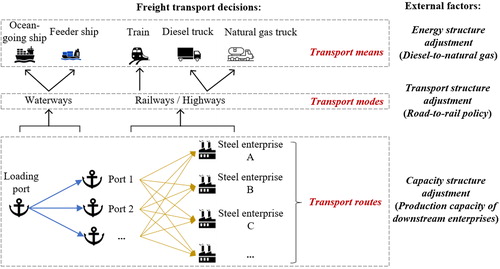
Besides the regulations mentioned above that are imposed by the government, freight transport decisions are affected by many factors and stakeholders involved in the transport chain. Murphy and Poist [Citation8] suggested that freight transport decisions no longer reside with one party, but with multiple points along the supply chain, namely, marketers, producers, shippers, consignees, buyers and intermediaries. As mentioned by Bontekoning et al. [Citation9], the choice between transport modes is a complex decision-making process. To make a rational choice, the decision-maker must fully understand all the factors affecting the transport chain. These factors also determine the economic and environmental efficiencies of the entire transport chain. In this article, a freight transport decision within a transport chain refers to the selection among various combinations of transport modes, transport means, and transport routes. In addition, the downstream demand of the transport chain, i.e. the production capacity of steel enterprises, must be satisfied. Therefore, the capacity structure adjustment is also considered as an important factor of the transport decisions. illustrates the relationships among the freight transport decisions and factors.
Figure 1. Freight transport decisions and external factors of the iron ore transport chain.
The recent studies on reducing transport-related emissions mainly tackle the mitigation of carbon emissions in a single transport mode. For example, Qi and Song [Citation10] and Chen et al. [Citation11] investigated carbon emissions reduction of a sea journey. To reduce carbon emissions, Sanchez Rodrigues et al. [Citation12, Citation13] reorganized the transport chain based on the selection of transport nodes. However, there is no report that puts the entire transport chain into perspective, and tries to control the related factors such as the capacity structure and the energy structure of highway transport. As shown in , what really matters is the reduction of the GHG emissions from the entire transport chain, which is a complex system involving various decisions and external factors.
This article mainly focuses on the transport chain of imported iron ore from Brazil (the major source of imported iron ore) to large steel enterprises in the BER (the gathering place of steel cities in China). Our aim is to find an efficient solution to reducing GHG emissions of the transport chain. Therefore, by considering the policies proposed by the Chinese government, several strategies are tested to mitigate carbon and nitrogen emissions in the transport of imported iron ore, namely, adjusting the freight transport structure, switching to alternative transport modes and routes, as well as optimizing the capacity structure (of the steel industry) and the energy structure (of highway transport).
The contributions mainly manifest in the following aspects:
This article reveals how carbon and nitrogen emissions are affected by factors such as freight transport structure, capacity structure and energy structure of the imported iron ore transport chain. The study enriches the literature by investigating GHG reduction ways from the perspective of an entire transport chain.
For the governments, the article is especially valuable because it comprehensively examines the policies related to the imported iron ore transport chain. The results demonstrate the economic and environmental benefits of the road-to-rail policy, the development of multimodal transport of railway and waterway, and the capacity structure adjustment. However, the positive impacts of capacity structure adjustment might be marginalized. Besides, the liquidation mechanism reform should be implemented moderately to achieve positive impacts.
For the practitioners involved in the imported iron ore transport chain, the article develops a mathematical model to help them easily obtain the optimal freight transport decisions (e.g. transport modes, means, and routes), and estimate the economic and environmental impacts of 12 current and potential scenarios.
The remainder of this article is organized as follows: “Literature review” section reviews the relevant literature on iron ore transport chain; “Materials and methods” section presents the dataset on the transport chain of imported iron ore in the BER, specifies the key aspects of adjusting the freight transport structure and designed the transport optimization model; “Experiments and results” section sets the simulation scenarios and provides the results of scenario analysis; “Discussion and conclusions” section puts forward research conclusions through discussion.
Literature review
Adjustment of freight transport structure as a promoter of emissions reduction in the transport chain
Transport is widely recognized as a major cause of GHG emissions [Citation14–16]. To reduce the negative impact of transport without sacrificing economic growth, the European Commission drew up a roadmap to resource-efficient transport systems, planning to slash carbon emissions by at least 60% before 2050. When it comes to freight transport, the European Commission proposed a solution to improve the freight transport structure. For this purpose, numerous well-financed initiatives need to be implemented at local, regional, national or trans-national levels over several decades. These initiatives attempt to reduce the freight volumes of carbon-intensive transport modes, especially highway, and substitute them with carbon-efficient transport modes (e.g. inland waterway, coastal shipping or railway). Under the complex effects of varied factors, it is no easy task to adjust the freight transport structure. Traditionally, the choice between transport modes is mostly explored by comparing potential influencing factors related to services, consignors, traffic, etc. [Citation17]; the commercial transport modes are often selected from highway, railway and inland waterway [Citation18, Citation19]. However, the traditional research only discusses the selection between single transport modes, failing to consider multimodal transport. Besides, no attempt has been made to weight the influencing factors according to different commercial scenario or their effects on carbon footprints of a particular solution.
Multimodal transport is the combined use of different transport modes, e.g. highway, railway and waterway, to deliver cargoes from the origin to the destination, eliminating the need for any change to the cargoes. The European Union (EU) pioneers the upgrading to multimodal transport, and other countries and regions are following suit, including many developed countries in other continents. The fever of multimodal transport is stirred up by the unique advantage of this transport mode: multimodal freight transport can effectively control carbon emissions, without affecting economic growth. This is because trains and barges, the two classic modes of multimodal transport, are less carbon intensive than heavy trucks. Woodburn et al. [Citation20] laid down four types of measures to incentivize the shift in freight transport structure in the UK and the rest of the EU: fiscal measures, regulatory measures, supply-based organizational measures and demand-based organizational measures. Jonkeren et al. [Citation21] theoretically demonstrated that, if conditions permit, highway should be adopted for inland freight transport over short distance, railway for that over medium distance and the cheapest inland waterway for that over long distance. Liao et al. [Citation22] and Chen et al. [Citation11] manifested that coastal shipping service provides a low-carbon alternative to highway freight transport.
In addition, many scholars have probed into the modes, routes and means in global transport chains, and agreed that the optimal transport solution must be multimodal and complex, due to the long cycle and distance of global transport chains [Citation21, Citation23–25]. In the global transport chain of iron ore, ports act as important nodes in the chain, exerting a major influence on the chain’s performance. Therefore, the port selection must be done carefully from the perspective of multimodal transport [Citation26, Citation27]. Most of the relevant studies concentrate on the economic aspects of port selection, namely, market force and port efficiency [Citation27–32]. Some scholars have integrated the carbon footprint algorithm into the research of global transport chain. For instance, Liao et al. [Citation33] explored the carbon control role of emerging ports in the transport of international containers to the inland. Taking port selection as the key to enhancing carbon efficiency, Sanchez Rodrigues et al. [Citation12, Citation13] studied the correlations of cost and carbon efficiency with the structure of international container transport chain.
Iron ore occupies much of the transport capacity of the global freight transport chain. The transport of iron ore covers three sections: maritime transport, inland waterway transport and land transport. In fact, the global transport chain of iron ore has long been a research hotspot. Since most freight transport chains are economic-driven, the existing criteria of that transport chain mainly minimize the economic impact, rather than the carbon emissions, of land transport. Beresford et al. [Citation23] optimized the route of iron ore transport from north-western Australia to north-eastern China, and determined the most competitive route for multimodal transport: unloading at Bayuquan Port, followed by railway transport to Ansteel Group. In recent years, the growing global awareness of carbon mitigation has pressurized stakeholders to revamp transport modes with excessively high carbon emissions. The existing research has shown that carbon efficiency is a key consideration in optimizing the global transport chain of iron ore. Pursuing low-carbon transport, Yang [Citation34] developed an optimization model for carbon emissions in land transport of iron ore. Nowadays, transport plans for iron ore are increasingly specific. The port selection and total cost cannot be optimized without clarifying the origins and destinations. For any carbon mitigation solution, its environmental and economic impacts in each section of the multimodal transport chain should be assessed well, in the light of the selection of transport modes, routes and means.
Reform of capacity and energy structures in the transport chain
The supply-side reform in China essentially pursues the quality and efficiency of the supply system [Citation35]. Much research has been done on how to improve the carbon efficiency in supply chains and logistics network. Many have explored the GHG mitigation on the demand side (the steel industry) of iron ore transport chain. Some scholars assessed carbon emissions based on the capacity of steel enterprises [Citation36, Citation37], some analyzed green supply chains from strategic, tactical, and operational perspectives [Citation38] and some made gradual and fundamental changes to the capacity structure to improve carbon efficiency [Citation39]. However, the least polluting transport mode is seldom adopted in practice, because freight companies regard cost affordability as the top priority. Thus, the shift in freight transport structure must be incentivized by government subsidy [Citation40]. Thanks to recent de-capacity polices on steel industry, the reform of capacity structure, a part of supply-side reform, may change the choices of freight companies.
Concerning the land transport of iron ore, the destination depends heavily on the geographical concentration of steel enterprises. The steel industry of China mainly concentrates in five provinces. Among them, Hebei accounts for one fourth of domestic steel production [Citation41]. Many studies have predicted the growth of China’s steel enterprises over the next decade. Although hard to verify, the predicts shed some light on the distribution of the transport volumes of iron ore in future. Early in the design of the multimodal transport chain, the possible routes for freight transport between origins and destinations have been determined. Therefore, the locations of steel enterprises, i.e. the destinations of iron ore transport, are critical to carbon mitigation in global transport chain, under the reform of the capacity structure. In the steel industry, the reform of capacity structure requires merger and reorganization, changing the destinations of iron ore transport. This issue has not been addressed in the previous research. To make up for the gap, the author considered this issue while assessing whether capacity structure reform helps to reduce GHG emissions in iron ore transport chain.
The carbon reduction of land freight transport is a common concern among researchers engaging in supply chain and logistics network. For instance, McKinnon [Citation17] created an analytical framework to guide the carbon reduction in highway transport, involving parameters like energy efficiency, and emissions per unit of energy use. Based on these parameters, Tacken et al. [Citation42] identified the focal areas of highway freight transport to reduce emissions. From the perspective of energy structure, this article treats alternative fuels as an effective way to suppress carbon emissions in highway transport, drawing on the research of Tacken et al. [Citation42]. Relying on hydrogen, online vehicle monitoring, and computer maps, Perham [Citation43] significantly slashed the carbon footprint of internal combustion engine trucks, and proposed several measures to control fuel emissions: reducing fuel consumption through driver training, optimizing truck performance by advanced driver-assistance systems (ADAS), and adding hydrogen to enhance driving efficiency. Without changing the passenger capacity and weight of the trains, Din et al. [Citation44] replaced diesel-powered trains with hydrogen-powered and hydrogen hybrid in Moore Street, Birmingham, UK, and found that the replacement reduced energy consumption by 44% (hydrogen-powered trains) and 60% (hydrogen hybrid trains), and cut down carbon emissions by 59% (hydrogen-powered trains) and 77% (hydrogen hybrid trains). The results fully demonstrate the potential of hydrogen fuel cell system to serve as the main propulsion system of rolling stocks. Tacken et al. [Citation42] discovered that alternative fuels like biofuels are not as carbon-efficient as expected, because the carbon reduction in highway transport is negatively correlated with the radicalness of the shift to green transport modes.
Through the above analysis, this article takes the natural gas as the alternative fuel for highway transport before the full implementation of the road-to-rail policy, and include this parameter in the modeling of carbon mitigation in highway transport. Moreover, the iron ore transport chain is designed, both carbon and nitrogen emissions are considered in the iron ore transport chain.
Materials and methods
Capacity structure: steelmaking capacity and demand for imported iron ore
To disclose the impacts of capacity structure reform on GHG emissions, a total of 49 steel enterprises from 8 provincial level administrative regions (provinces) in China are selected from the BER as the destinations of imported iron ore. Every enterprise boasts the capacity to product over 2 million tons of crude steel each year. The eight provinces are Liaoning, Heilongjiang, Jilin, Tianjin, Hebei, Shanxi, Shandong and Inner Mongolia. lists the annual volume of iron ore imported to each province in 2017; in the supplemental material provides the crude steel output and the demand of imported iron ore of each steel enterprise. The data in and ACitation1 are collected from My Steel Network [Citation45].
Table 1. The annual volume of iron ore imported to each BER province in 2017.
The State Council of China has reiterated the urgency to curb the growing steelmaking capacity and resolve excess capacity [Citation46]. This reflects the huge demand for iron ore among steel enterprises in China. Therefore, it is assumed that the large steel enterprises in each BER province can consume all the iron ore imported to that province.
According to the regulations on capacity structure reform, 28 steel enterprises in the BER with an annual crude steel output of 2–5 million tons will be shut down, and their demand for imported iron ore will be imputed to the remained 21 large steel enterprises in that region with an annual crude steel output of over 5 million tons. In this way, the total demand of imported iron ore in the BER will remain unchanged. Specifically, for each province in BER, after shutting down the smaller steel enterprises, we calculate the capacity ratio of the remained large enterprises. Then allocate the capacities that are shut down into the large enterprises according to their ratio.
However, we noticed that there are no large enterprises with capacity more than 5 million tons in some provinces such as Heilongjiang and Jilin. Therefore, here the demand for imported iron ore in Heilongjiang and Jilin was shifted to large steel enterprises in Liaoning. In practice, the mergers and acquisitions of steel enterprises, as well as the capacity transfer, may take place across provinces. For example, in July 2017, Laiyuan County Aoyu Steel Co., Ltd. transferred 1.08 million tons of iron and 1.12 million tons of steel to Fujian Qingtuo Group Co., Ltd. forecasts the iron ore demand of large steel enterprises in the BER in future. The forecast data are recalibrated by the statistics on crude steel output and imported iron ore from My Steel Network [Citation45].
Table 2. The demand of imported iron ore of steel enterprises in the BER after capacity structure reform (10,000 tons).
Transport factors: unit transport cost
The imported iron ore can be transported by various combinations of transport modes, routes and carriers. The transport process mainly includes two parts: maritime transport and land transport. Compared with previous studies, this article makes detailed classification of transport operations. In the BER, imported iron ore is mainly unloaded at the following ports: Dalian Port, Yingkou Port, Dandong Port, Tianjin Port, Caofeidian Port, Qingdao Port, Yantai Port, and Rizhao Port.
Since 2011, the iron ore imported from Brazil has been transported by super large iron ore ships with dead-weight tonnages (DWT) of 400,000. Currently, China has seven iron ore terminals capable of serving such large bulk carriers. Three of them are located within the BER, namely, Dalian Port, Caofeidian Port and Qingdao Port. Hence, these three ports are classified as Level I unloading ports. The remaining five ports in the BER are considered Level II unloading ports.
specifies the throughput and the transport modes of imported iron ore at each port in the BER [Citation47]. Different combinations of ports are used to analyze the economic and environmental impacts of lightening the ships and transhipping to other ports in the part of maritime transport.
Table 3. The throughput and the transport modes of imported iron ore at each port in the BER (10,000 tons).
During maritime transport, the iron ore moves from Tubarão Port, Brazil to the ports in the BER, China. The time for a single voyage Th can be calculated by:
(1)
(1)
where, Ts is the sailing time; Tp is the port handling time. Since the iron ore is transported in a one-way trip, the sailing time is consumed in the laden voyage and the ballast voyage. Let L be the sailing distance, V be the laden speed and V + 0.5 be the ballast speed. Meanwhile, the port handling time covers handling time and berthing time Tw. Let Q be the cargo load, and M1 and M2 be the mean handling rates.
The total transport cost of iron ore in maritime transport is affected by multiple factors, such as the voyage cost Ch (including fuel cost, lubricant charge, material fee and port fee), annual operating cost Cj, and annual depreciation Cz. In a single voyage within the time Th, the fuel cost Cr of the sailing ship can be computed by:
(2)
(2)
where Ka, Kb, and Kp are the daily fuel consumptions in laden voyage, ballast voyage and port time, respectively; Pf is the fuel price extracted from Bunkerworld [Citation48]. In general, moistening material cost Cl and material cost Cs are 8% and 10% of the fuel cost Cr, respectively. The port fee Cp can be obtained by the port charge method issued by the Ministry of Transport of China [Citation49]. Hence, the cost of the voyage can be described as:
(3)
(3)
Related to the annual ship operations, the fixed cost Cj consists of the crew cost Ci, ship maintenance fee Cw, ship insurance fee Cb and management fee Cg. Among them, the crew cost is extracted from crewcn [Citation50], ship maintenance fee and ship insurance fee are generally 1.5% and 0.7% of ship price P, equivalent to the new shipbuilding price issued by Clarksons [Citation51], while management fee Cg can be calculated as 20% of the sum of Ci, Cw, and Cb. Therefore, the annual operating cost Cj of the ship can be obtained as:
(4)
(4)
The annual depreciation cost Cz of the ship can be described as:
(5)
(5)
The straight-line depreciation method is adopted to calculate the service life of a ship up to 20 years and the residual value of 5%. Suppose any type of ship operates 340 days in each year. Then, the total transport cost Ct of iron ore in maritime transport can be illustrated as:
(6)
(6)
Then, the unit transport cost c can be obtained as:
(7)
(7)
The main parameters in the above formulas are set as follows: the sailing distance L () between the ports in the transport routes is acquired from BLM-Shipping. The typical DWT ranges from 100,000 to 400,000 tons and the service speeds are between 12 and 16 knots [Citation52]. Hence, the laden speed V is set to 12.5 knots, and the ballast speed to 13 knots. The cargo load Q of a single voyage is 95% of the ship's deadweight. For Level I unloading ports, the mean loading rate of M1 is 90,000 tons/day, the mean unloading rate M2 is 50,000 tons/day, the port handling time Tw is 4 days. The M1, M2, and Tw of Level II unloading ports are set to 60,000 tons/day, 28,000 tons/day and 7 days, respectively. For each type of ship with dead-weight in 100,000–400,000 tons, the daily fuel consumptions in laden voyage Ka, ballast voyage Kb, and port time Kp () are obtained from the data of the International Maritime Organization [Citation53].
Table 4. Distances between ports (nautical miles).
Table 5. Daily fuel consumption of each type of ship (RMB/ton).
Two transport modes are available for maritime transport, namely, direct transport and transhipment. Direct transport means the cargoes are shipped directly from a loading port to an unloading port without any transhipment. lists the unit transport cost of each type of ship to directly transport the iron ore from Tubarão Port to the ports in the BER. However, if cargoes are carried by a full-loaded 400,000 DWT ship, they are unable to arrive the Level II unloading ports by direct transport. Thus, transhipment, the other maritime transport mode, is very important for such a large ship. Transhipment transport can be further split into two sub-modes: lightening and transhipment (LT), or all by transhipment. explains the two maritime transport sub-modes in detail. However, as is known that the cost efficiency of larger ships is better than smaller one, thus “all by transhipment” inferior to the LT. Therefore, this article only considers the LT and direct transport as two alternative mode for maritime transport, while neglecting “all by transhipment”.
Figure 2. Illustration of the two maritime transport sub-modes.
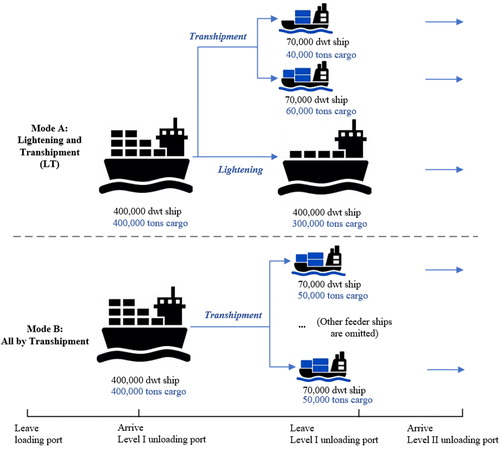
Table 6. Unit transport cost of direct transport from Tubarão Ports to the ports in the BER (RMB/ton).
Under the LT, the 400,000 DWT super large ore ships docks at a Level I unloading port in the BER, is lightened to 300,000 DWT (the most economical way is to lighten to the maximum tonnage of the destination port), and then continues to sail to the destination port. The iron ore unloaded in lightening will be transported to the destination port by 70,000t bulk carriers (the most economical type of transit ships). Thus, the unit transport cost of the LT = (unit transport cost of ships with 40,000 DWT 30 + unit transport cost of ships with 70,000 DWT 10 + lightening charge)/40. The unit transport costs of the LT between different unloading ports are shown in .
Table 7. Unit transport cost between unloading ports under the LT (RMB/ton).
Once fully unloaded at the destination port, the imported iron ore can be transported on land to the steel enterprises via highway or railway. The unit transport cost of the land transport is computed by the standard method in ton kilometer, which is formulated by China Logistics Trading Centre [Citation54] and China Railway [Citation55]. The computation considers the mean load factors of each transport mode. These factors are widely used in the literature, because they reflect the common features of freight transport in China.
Energy structure: unit carbon emissions and unit nitrogen emissions
The overall pattern of iron ore transport hinges on two elements: the choice between direct transport and the LT among coastal ports, and that between transport means of port logistics within the coastal ports. Port operations are extremely complex, as well as highly variable with timing (whether the iron ore is transported out of the terminal immediately) and other factors: whether the operating procedure needs changes (e.g. whether to hold the iron ore temporarily in a stack), and whether the containers move out of the terminal by railway or highway.
The port operations have a significant impact on the environmental footprint of iron ore transport, which is often ignored in practice. Nieuwenhuis et al. [Citation24] suggested that the emissions from port operations account for around 2% of the total emissions from the transport chain. Walnum [Citation56] argued that the carbon emissions in the lifecycle of a transoceanic tanker come from ship operation (83%), port operation (15%), ship production (2%), ship maintenance (0.01%), and port construction (0.01%). In this article, the carbon footprint of iron ore transport is dominated by the choice and optimization of transport modes, routes and means. The emissions from these activities are converted based on standard emissions factors, which are generally considered as precise and representative.
shows the carbon and nitrogen emission factors of different transport means under each transport mode [Citation57]. The carbon and nitrogen tax rates are set to RMB 0.305 per kg and RMB 12.632 per kg, respectively.
Table 8. Carbon and nitrogen emission factors of different transport means.
The relevant studies have only considered one type of fuel in road transport: diesel (standard biodiesel blend). This is virtually the only fuel for long-haul transport of trucks with gross vehicle weight (GVW) of 28/35/40 tons [Citation58]. Electric trucks only take up a small proportion in truck fleet. These small rigid vehicles are mainly used in urban freight distribution. There are several attempts to modify electric trucks into a viable alternative to diesel trucks for long-haul transport. However, no evidence suggests the modification could be successful in the foreseeable future in China . In addition, highway transport will remain an important mode of land transport, because it takes a long time to complete the infrastructure (e.g. railways) required to implement the road-to-rail policy. Therefore, natural gas trucks are taken as a transitional solution to road-to-rail, and adopted to analyze the GHG reduction role of substituting heavy trucks in the land transport of imported iron ore transport chain.
Transport optimization model
Interested in the economic and environmental impacts of the imported iron ore transport chain, this section sets up a transport optimization model that fulfills the demand of steel enterprises, and minimizes the total cost and emissions of iron ore transport. The model divides the actual freight volume of imported iron ore into the maritime transport part and the land transport part. The freight volume of both parts may vary greatly from port to port, and change with transport modes, routes and means.
The model is later applied in several scenarios formulated to determine the demand of imported iron ore transported to the destinations. For simplicity, here we define the assumptions of the transport solutions in each scenario as follows:
The supply and demand of imported iron ore is balanced, that is, no loss occurs in transport and lightening;
The unit transport cost of any type of ship does not vary with fuel price fluctuations;
The local iron ore has no impact on the demand of the steel enterprises in the BER for imported iron ore;
The available transport modes and unloading ports are enough to handle all the imported iron ore;
The GHG emissions from the loading and unloading processes are too small as negligible.
The following symbols are defined for the transport optimization model: The loading ports in Brazil, i = 1, 2, …, I; Level I unloading ports in the BER, k = 1, 2, …, K; Level II unloading ports in the BER, l = 1, 2, …, L; The type of ship for direct transport from i to k, s = 1, 2, …, S; The type of ship for direct transport from i to l, s' =1, 2, …, S'; The type of ship lightened at k and then sails to l, m = 1, 2, …, M; The demand of each steel enterprise for imported iron ore, j = 1, 2, …, J; The land transport means from k and l to steel enterprises, w = 1, 2, …, W; The tax rate for carbon emissions, θC (RMB/kg); The tax rate for nitrogen emissions, θN (RMB/kg); The supply of imported iron ore at i, ai; The demand of imported iron ore for each j, bj; The capacity limit of w, yw. Obviously, always holds.
For the transport of imported iron ore from i to k by s, the unit transport cost (RMB/ton), transport distance (km), freight volume (ton), carbon emissions factor per unit freight volume (kg/t·km), and nitrogen emissions factor per unit freight volume (kg/t·km) are
and
respectively.
For the transport of imported iron ore from i to l by s', the unit transport cost (RMB/ton), transport distance (km), freight volume (ton), carbon emissions factor per unit freight volume (kg/t·km), and nitrogen emissions factor per unit freight volume (kg/t·km) are
and
respectively.
For the transhipping of imported iron ore from k to l by m, the unit transport cost (RMB/ton), transport distance (km), freight volume (ton), carbon emissions factor per unit freight volume (kg/t·km), and nitrogen emissions factor per unit freight volume (kg/t·km) are
and
respectively.
For the transport of imported iron ore from k to j via w, the unit transport cost (RMB/ton), transport distance (km), freight volume (ton), carbon emissions factor per unit freight volume (kg/t·km), and nitrogen emissions factor per unit freight volume (kg/t·km) are
and
respectively.
For the transport of imported iron ore from l to j via w, the unit transport cost (RMB/ton), transport distance (km), freight volume (ton), carbon emissions factor per unit freight volume (kg/t·km), and nitrogen emissions factor per unit freight volume (kg/t·km) are
and
respectively.
On this basis, our transport optimization model can be established as:
(8)
(8)
(9)
(9)
(10)
(10)
(11)
(11)
(12)
(12)
(13)
(13)
(14)
(14)
Objective function (8) aims to minimize the total transport cost and GHG emissions of imported iron ore transport channel under all the 12 scenarios, after adjusting the capacity structure. Constraints (9) ensure that the total freight volume directly transported from the loading ports to all Level I and Level II unloading ports equals the total supply of imported iron ore. Constraints (10) ensure that the total freight volume transported from all Level I and Level II unloading ports to each steel enterprise via different means of land transport equals the demand of that enterprise. Constraints (11)-(12) ensure the balance of total freight volume entering and leaving each unloading port. Constraints (13) limit the freight volume via different means of land transport. Constraints (14) ensure that all decision variables are nonnegative.
Experiments and results
Scenario design: current scenario and proposed scenarios
Drawing from Liao et al. [Citation33] and Sanchez Rodrigues et al. [Citation12], this article designs a series of new scenarios about the possible carbon and nitrogen mitigation strategies for the iron ore transport chain from Brazil to the BER, China, under the reform of freight transport structure, capacity structure and energy structure.
In scenario experiments, the objectives of our model, namely, minimizing the total transport cost and GHG emissions of imported iron ore transport channel, are discussed under the current scenario and the proposed scenarios. The eight ports in the BER are assumed to unload all the freight volume. Operationally, the response is often to concentrate flows along gauge-cleared routes [Citation20].
During the scenario design, six scenarios (Group A) are firstly considered, in which the steel industry has not adjusted their capacity structure. Different combinations of transport modes, means and routes are analyzed. On this basis, natural gas trucks are introduced to assess the future improvements in carbon and nitrogen efficiency of highway transport. The six scenarios in Group A are as follows.
In Scenario 1, all the imported iron ore are transported by diesel trucks from unloading ports to the steel enterprises. The highway capacity is assumed to be always sufficient for the freight volume. This scenario refers to the current situation where the land transport solely relies on highways.
In Scenario 2, the current freight transport structure is illustrated: 25% of the freight volume leaving unloading ports are transported by railway, and 75% are transported by diesel trucks. This scenario is designed considering the implementation of the road-to-rail policy.
In Scenario 3, the diesel trucks in Scenarios 2 are replaced with natural gas trucks, responding to the recent policies of the Ministry of Finance of China that subsidize clean energy trucks.
In Scenario 4, 75% of the freight volume leaving unloading ports are transported by railway, and 25% by natural gas trucks, under the road-to-rail policy. The scenario design considers the construction boom of regional railways in the BER. Many new railways are being planned and constructed in 2006–2020.
In Scenario 5, 100% of the freight volume leaving unloading ports are transported by railway. This scenario is possible if the goal of China Railway can be achieved. By 2020, the railways will be capable of transporting 650 million tons (85%) of iron ore from unloading ports, up by 400 million tons from the level in 2017 [Citation59].
In Scenario 6, the imported iron ore are transported from the port of import in the BER by the carbon-efficient mode called the multimodal transport of railway and waterway (MTRW). This transport mode includes railway and both maritime sub-modes, e.g. direct transport and the LT. It is assumed that the imported iron ore arriving at Dalian Port (Level I unloading port) will be transshipped to Yingkou Port (Level II unloading port) via the LT; those arriving at Caofeidian Port (Level I unloading port) will be transshipped to Tianjin Port (Level II unloading port) via the LT; those arriving at Qingdao Port (Level I unloading port) will be transshipped to Rizhao Port (Level II unloading port) via the LT. After that, the iron ore unloaded in each Level II unloading port will be transported by railway. This scenario is designed according to the Three-Year Action Plan to Win the Defence of Blue Sky, which envisages that bulk cargoes like iron ore unloaded in coastal ports (e.g. Caofeidian Port and Huanghua Port) will be mainly transported by railway or waterway in 2020 and encourages the development of multimodal transport.
The effects of road-to-rail policy can be revealed by comparing the results between Scenario 1 and Scenario 2, or Scenario 3 and 4. The effects of energy structure reform on highway transport are revealed by the design of Scenario 2 and Scenario 3, or Scenario 1 and Scenario 5. The results in Scenario 6 will verify the effects of MTRW.
Another six scenarios are further designed considering the situations after adjusting the capacity structure, and allocated to Group B. Through the structural adjustment, the imported iron ore from Tubarão Port are redistributed to the steel enterprises in the BER. Scenarios in Group A and Group B are exactly the same, except the consideration of capacity structure adjustment. Therefore, the design of Group B will help to assess the effects of the capacity structure adjustment.
Experimental results: sensitive analysis
As a linear programming problem, our transport optimization model (8)-(14) is solved by CPLEX, yielding the optimal solution for each scenario. presents the results under the current scenario and the proposed scenarios in Group A, i.e. the scenarios before adjusting the capacity structure. In , “International” refers to the maritime transport of imported iron ore from Tubarão Port to the ports of import in the BER (Level I unloading ports); “Domestic” refers to the transport of imported iron ore within China, including the waterway transport LT between the unloading ports in the BER, and the transport from unloading ports to steel enterprises.
Table 9. Scenario comparison before adjusting the capacity structure.
As shown in , Scenario 2 is the more realistic than any other scenario under the road-to-rail policy. Compared with Scenario 1, Scenario 2 lowers carbon emissions by 1.057 million tons (about 4.15%) and nitrogen emissions by 14,000 tons (about 6.39%). This scenario is also more economical than Scenario 1. In Scenario 2, 25% of the imported iron ore in domestic transport are transferred by railway, reducing the total transport cost by RMB 4.9 billion yuan (about 6.99%). The addition of railway transport offsets the potential growth in domestic transport cost, arising from the decrease of international transport. This means transporting 25% of imported iron ore unloaded in the port of import to steel enterprises by railway, rather than highway, brings significant benefits to economy and environment.
Scenario 3 incurs basically the same total transport cost as Scenario 2. Despite the adjustment of energy structure by replacing diesel trucks with natural gas trucks, the freight volume of highway transport remains the same, with few changes to the land transport routes. As a result, the truck replacement has an unobvious economic benefit. However, both carbon and nitrogen emissions are effectively mitigated in this scenario. Compared with Scenario 1, Scenario 3 reduces nitrogen emissions by 64,000 tons (about 29.22%), and lowers carbon emissions by 2.639 million tons (about 10.36%). Overall, Scenario 3 boasts the best nitrogen footprint, and realizes excellent control of carbon emissions. Therefore, it is environmentally friendly to improve the energy structure of highway transport, in addition to shifting from highway transport to other modes.
Scenario 5 enjoys the best economic effect among all scenarios. The net cost saving under this scenario is roughly RMB 6.83 billion yuan (about 9.75%), which is higher than RMB 4.92 billion yuan (about 7.02%) of Scenario 3 and RMB 5.67 billion yuan (about 8.09%) of Scenario 4 (Scenarios 3 and 4 rank the third and second in terms of the economy of transport cost, respectively). Hence, the road-to-rail policy can indeed reduce the unit transport cost of imported iron ore. Moreover, the railway transport of iron ore emits 8.69% fewer carbon and 15.5% fewer nitrogen than the highway transport by diesel trucks in Scenario 1. Nevertheless, Scenario 5 is outshined by Scenarios 3 and 4 in carbon and nitrogen mitigation. A possible reason is that the railway routes are often longer than highway routes, while carbon and nitrogen emissions are positively correlated with the mileage of the transport routes. Besides, diesel trains have a higher nitrogen emissions factor than natural gas trucks. Thus, the nitrogen footprint will increase with the railway transport volume.
Scenario 6 achieves the lowest carbon emissions among all scenarios, about 15.5% lower than those of Scenario 1. The nitrogen emissions of Scenario 6 rank the second best (23.3% lower than those of Scenario 1), only behind those of Scenario 3. In addition to the environmental benefit, Scenario 6 also slashes transport cost by 9.05% from the level of Scenario 1, ranking the second in the economy of transport cost. The cost saving is possibly due to the additional transport mileage for transshipping. However, the social benefits of carbon and nitrogen mitigation under Scenario 6 should be evaluated carefully, because this scenario needs the government to make a considerable investment in infrastructure. The infrastructure construction is fundamental to transhipping in maritime transport and road-to-rail transfer in land transport.
presents the results under the six scenarios in Group B, i.e. the scenarios after adjusting the capacity structure. It is worth noting that Scenarios 7–12 have similar trends with Scenarios 1–6 concerning the total transport cost and carbon and nitrogen emissions of international and domestic transports. As shown in , the total transport cost and carbon and nitrogen emissions in Group B decrease across the board from the levels in Group A, after the adjustment of capacity structure. With the optimization of freight transport structure and energy structure, the positive impacts on economy and environment from the capacity structure adjustment of steel enterprises will be further marginalized. Specifically, the benefits of capacity structure adjustment in Scenarios 8–12 are shrinking, in terms of total transport cost, carbon emissions and nitrogen emissions. This is because the capacity structure adjustment only aims to enhance the effectiveness of the steel industry, failing to affect the total domestic capacity or the demand for imported iron ore.
Table 10. Scenario comparison after adjusting the capacity structure.
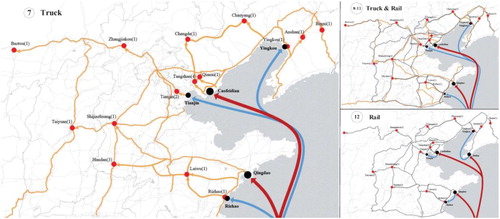
displays the international transport part of the optimal plan for transporting iron ore imported from Tubarão Port to the steel enterprises in the BER under all the scenarios. The details on railway, highway and waterway transports in the domestic transport part under Scenario 1–12 are provided in and .
Figure 3. International transport part of transport plans under all scenarios.
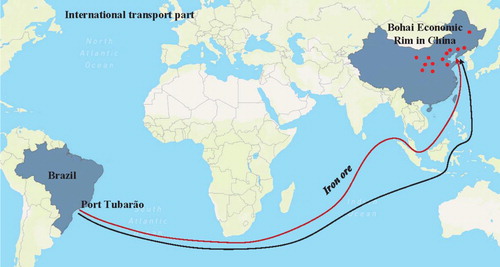
Figure 4. Domestic transport part of the transport plan under Scenario 1–6.
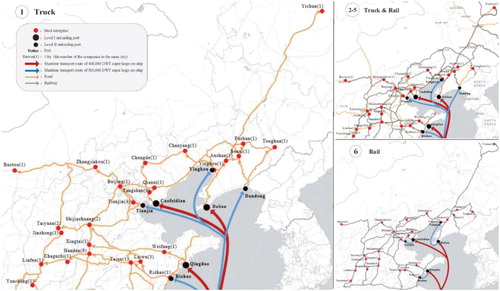
Figure 5. Domestic transport part of the transport plan under Scenario 7–12.
In the foreseeable future, the BER will takes up even a greater share of the imported iron ore in China. Thus, the total freight volume of imported iron ore in this region will continue to grow. Meanwhile, the railway transport will usher in a long-term growth, with the road-to-rail policy encouraging the shift toward railway transport of imported iron ore. However, China faces various problems with the development of railway transport: the users need to go through complex formalities before receiving transport service, the transport structure is not organized adaptively to the market demand, and the distribution of transport capacity is not clear. It is an urgent need to standardize the operations of railway transport. Since January 1st, 2018, China began to reform the liquidation measures of railway freight transport, seeking to promote the cost effectiveness and efficiency of railway transport. Therefore, the current scenario and the proposed scenarios are further examined under three goals for the reduction of unit transport cost by railway: 15%, 25%, and 35%. detail how unit transport cost reduction of railway affects the total transport cost, carbon emissions and nitrogen emissions.
Table 11. Impact of unit transport cost reduction of railway on total transport cost (RMB 100 million yuan).
Table 12. Impact of unit transport cost reduction of railway on carbon emissions (10,000 tons).
Table 13. Impact of unit transport cost reduction of railway on nitrogen emissions (10,000 tons).
As shown in , the reduction in unit transport cost of railway has no impact on the total transport cost in Scenarios 1 and 7, which only use diesel trucks. With the growing proportion of railway transport in land transport (Scenarios 4, 5, 10 and 11) or the implementation of the MTRW (Scenarios 6 and 12), the unit transport cost decreases by 25% and 35%, respectively, exhibiting obvious economic benefits. However, if the land transport still relies on highways (Scenarios 2, 3, 8 and 9), the railway transport volume cannot reach a considerable scale, and the reduction of unit transport price will not have a positive economic effect. Comparing the impacts of 15% and 25% reductions on scenarios in Groups A and B, it can be seen that a slight reduction of unit transport cost of railway (15%) is insufficient to have a major impact on the total transport cost, while further reduction (25%) can achieve a desirable impact. Comparing the impacts of 25% and 35% reductions on scenarios in Groups A and B, it is learned that the benefits of total transport cost will be weakened if the unit transport cost is further cut down (35%), i.e. the marginal effect of the cost reduction can last no longer.
and shows the variation in carbon and nitrogen emissions induced by the reduction in unit transport costs of railway under the twelve scenarios. Note that the economic cost of carbon and nitrogen mitigation is only a small fraction of the total transport cost. Therefore, a unit cost reduction measure that may benefit total transport cost does not necessarily promotes the environment. Here, the environmental impacts of the reduction in unit transport cost of railway are mainly evaluated based on the variation in carbon and nitrogen emissions. As shown in and , under Scenarios 2–5 and 8–11, the reduction of unit transport cost of railway pushes up the volume of imported iron ore transported over long distances by railway. Thus, the carbon footprint is reduced due to the small carbon emissions factor of railway. However, when the natural gas trucks and railway, respectively, transport 75% and 25% of the freight volume in land transport (Scenarios 4 and 10), the nitrogen footprint will increase as unit cost reduction in railway transport brings more long-distance freight to railways. After all, the natural gas trucks have a much smaller nitrogen emissions factor than trains.
It is also obvious that both carbon and nitrogen emissions increase under Scenarios 6 and 12, which adopt the MTRW. While the freight volume ratio of railway to waterway is not a constant, the freight volume will partly shift from waterway to railway, with the continuous decline in unit transport cost of railway. Then, the carbon and nitrogen emissions will both increase, for ships are greener than trains in carbon and nitrogen footprints. Taking the domestic transport of imported iron ore to Ansteel for instance, Dalian Port has a 400,000 tons DWT ore wharf, larger than that of Yingkou Port. Nonetheless, the railway route between Dalian Port and the Ansteel is 173 kilometers longer than that between Yingkou Port and Ansteel. Before the reduction of unit transport cost of railway, the waterway transport is more economic than railway transport, and the optimal transport plan for imported iron ore is obviously lightening the ships at Dalian Port and then unloading the iron ore at Yingkou Port (transport mode of the LT). With the continued decrease in the unit transport cost of railway, the cost advantage of waterway transport will be marginalized. Then, the imported iron ore should be directly transported to Dalian Port, and then delivered to Ansteel by railway. The additional freight volume of railway will negatively affect the environment. Similarly, the imported iron ore arriving at Caofeidian Port will be unloaded and directly delivered to the steel enterprises, and the LT transportation from Caofeidian Port to Tianjin Port will not be considered.
Discussion and conclusions
The Chinese government has highlighted the necessity to build a powerful transport network, and attached great importance to adjusting the freight transport structure [Citation27]. Recently, China has rolled out the road-to-rail policy as a trumpet for the upcoming reform of freight transport structure. Meanwhile, the steel industry in China is stepping up the adjustment of capacity structure, in the context of supply-side reform.
Considering the importance of steel industry and severe air pollution in China, this article selects the BER, the gathering place of steel cities in China, as the study area. With Tubarão Port, Brazil as the fixed original port, the imported iron ore transport chain is divided into two parts, namely, the maritime transport and land transport, and a model is created to select the optimal transport plan, i.e. the transport modes, routes and carriers in each part. With the aid of the model, the authors conduct a rigorous and meaningful analysis on the structure and operation of the transport chain.
A total of 12 scenarios are designed to gradually expand the proportion of railway transport or promote the MTRW mode. The transport plans for imported iron ore are optimized under each scenario based on the demand of steel enterprises in the BER. By comparing the results under different scenarios, the impacts of the recent policies related to the international iron ore transport chain on carbon and nitrogen emissions can be revealed.
Impacts of transport structure adjustment
From the economic perspective, our analysis confirms that road-to-rail is an effective way to reduce the total transport cost. From the environmental perspective, it is feasible to lower carbon and nitrogen emissions and control pollutions by accelerating the development of multimodal transport, especially the MTRW, for railway and waterway are much greener than highway.
Impacts of capacity structure adjustment
By comparing the scenarios in Group A and Group B, it can be found that the adjustment of capacity structure, namely merging 49 steel enterprises in the BER into 21 large steel enterprises, can decrease the total cost, carbon and nitrogen emissions. However, the economic and environmental impacts of capacity structure adjustment might be marginalized, when it is coupled with the reform of freight transport structure and energy structure.
Impacts of energy structure adjustment
The energy structure here mainly refers to the ratio of diesel trucks and natural gas trucks in highway transport. Through the exploration of the energy structure adjustment, it is confirmed that natural gas trucks have an edge in nitrogen mitigation.
Another policy related to railway transport is the liquidation mechanism reform, which promises to reduce the unit transport cost of railway in future. Therefore, this article considers the reduction of unit transport cost of railway in different degrees.
Impacts of the liquidation mechanism reform
The sensitivity analysis shows that the reduction has a major impact on the economy of railway transport, only if the trains take up a certain proportion in the transport of imported iron ore. The unit transport cost should be reduced to a certain extent to achieve the desired economic effect. However, the economic effect is not always improving with the reduction, because the relationship between them is not linear. From the perspective of environmental impact, the decline in unit transport cost of railway will speed up the road-to-rail shift of long-distance land transport. However, less imported iron ore will be transported by the cleaner transport means (e.g. natural gas trucks in highway transport and ships in waterway transport). Therefore, the liquidation mechanism reform may not have positive effects on the environment.
Based on the results of the experimental analyses, several managerial insights are put forward and discussed as follows:
Regarding land transport, the road-to-rail policy and the diesel-to-natural gas policy are both of great significance from both economic and environmental point of views, and should be implemented simultaneously. The usage of diesel trucks should be eliminated. Of course, natural gas trucks also have several defects: the limited transport distance, the possibility of flameout failures, and the constraints of the location of gas filling station, etc. Therefore, the government should also promote necessary infrastructure related to natural gas.
Chinese coastal ports should vigorously promote the MTRW-based last-mile solution. Currently, the MTRW only takes up 2% of all transport modes in coastal ports across China. There is another advantage of the MTRW mode: two or multiple ports will be linked into a port system by the MTRW, facilitating the synergistic development and preventing homogenous competition between ports.
The government can formulate further adjustment plan of capacity structure based on the adjustment plan proposed in this article. Because our plan has been proven to have positive impacts on reducing the transport cost and emissions. However, an over-concentration of steel industry is not recommended.
Both our transport optimization model and scenario experiments can be replicated in other countries or continents. For example, these experiments could be applied to assess the impact of new freight transport structure, capacity structure and energy structure in countries along the Belt and the Road.
Despite the above contributions, this research also has several limitations, which deserve further research in the future. Firstly, the change of transport mode will also impose the health effects by mitigating carbon and nitrogen emissions. However, the potential economic and environmental sensitivity is beyond the research problem of this article. Secondly, the proposed scenarios do not cover the policy initiatives for shipping, e.g. the Emissions Control Area. The mitigation plan for sulfur emissions can be extended from that for carbon and nitrogen emissions from the imported iron ore transport chain. Further research is needed to identify the implications of the future improvement of air pollution standards. Finally, the other cargoes (e.g. automobiles, food and textile) cannot be directly examined with this approach. Freight transport of other cargoes is based on different decision-making rules. Hence, it is important to assess the feasibility of our approach through sector-specific case studies. Moreover, future research needs to consider the demand variation of imported iron ore with market cycles, and the bottlenecks of replacing highway transport with railway and waterway transports.
Author contributions
Yuzhe Zhao: Conceptualization, Supervision, Writing—Reviewing and Editing. Jingmiao Zhou: Methodology, Writing—Original draft preparation. Yujun Fan: Software, Validation. Mingming Feng: Data curation, Investigation. Zijian Zhang: Visualization.
tcmt_a_1840874_sm5848.docx
Download MS Word (17.3 KB)Acknowledgments
Our special thanks go to the anonymous reviewers for their constructive comments.
Disclosure statement
The authors have no other relevant affiliations or financial involvement with any organization or entity with a financial interest in or financial conflict with the subject matter or materials discussed in the manuscript apart from those disclosed. The authors declare no conflict of interest. No writing assistance was utilized in the production of this manuscript.
Additional information
Funding
References
- EPA: Sources of Greenhouse Gas Emissions [Internet]. US: EPA; 2019 [cited 2019 Aug 1]. Available from: https://www.epa.gov/ghgemissions/sources-greenhouse-gas-emissions
- Climate Change Connection: CO2 equivalents [Internet]. Canada: Climate Change Connection; 2019 [cited 2019 Aug 3]. Available from: https://climatechangeconnection.org/emissions/co2-equivalents/
- Chyxx: Analysis of the development of China’s steel industry in September 2019. [Internet]. Beijing: Zhiyan Kexin Consulting; 2019 [cited 2019 Dec 3]. Available from: http://www.chyxx.com/industry/201911/804538.html
- Statista: Distribution of global iron ore imports in 2018. [Internet]. Hamburg: Statista; 2019 [cited 2019 Dec 3]. Available from: https://www.statista.com/statistics/270008/top-importing-countries-of-iron-ore/
- Lu IJ, Lin SJ, Lewis C. Decomposition and decoupling effects of carbon dioxide emission from highway transportation in Taiwan, Germany, Japan and South Korea. Energy Policy. 2007;35(6):3226–3235.
- AAR: Freight Railroads Help Reduce Greenhouse Gas Emissions [Internet]. Washington (DC): AAR; 2018 [cited 2019 Dec 3]. Available from: https://www.aar.org/data/freight-railroads-help-reduce-greenhouse-gas-emissions/
- Qianzhan: China’s freight volume surpassed 50.6 billion tons in 2018. [Internet]. Beijing: Qianzhan Research; 2019 [cited 2019 Nov 1]. Available from: https://www.qianzhan.com/analyst/detail/220/190417-9cbb4aa3.html
- Murphy P, Poist R. Green perspectives and practices: a “comparative logistics” study. Supp Chain Manag. 2003;8(2):122–131.
- Bontekoning YM, Macharis C, Trip JJ. Is a new applied transportation research field emerging?––A review of intermodal rail–truck freight transport literature. Transp Res Part A Policy Pract. 2004;38(1):1–34.
- Qi X, Song D-P. Minimizing fuel emissions by optimizing vessel schedules in liner shipping with uncertain port times. Transp Res Part E Logist Transp Rev. 2012;48(4):863–880.
- Chen K, Yang Z, Notteboom T. The design of coastal shipping services subject to carbon emission reduction targets and state subsidy levels. Transp Res Part E Logist Transp Rev. 2014;61:192–211.
- Sanchez Rodrigues V, Beresford A, Pettit S, et al. Assessing the cost and CO2e impacts of rerouteing UK import containers. Transp Res Part A Policy Pract. 2014;61:53–67.
- Sanchez Rodrigues V, Pettit S, Harris I, et al. UK supply chain carbon mitigation strategies using alternative ports and multimodal freight transport operations. Transp Res Part E Logist Transp Rev. 2015;78:40–56.
- IPCC. Revised 1996. IPCC guidelines for national green house gas inventories: reference manual. Geneva: IPCC; 1996.
- IPCC. IPCC good practices guidance and uncertainty management in national greenhouse gas inventories. Geneva: IPCC; 2000.
- Mander S, Walsh C, Gilbert P, et al. Decarbonizing the UK energy system and the implications for UK shipping. Carbon Manag. 2012;3(6):601–614.
- Piecyk M, Mckinnon A. Forecasting the carbon footprint of road freight transport in 2020. Int J Prod Econ. 2010;128(1):31–42.
- Lättilä L, Henttu V, Hilmola O-P. Hinterland operations of sea ports do matter: dry port usage effects on transportation costs and CO2 emissions. Transp Res Part E Logist Transp Rev. 2013;55:23–42.
- Corbett JJ, Deans E, Silberman J, et al. Panama Canal expansion: emission changes from possible US west coast modal shift. Carbon Manag. 2012;3(6):569–588.
- Woodburn A, Browne M, Piotrowska M, et al. Literature Review WM7: Scope for modal shift through fiscal, regulatory and organisational change. United Kingdom: University of Westminster, University of Leeds; 2007.
- Jonkeren O, Jourquin B, Rietveld P. Modal-split effects of climate change: the effect of low water levels on the competitive position of inland waterway transport in the river Rhine area. Transp Res Part A Policy Pract. 2011;45(10):1007–1019.
- Liao C-H, Tseng P-H, Lu C-S. Comparing carbon dioxide emissions of trucking and intermodal container transport in Taiwan. Transp Res Part D Transp Environ. 2009;14(7):493–496.
- Beresford A, Pettit S, Liu Y. Multimodal supply chains: iron ore from Australia to China. Supp Chain Manag. 2011;16(1):32–42.
- Nieuwenhuis P, Beresford A, Choi AK-Y. Shipping or local production? CO2 impact of a strategic decision: an automotive industry case study. Int J Prod Econ. 2012;140(1):138–148. 2012).
- Harris I, Sanchez Rodrigues V, Pettit S, et al. The impact of alternative routeing and packaging scenarios on carbon and sulphate emissions in international wine distribution. Transp Res Part D Transp Environ. 2018;58:261–279.
- Robinson R. Ports as elements in value-driven chain systems: the new paradigm. Marit Policy Manag. 2002;29(3):241–255.
- Malchow MB, Kanafani A. A disaggregate analysis of port selection. Transp Res Part E Logist Transp Rev. 2004;40(4):317–337.
- Suykens F, Van De Voorde E. A quarter a century of port management in Europe: objectives and tools. Marit Policy Manag. 1998;25(3):251–261.
- Tongzon JL. Efficiency measurement of selected Australian and other international ports using data envelopment analysis. Transp Res Part A Policy Pract. 2001;35(2):107–122.
- Tongzon JL. Port choice and freight forwarders. Transp Res Part E Logist Transp Rev. 2009;45(1):186–195.
- González MM, Trujillo L. Reforms and infrastructure efficiency in Spain’s container ports. Transp Res Part A Policy Pract. 2008;42(1):243–257.
- Steven AB, Corsi TM. Choosing a port: an analysis of containerized imports into the US. Transp Res Part E Logist Transp Rev. 2012;48(4):881–895.
- Liao C-H, Tseng P-H, Cullinane K, et al. The impact of an emerging port on the carbon dioxide emissions of inland container transport: An empirical study of Taipei port. Energy Policy. 2010;38(9):5251–5257.
- Yang H. Optimization of multi-stage water transportation network for large dry bulk cargo considering carbon cost [dissertation]. Dalian: Dalian Maritime University; 2013.
- Zhang Y, Meng Q, Ng SH. Shipping efficiency comparison between Northern Sea Route and the conventional Asia-Europe shipping route via Suez Canal. J Transp Geogr. 2016;57:241–249.
- Li L, Lei Y, Pan D. Study of CO2 emissions in China’s iron and steel industry based on economic input–output life cycle assessment. Nat Hazards. 2016;81(2):957–970.
- Tian Y, Zhu Q, Geng Y. An analysis of energy-related greenhouse gas emissions in the Chinese iron and steel industry. Energy Policy. 2013;56:352–361.
- Peng J, Xie R, Lai M. Energy-related CO2 emissions in the China’s iron and steel industry: A global supply chain analysis. Resour Conserv Recycl. 2018;129:392–401.
- Zhou K, Yang S. Emission reduction of China’s steel industry: progress and challenges. Renew Sustain Energy Rev. 2016;61:319–327.
- Gu W, Xu R. Study on impacts of GHG Fund for shipping emission reduction on China’s iron ore import cost. 2012 IEEE International Conference on Computer Science and Automation Engineering; 2012 May 25–27; Zhangjiajie, China. New York: Institute of Electrical and Electronics Engineers (IEEE); 2012. p. 685–688.
- Tian H, Hao J, Lu Y. Nitrogen oxides emissions arising from commercial energy consumption in China. Chinese J Environ Sci. 2001;22(6):24. [Chinese].
- Tacken J, Sanchez Rodrigues V, Mason R. Examining CO2e reduction within the German logistics sector. Int J Logist Manag. 2014;25(1):54–84.
- Perham S. Hydrogen giving reduced carbon emissions from vehicles. Int J Low-Carbon Technol. 2012;7(1):23–27.
- Din T, Hillmansen S. Energy consumption and carbon dioxide emissions analysis for a concept design of a hydrogen hybrid railway vehicle. IET Electr Syst Transp. 2018;8(2):112–121.
- My Steel Network [Internet]. 2019 [cited 2019 Dec 3]. Available from: www.mysteel.com
- Ministry of Commerce of China: Opinions of the State Council on the iron and steel industry’s elimination of excess capacity and realization [Internet]. Beijing: Ministry of Commerce of China; 2016 [cited 2019 Dec 3]. Available from: http://www.mofcom.gov.cn/article/b/g/201604/20160401305114.shtml
- China Ports & Harbours Association. China Port Yearbook 2018. Shanghai: China Ports & Harbours Association; 2018.
- Bunkerworld [Internet]. 2018 [cited 2019 Dec 1]. Available from: www.bunkerworld.com
- Ministry of Transport of China: Port charge method [Internet]. Beijing: Ministry of Transport of China; 2019 [cited 2019 Dec 1]. Available from: http://www.jseport.gov.cn/content/10081.shtml.
- Crewcn [Internet]. 2017 [cited 2019 Dec 1]. Available from: http://www.crewcn.com/searchjobs.asp
- Clarksons [Internet]. 2017 [cited 2019 Dec 1]. Available from: https://sin.clarksons.net/#/login/?returnPath=Timeseries
- Lindstad H, Asbjørnslett BE, Strømman AH. Reductions in greenhouse gas emissions and cost by shipping at lower speeds. Energy Policy. 2011;39(6):3456–3464.
- IMO. Third IMO GHG Study 2014. London: IMO; 2014.
- China logistics trading center [Internet]. 2019 [cited 2019 Dec 1]. Available from: https://www.56135.com/index.html
- China Railway [Internet]. 2019 [cited 2019 Mar 1]. Available from: https://www.12306.cn/yjcx
- Walnum HJ. Energy use and CO2 emissions from cruise ships – a discussion of methodological issues, Vestlandsforsking Note. Norway: Minister of Trade and Industry; 2011.
- UK Government: Greenhouse Gas Reporting: Conversion Factors 2017. [Internet]. London: UK Government; 2017 [cited 2019 Mar 1]. Available from: https://www.gov.uk/government/publications/greenhouse-gas-reporting-conversion-factors-2017
- Mckinnon A. CO2 emissions from freight transport in the UK. Edinburgh: Logistics Research Centre, Heriot-Watt University; 2007.
- China Railway: Freight incremental action plan 2018-2020 [Internet]. Beijing: China Railway; 2018 [cited 2019 Mar 1]. Available from: http://www.china-railway.com.cn/xwdt/jrtt/201807/t20180704_71706.html