
 ?Mathematical formulae have been encoded as MathML and are displayed in this HTML version using MathJax in order to improve their display. Uncheck the box to turn MathJax off. This feature requires Javascript. Click on a formula to zoom.
Abstract
Soil carbon (C) pools and biological indicator plays an important role in maintaining soil quality. Land use change from naturally undisturbed to intense cultivation had significant impact on C storage due to change in soil biological properties. The present study was conducted to understand the impact of land use change from the uncultivated to intensively cultivated soils under rice–wheat and cotton–wheat cropping system on labile and stable C pools, soil microbial and enzymatic activity, and a change in nutrient availability. The Olsen’s P concentration was significantly (p < 0.05) higher in soils under rice–wheat, while ammonium acetate (NH4OAc)-K was higher in the uncultivated soils, compared with others. Soils under cotton–wheat cropping system had significantly lower total organic carbon (TOC) in contrast to rice–wheat soils. The uncultivated soils had the highest TOC concentration, which was ∼20.2% higher than rice–wheat and ∼46.4% than the cotton–wheat soils. The water extractable organic carbon (WEOC) was the smallest organic C fraction (∼0.31%–0.40% of TOC), and was significantly lower in cotton–wheat soils. The basal soil respiration (BSR) and mineralization quotient (qM) were significantly higher for rice–wheat, compared with the cotton–wheat soils. These microbial indices were improved due to increased alkaline phosphates (Alk-P) and dehydrogenase (DHA) enzymatic activity in soil. Soil microbial biomass C (MBC) was significantly higher (by ∼31.7%–57.3%) in the uncultivated than the cultivated soils which has increased the C mineralization in soil. The stable C pool comprised ∼68.8% of TOC in the uncultivated soils, almost similar to rice–wheat soils (∼68.5%), but higher than cotton–wheat soils (∼61.9%). The stable C pool leads to C rehabilitation indicated by higher C management index for rice–wheat soils. The principal component analysis (PCA) distinct the uncultivated soils from the cultivated soils under two cropping systems based on BSR and labile C (Fract. 2) in PC1 (explaining ∼82.7% of total variability), and the microbial (qmic) and mineralization (qM) quotient in PC2 (∼17.3% variability). These indicators were most influential for studying C dynamics of the natural ecosystem and restoring the cropland ecosystem by suitable soil management practices.
Highlights
The stable C pool comprised 68.8% of total organic carbon in the uncultivated soils, almost similar to rice–wheat soils (68.5%), but higher than cotton–wheat soils (61.9%).
Basal soil respiration, the microbial and mineralization quotient identified as key soil quality indicators.
Rice–wheat cropping system with C rehabilitation has proved to be more productive in maintaining the soil quality.
Introduction
The concentration of atmospheric carbon dioxide (CO2) has increased gradually from 280 ppmv during the pre-industrial era to 408 ppmv by now, and has been projected to increase by 0.5% year−1 or at 3.3 Pg C year−1 (1Pg = 1015g) [Citation1,Citation2]. The cultivated soils are considered as an important source of CO2, contributing approximately one-fifth of the total CO2 emissions through soil and root respiration. Soils act as source as well as sink of carbon (C), and contribute towards global C budgets. The accurate assessment of C pool in soils under agricultural cropland ecosystem is necessary to determine a sink or C source under various crop production and soil management regimes [Citation3] Soils under different agricultural croplands vary considerably, depending upon differences in crop production and soil management practices, above-and below-ground C input [Citation4] and its quality, soil microbial biomass, enzymatic activity and the differential rate of C stabilization [Citation5,Citation6]. Due to land use change, cropland ecosystems have lost up to two-third of their original soil organic carbon (SOC) pool, with a cumulative loss of 30–40 Mg C ha−1 [Citation7]. The environmental degradation caused by the adoption of inappropriate cropping systems after land use change has drawn attention worldwide and raised serious concerns affecting the sustainability of agricultural production systems [Citation7]. The cropping systems alter the plant cover, composition and biomass quality to impact below-ground C cycling [Citation8]. Land use change from uncultivated lands to cropland ecosystems often lead to loss of biodiversity and depletion of soil organic matter [Citation9], with subsequent changes in soil physico-chemical and biological properties [Citation10]. Land use change has made it necessary to accurately assess the variations in soil C dynamics with respect to a natural ecosystem for evolving long-term management policies [Citation7].
Soils’ microbial diversity is considered important for ecosystems’ functioning, both in relation to direct interactions with plants with respect to nutrient transformations and organic C cycling [Citation11]. Notwithstanding the changes in SOC pool and nutrient transformations caused by soil micro-organisms, cropping systems are known to influence soil microbial biomass and its diversity which impacts enzyme activity in soil [Citation12]. Soil enzymatic activities are referred as ‘sensors’ of soil degradation as they manifest the physico-chemical conditions of soil and are indicators of its microbial status [Citation13]. Soil microbial biomass is considered more reactive than the SOC to depict changes occurring in soil environment [Citation12,Citation14]. Indeed, the impacts of soil management induced changes are more readily discernible via soil microbial biomass and the enzymatic activity [Citation5,Citation12,Citation14]. There exists a direct linkage between seasonal fluctuations in soil microbial biomass, which in turn influences soil organic matter turnover as well as nutrient cycling in soils. Soil enzymatic activity is highly sensitive to the change in soil environment, and is therefore, necessary to understand the mechanisms of SOC dynamics. Soils enzymes respond promptly to the changes caused by natural as well as anthropogenic factors that influence specific C substrate. Soil management practices under different cropping practices are known to alter the biological processes in the soil and that impacts soil quality [Citation15].
Soil is a dynamic and living resource and therefore biologically mediated processes are central to its ecological functions [Citation16]. Land use change has a direct impact on soil nutrient supply and their distribution , and stimulates the biological changes in the rooting zone [Citation27]. Changes in land use system and its management can cause positive and negative impact on the rhizospheres’ microbial community [Citation17]. The root exudates and secretions in the rhizosphere vary differentially among plant species grown which serves as a substrate for soil micro-organisms. It is well known that the nutrient demand of crops is different and crop species differ widely with respect to quantity and quality of litter produced [Citation18], which in turn affect the diversity and composition of micro-organisms [Citation12]. The changes in land use systems lead to wide variations is above and below-ground ecosystem, often causing depletion in soil C and biodiversity loss [Citation8].
The changes occurring in land use system could lead to significant impact on soil organic matter content, quality and the enzyme activity. It is well known that the studies on land use change impacts on SOC dynamics and climate change are incomplete without understanding their influence on soil C pools and biological activity [Citation19]. Soil micro-organisms play a key role in the processes that are crucial for long-term sustainability of agricultural systems [Citation19]. The microbiological properties of soils are considered highly sensitive indicator of soil ecological stress [Citation20]. The diversification of land use systems has been a multi-disciplinary approach, which includes an intimate interaction among soil, water, climate, livestock, vegetation and socio-economic dimensions in formulating most remunerative, eco-friendly and environmentally sustainable polices. These dimensions involve complex interaction between soil management practices, soil biological components, and the environmental quality which assumes a considerable agricultural and ecological importance [Citation21]. The impact of land use change from the uncultivated soils to intensively cultivated soils under two intensive cropping systems viz. rice–wheat and cotton–wheat characterized by contrasting alteration in soil moisture regimes on soil C dynamics in relation to soil enzymatic activity governing the nutrient transformation is less well known. The impact assessment of management strategies adopted in different cropping systems require detailed understanding of prevailing physical and chemical characteristics of soils, organic C pools and the biological properties of soils under different cropping systems vis-à-vis uncultivated lands. In south-western Punjab (India), rice–wheat and cotton–wheat are the predominant cropping systems with diverse crop production and soil management practices, which often leads to differential C input and its stabilization under the influence of contrasting moisture regimes under which these crops are grown [Citation3]. We hypothesize that the intensive rice–wheat and cotton–wheat cropping play a crucial role in regulating soil biology and biochemical changes due to change in soil microbial biomass and enzymatic activities which are function of soil C pools that alters differentially under different moisture regimes. The objectives of the present study were (i) to decipher the respective soil C pools, enzymatic activity and their relationship with physical and chemical properties of soils under rice–wheat and cotton–wheat cropping systems, and (ii) to use them as a potential soil health indicators as a quick tool to frame a strategy to enhance C storage for mitigating the accelerated environmental degradation due to rice–wheat and cotton–wheat cropping in the south-western Punjab (India).
Material and methods
Description of study area
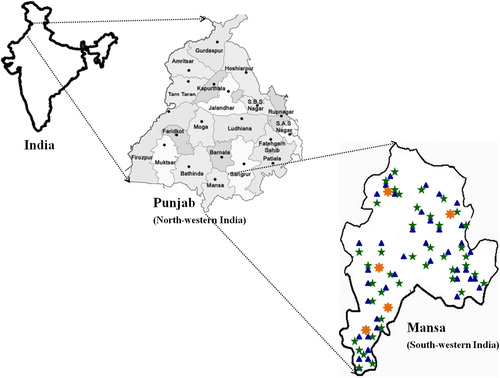
The study sites are situated in a south-western Punjab, a region in north-western India (). Study area in Mansa district (29°30′–30°15′ N, 75°10′–75°46’E) which encompasses 2,198 square km area, and lies in topographic sheet 44 N/08,12 and 44 O/01,02,05,06,09 [Citation22]. The climate of the region is typically a sub-tropical steppe, semi-arid type characterized by discrete wet and dry seasons. Mean normal annual rainfall of 378.2 mm (occurred in 23 days) is highly erratic with spatial uneven distribution. Of the total annual rainfall, ∼83% occur during the monsoon season extending from last week of June to end of September due to south-west monsoon. The remaining ∼17% of total average annual rainfall occur during non-monsoon months. Mean maximum temperature of 48 °C in May-June and the mean minimum temperature of 3.5 °C in the month of January characterize the study area with intensely hot summer and cold winter. This region forms a part of Indo-Gangetic Plains (IGPs) and composed of unconsolidated quaternary sediments broadly classified as older alluvium, newer alluvium and Aeolian deposits as sand dunes and sheets.
Figure 1. Geographical location of soil sampling sites under rice–wheat (blue triangle) and cotton–wheat (green star) cropping system and uncultivated (orange star) soils in south-western Punjab ).
Brief description of sampling sites
Eighty-nine different soil sampling sites viz. 42 rice–wheat, 42 cotton–wheat and 5 uncultivated (reference sites) with almost similar physiographic conditions were selected from the study area. These sites were selected to involve uncultivated vis-à-vis intensively cultivated sites under rice (Oryza sativa L.), wheat (Triticum aestivum L.) and cotton (Gossypium hirustum L.) – wheat cropping system with a long history of >10 years. On the sampled sites, majority of farmers fertilized wheat crop with 138–163 kg N and 51–63 kg P2O5 ha−1. The farmers were applying 163–188 kg N ha−1 to rice [Citation23] and 113–151 kg N ha−1 to cotton (authors unpublished data) in the study region. At some K deficient locations, an application of 30 kg K2O ha−1 was made to wheat, rice and cotton. The N, P and K were applied as urea (46% N), diammonium phosphate (18% N and 46% P2O5) and muriate of potash (60% K2O), respectively. These crops were adequately irrigated as and when required with groundwater and canal water. The uncultivated soils were under natural vegetation of mixed grasses and unmanaged volunteer shrubs for more than 30 years. Farmers apply irrigation to these crops through underground and canal water depending on visual inspection of the field. Rice fields had large diversity with respect to irrigation water management, viz. continuous flooding, intermittent flooding with single aeration and intermittent flooding with multiple aerations [Citation3]. Rice is established in puddle fields following wet tillage. The artificial moisture regime established in rice cultivation during puddling (wet tillage) by mechanically stirring and mixing the surface soil layer with stagnant water converts soil into a muddy paste. The conventional tillage for wheat establishment involves 2–3 operations of disc harrow, 3–4 plowings with cultivator, followed by 1–3 field leveling operations [Citation4]. In cotton, conventional tillage involves 2–3 disc harrow operations followed by 2–3 plowings with cultivators and then 1–2 field leveling operations. After tillage, and a fine seed bed is prepared and crops (wheat and cotton) are sown with conventional seed-cum-fertilizer-drills. Average rice grain yield of 8.3 ± 0.15 Mg ha−1 and straw yields of 10.9 ± 0.20 Mg ha−1 were recorded in the study area [Citation24]. In the study region average wheat grain yield of 5.1 ± 0.1 Mg ha−1 and the straw yields of 8.8 ± 0.2 Mg ha−1 are harvested [Citation25]. Average seed cotton yield in the study region (2016–2018) varied between 1.7 and 2.2 Mg ha−1 (authors unpublished data). The amount of C added to SOC pool in the surface (0–15 cm) soil layer in the study region varied between 2.1 and 6.4 Mg C ha−1 under rice–wheat cropping system, depending upon rice residue management [Citation4]. The amount of C added to SOC pool in rice ecosystem was significantly higher by 161.3 kg C ha−1 compared with cotton ecosystem [Citation3].
Soil sampling and analyses
Surface (0–15 cm depth) soil samples were collected from uncultivated (n = 5) and intensively cultivated soils under rice–wheat (n = 42) and cotton–wheat (n = 42) cropping system. The geographical locations of the sampling sites in south-western Punjab (India) are shown in . Soil samples were collected in May–June 2018, after the wheat harvesting. At each site, three pseudo-replications were established and therefore, a total of 89 surface soil samples (42 location × 2 cropping systems + 5 uncultivated soils) were collected with a metallic soil core sampler (inner diameter 7.2 cm). Soil sample were passed through a 2.0 mm sieve for basic soil analysis and determination of organic C and its pools. One portion of each soil sample was stored immediately at 4 °C to assay microbial activities viz. alkaline phosphatase (Alk-P), dehydrogenase (DHA), microbial biomass C (MBC) and for C mineralization studies. Majority of soils were light in texture with mean sand content of 710, 717 and 730 g kg−1 in the uncultivated soils and the soils under rice–wheat and cotton–wheat cropping system. Soils were having sandy loam to loamy sand in texture.
Basic soil analysis
Soil samples were analyzed for pH1:2 (1:2; soil: water suspension) using a glass electrode, electrical conductivity (E.C.1:2) (1:2; soil: water supernatant) with a conductivity meter, and particle size distribution by international pipette method. Olsen’s P in soil samples was determined by extracting the soils with 0.5 M NaHCO3 (pH = 8.5, 1:20; soil: NaHCO3), followed by colorimeterical measurement of P concentration in the extract. Available-K in soil samples was extracted with 1 N NH4OAC-K (pH = 7.0) followed by flame photometric determination. The concentrations of diethylenetriamine pentaacetic acid (DTPA) extractable micro-nutrients viz. zinc (Zn), iron (Fe), copper (Cu) and manganese (Mn) in soils samples was extracted from soil with DTPA solution (0.005 M DTPA + 0.01 M CaCl2 + 0.1 M TEA buffer adjusted to pH = 7.3). The determinations of these heavy-metals and micro-nutrients cations were performed with inductively coupled argon plasma-atomic emission spectrophotometer (ICAP-AES).
SOC and its pools
SOC was determined by wet digestion method [Walkley and Black’s method]. Total organic carbon (TOC) in soil was determined by reacting with 1 N potassium dichromate (K2Cr2O7) solution at 150° C for 60 min [Citation26]. Water extractable organic carbon (WEOC) was determined by shaking 10 g soil with 20 ml deionized water for 60 min [Citation18] The four fractions of TOC were determined under a gradient of oxidizing conditions using H2SO4 (sulfuric acid)–aqueous solution ratios of 0.5:1, 1:1 and 2:1 [Citation27], which correspond to 12, 18 and 24 N H2SO4, respectively [Citation19]. Organic C concentration was determined using these acid-aqueous solution ratios for the division of TOC as four fractions of decreasing oxidizability/lability viz. very labile C (Fract. 1), labile C (Fract. 2), less labile C (Fract. 3) and recalcitrant C (Fract. 4) using EquationEquations (1)–(4). justified the equations and change H2SO4 in equation 2
(1)
(1)
(2)
(2)
(3)
(3)
(4)
(4)
Carbon management index (CMI)
The CMI was calculated using Equation (5) as per mathematical procedure described by Blair et al. [Citation28]. The labile C concentration in the uncultivated soils was taken as the reference.
(5)
(5)
where CPI is the carbon pool index and LI is the lability index. The CPI and the LI were calculated using Equations (6) and (7).
(6)
(6)
(7)
(7)
Soil microbiological properties
Soil microbial biomass C (MBC) was determined by chloroform fumigation extraction (CFE) method [Citation29] using a recovery factor (KEC) of 0.41. The basal soil respiration (BSR) was estimated as the amount of CO2 evolved during 7 days period of time absorbed in a known volume and strength of sodium hydroxide (NaOH). The excess NaOH in alkali traps was titrated against standard hydrochloric acid (HCl). The amount of CO2 released was calculated by measuring exact volume of NaOH used for CO2 absorption. The mineralization quotient (qM) was calculated as the ratio of Cmin to TOC (μg Cmin μg TOC−1). The respiratory quotient (qCO2) was calculated from the ratio of BSR to MBC (μg CO2 basal-C h−1 × μg biomass C−1) × 103. The microbial quotient (qmic) was calculated as the ratio of MBC to TOC (μg biomass C μg TOC−1).
Soil enzymatic activity
The alkaline phosphatase (Alk-P) activity in soils was determined using a p-nitrophenyl method [Citation30]. The procedure described for assay of phosphomonoesterase activities is based on the colorimetric estimation of the p-nitrophenol released by phosphatase activity when soil is incubated with buffered sodium p-nitrophenyl phosphate solution (pH = 11). The dehydrogenase activity (DHA) was determined as triphenylformazan (TPF) produced by the reduction of 2, 3, 5-triphenyltetrazolium chloride (TTC) [Citation31].
Statistical analysis
The data were statistically analyzed using analysis of variance (ANOVA) technique in randomized block design using SPSS 16 (Chicago, IL, USA). Means for treatment effects were separated based on fisher's protected least significant difference (LSD) at p < 0.05. Principal components (PCs) for a data-set were defined as linear combinations of variables account for maximum variance within the set by describing vectors of closet fit to the ‘n’ observation in ‘p-dimensional’ space. The PCs with high eigen values and variables with high factor loading were assumed as variables that best represented system attributes. Within each PC, only highly weighted factors were retained for minimum data-set (MDS). The highly weighted factor loadings were defined as having absolute values within 10% of the highest factor loading. When more than one factor was retained under a single PC, multivariate correlation coefficients were employed to determine if the variables could be considered redundant and therefore, eliminated from the MDS.
After determining the MDS indicators, every observation of each MDS indicator was transformed using a linear scoring method. Indicators were arranged in order depending on whether a higher value was considered 'good' or 'bad' in terms of soil function. For 'more is better' indicators, each observation was divided by the highest observed value such that the highest observed value received a score of 1. For 'less is better' indicators, the lowest observed value (in the numerator). By using a linear scoring method, the MDS indicators scores obtained for each observation was multiplied with the weighted factor obtained from the PCA results. Each PC explained a certain amount (%) of the variation in the total data-set. This percentage, when divided by the total percentage of variation explained by all the PCs with eigen vectors >1, gave the weighted factors for indicators chosen under a given PC. The score was then multiplied by the weighting factor derived from the PCA to obtain the ultimate index value for soil quality under different land use systems.
The soil quality index (SQI) was calculated using integrated score and weight factor of each indicator using EquationEquation (8)(8)
(8) [Citation56].
(8)
(8)
where ‘S’ = indicator score and ‘W’= PCs weight factor.
Results
Basic soil properties
Soil under rice–wheat cropping system had significantly lower E.C., compared with soils under cotton–wheat cropping and uncultivated soils (). The soils under cotton–wheat cropping system were light in texture and had significantly higher sand (730 g kg−1) content, compared with those under rice–wheat system and the uncultivated soils. On the other hand, clay content in the uncultivated and rice–wheat soils was significantly higher than the soils under cotton–wheat cropping system. The Olsen's P was significantly lower in uncultivated, and was at par with intensively cultivated soils under cotton–wheat cropping system. Rice–wheat soils had 37.3 and 15.9% higher Olsen’s P, compared with the uncultivated and the soils under cotton–wheat cropping system. The uncultivated soils had significantly higher NH4OAC-K concentration than the cultivated soils. DTPA-Fe was significantly higher, while DTPA-Mn was lower in rice–wheat, compared with soils under cotton–wheat cropping system.
Table 1. Important physical and chemical properties of surface (0–15 cm) layer of uncultivated soils and the soils under rice–wheat and cotton–wheat cropping system in south-western Punjab, India.
Organic carbon and its fractions
Mean concentration of Walkley and Blacks’ C (i.e. SOC) was significantly lower in cotton–wheat, compared with the soils under rice–wheat cropping system (). The uncultivated soils had 0.61 g kg−1 (13.2%) and 1.40 g kg−1 (36.4%) higher SOC, compared with cultivated soils under rice–wheat and cotton–wheat cropping system, respectively. The TOC concentration was significantly higher in the uncultivated soils, compared with cultivated soils under cotton–wheat and rice–wheat cropping system. Mean TOC was 13.9%–22.0% higher than the TOC concentration in the uncultivated and cultivated soils. The WEOC varied between 13.3 and 21.4 mg kg−1 and was the smallest organic C fraction (0.31%–0.40% of TOC). WEOC was significantly lower soils under cotton–wheat cropping system, compared with the uncultivated and rice–wheat soils which did not differ significantly. The very labile C (Fract. 1) was significantly lower in cotton–wheat, highest in rice–wheat with the uncultivated soils in-between. Conversely, the stable C (Fract. 3 + Fract. 4) was significantly lower in soils under cotton–wheat, compared with rice–wheat and uncultivated soils . Recalcitrant C (Fract. 4) was significantly higher in uncultivated, compared with cultivated soils under rice–wheat and cotton–wheat system. The cultivated soils under rice–wheat had significantly higher (64.8%) recalcitrant C pool, compared with soils under cotton–wheat cropping system. Relative preponderance of these four fractions of variable oxidizability in the uncultivated and cultivated soils follows an order: Fract. 1 < Fract. 2 < Fract. 3 < Fract. 4. The Fract. 1 was the smallest fraction, comprising 12.4%–16.8% of TOC; and was significantly higher in the uncultivated, compared with cultivated soils (). The stable C pool (Fract. 3 + Fract. 4) comprised 68.8% of TOC in the uncultivated soils, compared with 68.5% in rice–wheat, and 61.9% in cotton–wheat soils.
Figure 2. Distribution of soil organic carbon fractions of varying oxidizability (as % of total organic carbon) surface (0–15 cm) layer of cultivated soils under rice–wheat and cotton–wheat cropping system and uncultivated soils in south-western Punjab, India. Mean values for each C fraction followed by different letters were significant at p < 0.05 by least significant difference (LSD) test.
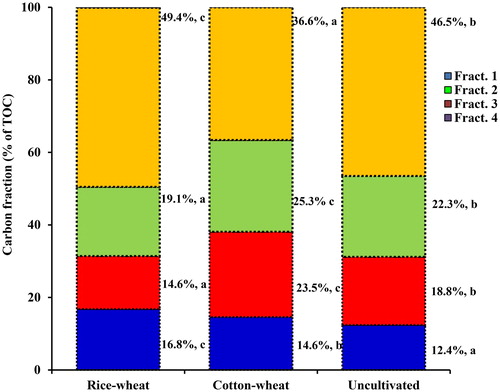
Table 2. Soil organic carbon (SOC), total organic carbon (TOC), water extractable organic carbon (WEOC), organic carbon fractions of varying oxidizability and carbon management index for the surface (0–15 cm) layer of uncultivated soils and the soils under rice–wheat and cotton–wheat cropping system in south-western Punjab, India.
CMI
The CMI was significantly lower for soils under cotton–wheat, compared with the soils under rice–wheat cropping system owing to significantly lower LI for rice–wheat soils (). The lower value of LI for rice–wheat soils render these soils high in CPI and CMI. On an average, CMI of rice–wheat soils ∼3.5% higher compared with the soils under cotton–wheat cropping system. The lower CMI value for cotton–wheat soils revealed that soil organic matter quality has been degraded to a greater extent compared with the soils under rice–wheat system. Indeed, these results corroborate the existence of high proportion of stable C pool (Fract. 3 + Fract. 4) in soils under rice–wheat, compared with the cotton–wheat cropping system.
Soil microbial and enzymatic activity
Soil microbial biomass carbon was significantly higher (31.7%–57.3%) in the uncultivated soils, compared with the cultivated soils (). Among cultivated soils, rice–wheat had ∼19.4% higher MBC than the soils under cotton–wheat cropping system. The BSR for the uncultivated and cultivated soils under cotton–wheat was lower (∼22.2%), compared with rice–wheat cropping system. The qM was significantly higher for the uncultivated soils, compared with the cultivated soils under two different cropping systems. The soils under rice–wheat system had significantly higher qM (∼41.9%), compared with the soils under cotton–wheat cropping system. The qCO2 was significantly lower for the uncultivated soils, compared with the cultivated soils which did not differ significantly. The qmic however, did not differ significantly among the uncultivated and cultivated soils under the two different cropping systems.
Table 3. Soil microbial activity in surface (0–15 cm) layer of uncultivated and soils under rice–wheat and cotton–wheat cropping system in south-western Punjab, India.
The Alk-P activity was significantly higher in the uncultivated and rice–wheat soils, compared with the soils under cotton–wheat cropping system (). Soils under cotton–wheat cropping system had ∼41.1% lower Alk-P concentration, compared with the uncultivated soils. The soils under rice–wheat cropping system on the other hand had ∼70.3% higher Alk-P concentration, compared with the soils under cotton–wheat cropping system. The DHA was however, significantly higher in soils under rice–wheat cropping system than the other investigated soils. The cotton–wheat had ∼34.1% lower DHA than the uncultivated soils, and ∼65.9% lower than the rice–wheat cropping system.
Relationship between soil properties, C pools and enzymatic activity
The correlation matrix showed a highly significant correlation between TOC and C fractions of variable oxidizability (). Data pooled for land uses (uncultivated vs. cultivated soils) revealed that Fract. 1, Fract. 3 and Fract. 4 were significantly (p < 0.01) related to WEOC. The Fract. 2 did not show any relationship with soil enzymatic activity. TOC exhibited a significant negative relationship with the LI. The LI showed significant negative relationship with WEOC (r = –0.411*, p < 0.05), MBC (r = –0.473*, p < 0.05), Alk-P (r = –0.461*, p < 0.05) and DHA (r = –0.384*, p < 0.05).
Table 4. Pearson correlation coefficient (r) between various organic carbon pools and enzymatic activity in surface (0–15 cm) layer of uncultivated and soils under rice–wheat and cotton–wheat cropping system in south-western Punjab, India.
Principal component analysis (PCA)
The PCA clearly separated the treatments and variables in the factorial space. Within a given PC, each variable had corresponding eigen vector weight value or factor loading (). The PC1 and PC2 explained 100% variability in the data-set (82.7% and 17.3% of total variability, respectively). The bold-face values for BSR and Fract. 2 for PC1 and qmic and qM for PC2 were highly weighted eigen vectors, and therefore were initially selected in the MDSs. The PC1 explaining the highest variance had positive factor loading value of 0.999 for BSR and negative factor loading of −0.999 for Fract. 2. The PC2 explaining second largest variance with eigen value of 2.77 with the highest positive loading value of 0.854 for qmic and the qM with factor loading value of 0.840. The total variance for the MDS varied from 0.17 (PC2) and 0.83 (PC1).
Table 5. Loading values and percent contribution of soil properties on the axis identified by the principal component analysis (PCA).
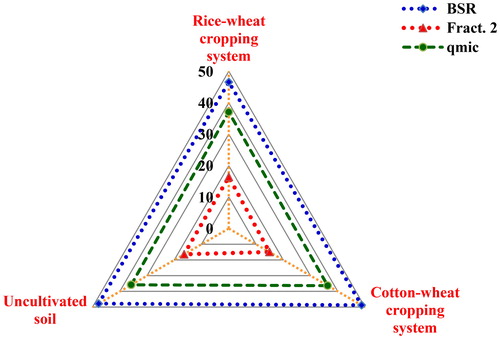
The position of different variables and treatments in the orthogonal space were defined by these PCs () showed that the uncultivated soils were clearly separated from the cultivated soils under rice–wheat and cotton–wheat cropping systems. It was evident because the cluster of cropping systems and soil properties were situated at a maximum distance along the PC1 that explained the maximum variability of soil attributes. The PCA showed that contribution of BSR towards SQI was the highest for the soils under cotton–wheat (0.399), followed by soils under rice–wheat cropping system (0.369) and the lowest for undisturbed soils (0.352) (). For Fract. 2, the highest contribution toward SQI was observed for soils under rice–wheat (0.130) followed by cotton–wheat cropping system (0.120). For microbial quotients contributed maximum to SQI of soils under cotton–wheat (0.297) followed by rice–wheat (0.293) and the minimum in the undisturbed soils (0.264). The relative order of contribution of the selected indicators towards SQI was 47.7% for BSR, 36.4% for microbial quotients, 15.9% for Fract. 2 (). The specific contribution of MDSs toward SQI presented through radar plot showed that the BSR had the highest MDSs (46.6–48.8), Fract. 2 (14.9–16.4) had the lowest, whilst qmic (35.8–37.0) in-between for the uncultivated and cultivated soils under rice–wheat and cotton–wheat cropping system ().
Figure 3. Principle component analysis (PCA) bi-plots on the soil properties including soil organic C (SOC), total organic C (TOC), its labile pools in the cultivated soils under rice–wheat and cotton–wheat cropping system and the uncultivated soils in south-western Punjab, India (Fract. 1 = very labile C, Fract. 2 = labile C, Fract. 3 = less labile C, Fract. 4 = recalcitrant C, MBC = microbial biomass C, WEOC = water extractable organic C, KMnO4-C = potassium permanganate oxidizable organic C, DHA = dehydrogenase activity, Alk-P = alkaline phosphatase, qM = mineralization quotient, BSR = basal soil respiration, qmic = microbial quotient).
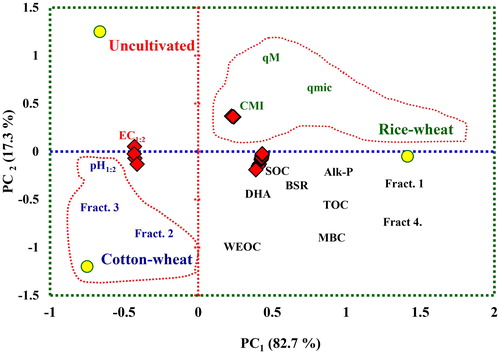
Figure 4. Mean effect of land-use systems on soil quality index (SQI) and the individual contribution of each of the key indicators for cultivated soils under rice–wheat and cotton–wheat cropping system and the uncultivated soils. (qmic = microbial quotient, BSR = basal soil respiration and Fract. 2 = labile carbon). Mean values for each C fraction followed by different letters were significant at p < 0.05 by least significant difference (LSD) test.
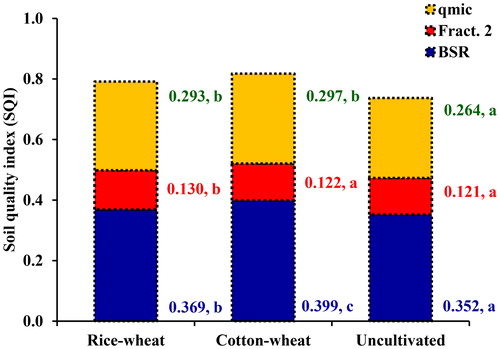
Figure 5. Relative contribution of the selected soil quality indicators towards soil quality index (SQI) of cultivated soils under rice–wheat and cotton–wheat cropping system and the uncultivated soils in south-western Punjab, India (BSR = basal soil respiration, Fract. 2 = labile carbon, qmic = microbial quotient).
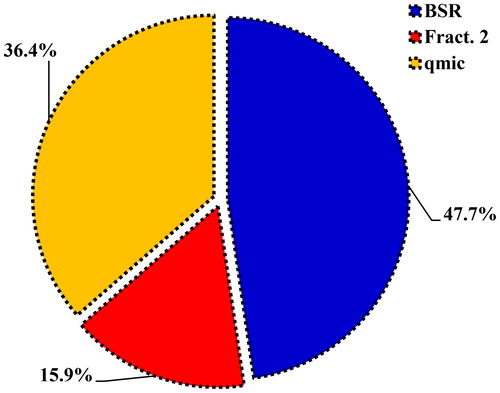
Figure 6. The distribution of mean specific contribution of minimum data-sets (MDSs) toward soil quality index (SQI) for the uncultivated and the cultivated soils under different cropping systems.
Discussion
Basic soil properties
An improved knowledge of agricultural cropland is crucial to design farming systems that effectively maintained or increased the soil quality. In this study, intensively cultivated soils produced a significant change in organic C pools and biological parameters. A significantly higher E.C. of soils under rice–wheat and cotton–wheat systems was ascribed to the use of poor quality irrigation water having high concentration of soluble salts. The high evapo-transpiration demand in low rainfall areas determines the soluble salt accumulation at the soil surface. The study area in south-western Punjab (India) has low mean rainfall (378.2 mm year−1) [Citation22], and ∼40% of the underground waters had salinity or alkalinity hazards [Citation32]. The acute paucity of good quality irrigation water in the study region has forced farmers to make use of poor quality underground water or cyclic use of sodic and canal water in rice–wheat and cotton–wheat cropping system [Citation32].
Relatively higher concentration of Olsen’s P and NH4OAC-K in soils under rice–wheat, compared with cotton–wheat and the uncultivated soils could be ascribed to the continuous application of fertilizer-P and K (). Continuous application of fertilizer-P has shown large build-up of Olsen’s P in soils [Citation33]. Estimates showed that 10%–40% of fertilizer-P gets accumulated in soils during the first growing season [Citation49], because of P sorption on the soil colloidal complex [Citation34] and the formation of stable P compounds such as dicalcium phosphate dehydrate (DCPD), β-tricalcium phosphate (β-TCP) and hydroxyl apatite (HA) in soils [Citation35]. The micro-nutrients’ availability in the cultivated and the uncultivated soils showed quite a similar trend to TOC content, responsible for binding of micro-nutrients and their availability. A positive and significant correlation between TOC and micro-nutrient content has been reported earlier [Citation36]. Soil organic matter enhances soil aeration and protects micro-nutrients against oxidation and precipitation and supply chelating agents, thereby increasing micro-nutrients’ availability in soil [Citation37]. A relatively higher micro-nutrients’ availability in the cultivated soils, compared with the uncultivated soils was due to the application of organic manures and chemical fertilizers.
Organic carbon and its fractions
The TOC is composed of labile (actively pool) and non-labile (stable or recalcitrant pool) C fractions with a variable mean residence time are determined by the opposing processes of C inputs and losses [Citation18]. The change in TOC pool are not discernible in short term time scale; rather several years following land use change are required to reflect a significant change in TOC pool [Citation10]. A significant loss in TOC pool occurred following land use change from the uncultivated to intense cultivation under rice–wheat and cotton–wheat cropping system was related to increased rate of soil organic matter decomposition. The deterioration of soil quality characterized by C loss due to decreased aggregate stability of uncultivated soils has occurred due to inappropriate tillage practices causing soil inversion and the rapid breakdown of soil organic matter [Citation38]. Intense tillage disrupts soil structure to expose soil organic matter encapsulated in macro-aggregates [Citation27]. The conventional tillage accelerates oxidation of soil organic matter by soil microbes due to change in moisture and aeration status influencing soil microbes and microbial activity [Citation39]. It impacts TOC pool when the undisturbed lands are converted to arable agriculture under intense tillage [Citation40].
The WEOC is composed mainly of organic acids and soluble carbohydrates and plays an important role in both natural undisturbed and changed ecosystems as a substrate for micro-organisms [Citation41]. The lower concentration of WEOC in soils under cotton–wheat cropping system due to the lower inputs of organic matter and higher microbial decomposition of soluble organic C as compared to rice–wheat and uncultivated soils [Citation3,Citation15]. Higher concentration of water soluble C in rice–wheat soils was attributed to the reduced rate of oxidation of C in these soils because of flooding for paddy cultivation [Citation15]. As a consequence of the anaerobic conditions, organic C substrates decompose at much slower rate than in aerobic conditions, and dissimilarity between the root exudates in different crop species and quality and quantity of C inputs into the soil [Citation5].
The concentration of C pools varied significantly in the cultivated and the uncultivated soils under different cropping due to differential organic substrates availability in soils. The labile C pool (Fract. 1 and Fract. 2) composed of organic C which is easily decomposable plant materials [Citation27]. The Fract. 1 and Fract. 2 are strongly affected by microbial activity of soil owing to higher solubility and fast migration rates [Citation19]. A relatively lower stability of these labile C fractions makes them easily oxidizable and causes rapid mineralization in the soil [Citation42]. Conversely, the stable C pool (Fract. 3 and Fract. 4) has been the most resistant pool towards microbial degradation among the four C fractions [Citation12]. In the uncultivated and cultivated soils under different cropping systems, the recalcitrant C (Fract. 4) comprised the largest fraction; similar to that reported earlier [Citation14,Citation18]. There occurs a rapid conversion of organic inputs and labile C to stable forms with longer persistence under favorable conditions of moisture, root biomass and minimum soil disturbance.
CMI
The CMI provides an integrated measure of quantity and quality of C [Citation28]. Unlike a single measure of TOC, CMI could be used as a more sensitive indicator of the rate of change of C in response to soil management changes [Citation18]. CMI has been suggested as a useful measure describing soil fertility, which lays foundation for improved productivity of different land use systems with suitable soil management practices [Citation28,Citation43]. In the present study, CMI was highest in soils under rice–wheat than the soils under cotton–wheat cropping system (), not only due to increased formation of soil organic matter as a consequence of the increase in annual C addition through above-and below-ground biomass [Citation3,Citation12], but also due to formation of stable C pool with less decomposition under anaerobic conditions [Citation43]. Increased CMI values for soils under rice–wheat cropping system indicate improvement in soil organic matter quality due to change in C lability [Citation43] and accumulation of lignin-derived substances in rice soils. Nevertheless, rice–wheat systems provided a less oxidative environment, and greater physical protection to the soil organic matter [Citation3,Citation28].
Soil microbial and enzymatic activity
Soil management regimes in different cropping systems significantly affected the soil microbial and enzymatic activity. Soil MBC is considered as a major component of soils’ labile C pool that regulates the transformations and storage of plant available nutrients. Soil respiration is considered critical for C exchange within ecosystem and may therefore, determine whether a system is a source or sink for C [Citation3,Citation44]. Soil C in light fraction remains associated with BSR and soil MBC [Citation44]. These microbial parameters indicate how efficiently the microbial biomass utilizes substrate C for biosynthesis, rather than for the maintenance of soil respiration [Citation44]. Schnurer [Citation45] reported that qCO2 has been a sensitive indicator for estimating the influence of cultivation on soils’ biological activity and substrate quality. These results showed a high qCO2 values for the cultivated soils under different cropping systems with regular fertilizers application. Higher C mineralization rates for the soils under conservation tillage due to increased availability of easily decomposable C leads to enhanced nutrients availability in addition to increased TOC [Citation46,Citation47]. The lower BSR for the uncultivated and the cultivated soils under cotton–wheat cropping system indicates reduced root respiration rates which are associated with a lower nutrient, labile C and C stability in the cultivated soils [Citation48]. The higher qM for the uncultivated compared to the cultivated soils showed increased microbial activity. Because of increased nutrient availability and labile C in vicinity of rhizosphere and decomposition of older soil organic matter, CO2 produced from soil organic matter in cultivated soil was higher than the uncultivated or fallow soils.
Soil organic C plays a key role as a precursor for enzyme synthesis via increased microbial activity [Citation14]. Soil MBC acts as a substrate for soil enzyme activity during mineralization process and help in physical stabilization of C [Citation49]. Change in organic C was reflected due to change in soil extracellular enzyme (DHA and Alk-P) activity. Increased supply of C to the soil enhances microbial activity leading to increased concentration of extracellular enzymes [Citation50]. Indeed soil organic matter decomposition depends on microbial activity of soil and enzymatic activity, which determines the release and availability of soil nutrients [Citation51]. Therefore, change in soil enzyme activity (DHA and Alk-P) are assured indicators of change in soil fertility being influenced by the mineralization process and the supply of nutrients.
Relationship between soil properties, C pools and enzymatic activity
The correlation analysis showed that most C pools were significantly correlated with each other. It thus indicates that the labile and stable C pools were sensitive indicator of change in TOC [Citation18]. These C pools have been widely used as good indicators for soil quality assessment, because of their sensitivity to soil management, environmental conditions and consistent response in relation to TOC change [Citation52]. Labile C fractions are considered as energy source for soil micro-organisms, and impacts soil microbial activity. Therefore, a strong relationship among labile C fractions was well expected. The MBC triggers soil microbial activity, which was exhibited by its significant correlation with BSR [Citation46,Citation47].
The weightage of selected soil properties derived from ratio of percent variation by PCs and percent cumulative variation determined which PC they belong to. In the factorial space, the data points for soils under rice–wheat cropping system were distinct apart from the soils under cotton–wheat cropping and the undisturbed soils . The PCA distinct two most influential variables in each PC (PC1: BSR and Fract. 2; PC2: qmic and qM) separated based on factor loading appeared potential indicators of soil quality . The BSR has been considered as a sensitive indicator of soil quality, and has been considered a valid biomarker to reflect changes in soil microbial activity in response to a change in soil management, agronomic practices and climates [Citation47]. The Fract. 2 being the labile C fraction with rapid turnover rates and composed of an array of molecules in a soluble phase, are consumed by micro-organisms to increase the soil microbial biomass [Citation53]. Therefore, labile C provides the readily available and additional mineralized and hydrolysable C resulting in higher microbial activity [Citation54,Citation55]. This has been reflected by appearance of qmic and qM (in PC2) as most influential indicators to play a major role in initial phases of decomposition of organic C compounds [Citation56,Citation57]. These microbial quotients are influenced by management practices and system perturbations [Citation18,Citation27], and are potential indicators to store and recycle nutrients and energy substrate [Citation10].
Conclusions
These results indicated that soil C pools and biological properties are capable of reflecting the underlying mechanism governing the impact of land use change from the uncultivated to intensively cultivated soils under rice–wheat and cotton–wheat cropping system. The soil C pools and biological properties are inter-related and are useful indicators to reflect a change in TOC. These results showed higher C stabilization in soils under rice–wheat, compared with the cotton–wheat cropping system. The stable C pool of ∼68.5% of TOC in soils under rice–wheat cropping system was nearly the same to that for the uncultivated soils (∼68.8% of TOC). It showed overwhelming significance of C stabilization mechanism in soils with contrasting moisture regimes under rice–wheat cropping system, which managed to maintain soil organic matter quality similar to that under the naturally undisturbed system. The rice–wheat cropping system with C rehabilitation has proved to be more productive in maintaining the soil quality in south-western Punjab (India) with poor quality underground water. Thus, soil C pools and biological properties are better discriminators among cropping systems, and are promising tool for monitoring strategies of land use change to different cropping systems.
Acknowledgments
Thanks are due to the Head, Department of Soil Science, Punjab Agricultural University for providing necessary laboratory and field facilities. This research did not receive any specific funding.
Disclosure statement
No potential conflict of interest was reported by the authors.
References
- Yi C, Yan WC, Guo SJ, et al. Emission and fixation of CO2 from soil system as influenced by long-term application of organic manure in paddy soils. Agric Sci Chin. 2006;5:456–461.
- IPCC, 2001. Intergovernmental panel on climate change, 2001. Climate Change. Cambridge, UK: The Scientific Basis. Cambridge University Press.
- Singh P, Benbi DK. Nutrient management impacts on net ecosystem carbon budget and energy flow nexus in intensively cultivated cropland ecosystems of north-western India. Paddy Water Environ. 2020;18(4):697–715. doi:10.1007/s10333-020-00812-9
- Singh P, Singh G, Sodhi GPS. Energy and carbon footprints of wheat establishment following different rice residue management strategies vis-à-vis conventional tillage coupled with rice residue burning in north-western India. Energy. 2020;200:117554.
- Sainju UM, Lenssen A, Caesar-Thonthat T, et al. Dryland plant biomass and soil carbon and nitrogen fractions on transient land as influenced by tillage and crop rotation. Soil Till Res. 2007;93(2):452–461. doi:10.1016/j.still.2006.06.003
- Singh P, Benbi DK. Modeling soil organic carbon with DNDC and Roth C models in different wheat based cropping systems in north-western India. Commun Soil Sci Plant Anal. 2020;51(9):1184–1203. doi:10.1080/00103624.2020.1751850.
- Lal R. Soil carbon sequestration to mitigate climate change. Geoderma. 2004;123(1-2):1–22.
- Doran JW, Zeiss MR. Soil health and sustainability: managing the biotic component of soil quality. Appl Soil Ecol. 2000;15(1):3–11. doi:10.1016/S0929-1393(00)00067-6.
- Beheshti A, Raiesi F, Golchin A. Soil properties, C fractions and their dynamics in land use conversion from native forests to croplands in northern Iran. Agric Ecosyst Environ. 2012;148:121–133. doi:10.1016/j.agee.2011.12.001.
- Gregorich EG, Carter MR, Angers DA, et al. Towards a minimum data set to assess soil organic matter quality in agricultural soils. Can J Soil Sci. 1994;74(4):367–385.
- Adak T, Sachan RS. Effect of co-inoculation of Sinorhizobium meliloti and Bacillus megaterium on yield and nutrient uptake of fenugreek (Trigonella foenum-graecum L.) in Mollisol soil. J Med Arc Pl Sci. 2009;31:124–130.
- Sharma S, Vashisht M, Singh Y, et al. Soil carbon pools and enzyme activities in aggregate size fractions after seven years of conservation agriculture in a rice–wheat system. Crop Pasture Sci. 2019;70(6):473–485. doi:10.1071/CP19013.
- Baum C, Leinweber P, Schlichting A. Effects of chemical conditions in re-wetted peats temporal variation in microbial biomass and acid phosphatase activity within the growing season. Appl Soil Ecol. 2003;22(2):167–174. doi:10.1016/S0929-1393(02)00129-4.
- Benbi DK, Brar K, Toor AS, et al. Total and labile pools of soil organic carbon in cultivated and undisturbed soils in northern India. Geoderma. 2015;237–238:149–158.
- Benbi DK, Brar K, Toor AS, et al. Soil carbon pools under poplar based agroforestry, rice-wheat, and maize-wheat cropping systems in semi-arid India. Nutr Cycl Agroecosyst. 2012;92(1):107–118. doi:10.1007/s10705-011-9475-8.
- Li XG, Li YK, Li FM, et al. Changes in soil organic carbon, nutrients and aggregation after conversion of native desert soil into irrigated arable land. Soil Till Res. 2009;104(2):263–269. doi:10.1016/j.still.2009.03.002.
- Notaro K, de Medeiros EV, Duda GP, et al. Agroforestry systems, nutrients in litter and microbial activity in soils cultivated with coffee at high altitude. Sci Agric. 2014;71(2):87–95.
- Singh P, Benbi DK. Nutrient management effects on organic carbon pools in a sandy loam soil under rice-wheat cropping. Arc Agron Soil Sci. 2018;64(13):1879–1891. doi:10.1080/03650340.2018.1465564.
- Chan KY, Bowman A, Oates A. Oxidizible organic carbon fractions and soil quality changes in oxicpaleustalf under different pasture leys. Soil Sci. 2001;166:61–67.
- Ruf A, Beck L, Dreher P, et al. A biological classification concept for the assessment of soil quality: “biological soil classification scheme” (BBSK). Agric Ecosyst Environ. 2003;98(1-3):263–271. doi:10.1016/S0167-8809(03)00086-0.
- Watt M, Kirkegaard JA, Passioura JB. Rhizosphere biology and crop productivity: a review. Soil Res. 2006;44(4):299–317. doi:10.1071/SR05142.
- CGWB. Ministry of Water Resources, River Development and Ganga Rejuvenation Government of India Report on ‘Aquifer Mapping and Management Plan’, Mansa District, Punjab. 2020; [cited 2020 Mar 30]. http://cgwb.gov.in/AQM/Punjab%20%20Report.html.
- Singh G, Singh P, Sodhi GPS. Status of crop management practices for rice and basmati cultivation in south-western Punjab. J Commun Mobil Sustain Develop. 2018;13:457–462.
- Singh P, Singh G, Sodhi GPS. Energy auditing and optimization approach for improving energy efficiency of rice cultivation in south-western Punjab. Energy. 2019;174:179–269.
- Singh P, Singh G, Sodhi GPS. Applying DEA optimization approach for energy auditing in wheat cultivation under rice-wheat and cotton-wheat cropping systems in north-western India. Energy. 2019;181:18–28.
- Snyder JD, Trofymow JA. A rapid accurate wet oxidation diffusion procedure for determining organic and inorganic carbon in pot and soil samples. Commun Soil Sci Plant Anal. 1984;15(5):587–597. doi:10.1080/00103628409367499.
- Singh P, Benbi DK. Soil organic carbon pool changes in relation to slope position and land-use in Indian Lower Himalayas. Catena. 2018;166:171–180.
- Blair GJ, Lefroy RDB, Lisle L. Soil carbon fractions, based on their degree of oxidation, and the development of a carbon management index for agricultural systems. Aust J Agric Res. 1995;46(7):1459–1466. doi:10.1071/AR9951459.
- Vance ED, Brookes PC, Jenkinson DS. An extraction method for measuring soil microbial biomass C. Soil Biol Biochem. 1987;19(6):703–707. doi:10.1016/0038-0717(87)90052-6.
- Tabatabai M, Bremner J. Use of p-nitrophenyl phosphate for assay of soil phosphatase activity. Soil Biol Biochem. 1969;1(4):301–307. doi:10.1016/0038-0717(69)90012-1.
- Casida L, Klein D, Santoro T. Soil dehydrogenase activity. Soil Sci. 1964;98:371–376.
- Choudhary OP, Bhalla M, Sharma S, et al. Long-term impact of cyclic use of sodic and canal water for irrigation on soil quality and wheat yield in cotton-wheat cropping system. J Indian Soc Soil Sci. 2019;67(1):34–43. doi:10.5958/0974-0228.2019.00004.5.
- Aulakh M, Pasricha N, Bahl G. Phosphorus fertilizer response in an irrigated soybean–wheat production system on a subtropical, semiarid soil. Field Crops Res. 2003;80(2):99–109. doi:10.1016/S0378-4290(02)00172-7.
- Singh P, Singh H. Phosphate sorption characteristics of some floodplain calcareous and non-calcareous soils of Punjab. J Res. 2007;44:283–288.
- Hargopal-Singh Singh P, Bahl GS. Phosphorus supplying capacity of pressmud amended recent floodplain soils under different moisture regimes. J Ind Soc Soil Sci. 2010;58:168–181.
- Somasundaram J, Singh RK, Parandiyal AK, et al. Micronutrient status of soils under different land use systems in Chambal ravines. J Ind Soc Soil Sci. 2009; 57:307–312.
- Neha BB, Sharma S. Seasonal variation of rhizospheric soil properties under different land use systems at lower Shivalik foothills of Punjab, India. Agro Syst. 2020. doi:10.1007/s10457-020-00512-7..
- Balesdent J, Chenu C, Balabane M. Relationship of soil organic matter dynamics to physical protection and tillage. Soil Till Res. 2000;53(3-4):215–230. doi:10.1016/S0167-1987(99)00107-5.
- Doran JW, Smith MS. Organic matter management and utilization of soil and fertilizer nutrients. In: Follett RF, Stewart JEB, Cole CV, editors. Soil fertility and organic matter as critical components of production systems. Adison, WI: American Society of Agronomy; 1987. p. 53–72.
- Saviozzi A, Levi-Minzi R, Riffaldi R. The effect of forty years of continuous corn cropping on soil organic matter characteristics. Plant Soil. 1994;160(1):139–145. doi:10.1007/BF00150355.
- Davidson EA, Galloway LF, Strand MK. Assessing available carbon: comparison of techniques across selected forest soil. Comm Soil Sci Plant Anal. 1987;18(1):45–64. doi:10.1080/00103628709367802.
- Mandal B, Majumder B, Adhya TK, et al. Potential of double-cropped rice ecology to conserve organic carbon under subtropical climate. Glob Chang Biol. 2008;14:1–13.
- Tirol-Padre A, Ladha JK. Assessing the reliability of permanganate-oxidizable carbon as index of soil labile carbon. Soil Sci Soc Am J. 2004;98:969–978.
- Van Hees JP, Finlay DL, et al. The carbon we do not see—the impact of low molecular weight compounds on carbon dynamics and respiration in forest soils: a review. Soil Biol Biochem. 2005;37:1–13.
- Schnurer J, Clarholm M, Rosswall T. Microbial biomass and activity in an agricultural soil with different organic matter contents. Soil Biol Biochem. 1985;17:611–618.
- Bera T, Sharma S, Thind HS, et al. Changes in soil biochemical indicators at different wheat growth stages under conservation based sustainable intensification agriculture practices of rice-wheat system. J Integ Agric. 2018;17:1871–1880.
- Saikia R, Sharma S, Thind HS, et al. Tillage and residue management practices affect soil biological indicators in a rice–wheat cropping system in north-western India. Soil Use Manage. 2020;36(1):157–172. DOI:10.1111/sum.12544
- Alvaro-Fuentes J, Lopez MV, Arrue JL, et al. Tillage and cropping effects on soil organic C in Mediterranean semiarid agroecosystems: testing the century model. Agric Ecosyst Environ. 2009;134:211–217.
- Tabatabai MA. Soil enzymes. In: Weaver RW, Angle JS, Bottomley PS, editors. Methods of soil analysis: microbiological and biochemical properties. Part 2. Madison, WI: SSSA Book Ser. 5. SSSA; 1994. p. 775–883.
- Hazarika S, Thakuria D, Ganeshamurthy AN, et al. Soil quality as influenced by land use history of orchards in humid subtropics. Catena. 2014;123:37–44.
- Tejada M, Gonzalez JL. The relationships between erodibility and erosion in a soil treated with two organic amendments. Soil Till Res. 2006;91(1-2):186–198. doi:10.1016/j.still.2005.12.003.
- Melero S, López-Garrido R, Murillo JM, et al. Conservation tillage: short- and long-term effects on soil carbon fractions and enzymatic activities under Mediterranean conditions. Soil Till Res. 2009;104(2):292–298.
- Vesterdal L, Schmidt IK, Callesen I, et al. Carbon and nitrogen in forest floor and mineral soil under six common European tree species. Fort Ecol Manage. 2008;255(1):35–48.
- Kaur T, Brar BS, Dhillon NS. Soil organic matter dynamics as affected by long-term use of organic and inorganic fertilizers under maize-wheat cropping system. Nutr Cycl Agroecosyst. 2008;81(1):59–69. doi:10.1007/s10705-007-9152-0.
- Sharma S, Singh P, Kumar S. Responses of soil carbon pools, enzymatic activity and crop yields to nitrogen and straw incorporation in a rice-wheat cropping system in north-western India. Front Sustain Food Syst. 2020. 4:532704. doi: 10.3389/fsufs.2020.532704
- Saikia R, Sharma S, Thind HS, et al. Temporal changes in biochemical indicators of soil quality in response to tillage, crop residue and green manure management in a rice-wheat system. Ecol Ind. 2019;103:383–394.
- Wickings K, Grandy AS, Reed S, et al. Management intensity alters decomposition via biological pathways. Biogeochemistry. 2011;104(1-3):365–379. doi:10.1007/s10533-010-9510-x.