
 ?Mathematical formulae have been encoded as MathML and are displayed in this HTML version using MathJax in order to improve their display. Uncheck the box to turn MathJax off. This feature requires Javascript. Click on a formula to zoom.
Abstract
The Marmara is the most highly trafficked region in Turkey in terms of seaway and highway transport congestion. The transport mode-based CO2 emissions budget for the region needs to take more environmentally friendly measures. In this study, 13 ro-ro and ferry lines (RFLs) are evaluated in the Sea of Marmara to compare ship-generated CO2 emissions with road transport as if the carried vehicles had used the highway instead of transport by RFL. Additionally, this study revealed the management strategies for CO2 emissions reduction for both transport modes under current conditions. The total CO2 emissions budget of 13 RFLs in the Sea of Marmara is higher than the potential CO2 emissions of their carried vehicles. Using the methods of Entec UK Ltd and Trozzi and Vaccaro, the amount of CO2 emissions generated by the RFLs is 204,470.99 and 170,459.85 t/year, respectively. The potential CO2 emissions of road vehicles carried in 2017, 2018 and 2019 are computed by applying Tier 1 methods as 121,690.54, 106,844.89, and 100,921.95 t/year, respectively. It is observed that shifting trucks from the highway to the seaway contributes to a reduction of the yearly CO2 emissions budget generated from the transport sector to provide sustainable transportation management in the region.
Introduction
Greenhouse gas (GHG) emissions of all energy end-use sectors have been increasing since 1970. This increase has been very steep in the transport sector, more than doubling with an 80% increased share from road vehicles [Citation1]. Ship-generated GHG emissions are mainly carbon dioxide (CO2), methane (CH4) and nitrous oxide (N2O). CO2 is the dominant contributor to global warming [Citation2]. The future emission scenarios of the IPCC show that ship-generated CO2 emissions will be higher than twice the value of the present emissions by 2050 if no measures are taken [Citation1]. GHG emissions from ships have been studied for the last two decades by the International Maritime Organization (IMO). According to a report by the IMO, ship-generated CO2 emissions as a share of total anthropogenic CO2 emissions increased from 1.8 to 2.8% between 1996 and 2007 [Citation3]. For this reason, IMO has adopted some measures over the last decade to manage the reduction of GHG emissions and fuel consumption [Citation4], which are the Energy Efficiency Design Index (EEDI), the Ship Energy Efficiency Management Plan (SEEMP), and the IMO 2020 sulfur convention [Citation5–7]. In keeping with these recommendations, ships designed to use alternative fuels support reduced emissions through decarbonization. An example of this is ships using hydrogen fuel [Citation8].
To be able to make an environmental assessment and take appropriate measures and strategies for maritime transport on a regional scale, first of all, knowledge about the current situation must be obtained [Citation9]. This study presents a comparative environmental assessment of short-sea shipping in the Sea of Marmara and road transport, the most competitive transport alternative. For this reason, the methods of Entec UK Ltd [Citation10,Citation11] and Trozzi and Vaccaro [Citation12] are applied to compute yearly CO2 emissions from 13 ro-ro and ferry lines (RFLs) in the Sea of Marmara . Also, the Tier 1 method of the European Monitoring and Evaluation Programme / European Environment Agency(EMEP/EEA) is applied to compute the hypothetical CO2 emissions of the road vehicles if the vehicles had used the highway instead of transport by RFL . Estimated CO2 emissions of road vehicles are referred to as “potential CO2 emissions.” The current study compared RFLs and highway routes in terms of distance , voyage density and carriage capacity , the results of the Entec UK Ltd and Trozzi and Vaccaro analyses , and the CO2 emissions from seaway versus highway . Based on the results of this comparative study, strategies are recommended for policymakers and service providers to provide more environmentally friendly management of RFLs in the Sea of Marmara.
Literature review
Increasing the volume of international trade affects the amount of ship-generated GHG emissions [Citation13,Citation14]. However, the shipping sector is the sole international sector that has regulations related to GHG, and these cover the whole shipping sector internationally. On the one hand, maritime transport has the lowest amount of CO2 emissions per ton of cargo/km when transport modes are compared [Citation4,Citation15–17]. Long distances and the high loading capacity in the shipping sector offer more CO2 emission advantages than other modes of transport. However, these advantages may not be relevant when applied to short-sea shipping, depending on carriage capacity, ships’ specifications and other factors [Citation18,Citation19]. A study by Liao et al. [Citation20] shows that replacing truck transport with coastal shipping provides significant reductions of CO2 emissions.
There are two main approaches in the literature to evaluating exhaust gas emissions from the maritime sector. These are bottom-up and top-down approaches [Citation21–25]. Also, there are two approaches to the integration of bottom-up and top-down approaches, as mentioned by Miola et al. [Citation24] and Miola and Ciuffo [Citation25]. The bottom-up approach is based on the fuel consumption of a ship in a specific position, while the top-down approach is based on calculations without considering the characteristics of a single vessel, which are later geographically located and assigned to different ships [Citation25]. In this study, the full bottomup approach is applied to compute the yearly amount of CO2 emissions from RFLs in the Sea of Marmara. This is because this approach provides the most reliable modelling, and detailed data of the lines and ships have been obtained for this study.
There are two main methods used to estimate exhaust gas emissions from the maritime sector, which are the methods of Entec UK Ltd [Citation10,Citation11] and Trozzi and Vaccaro [Citation12,Citation26,27]. There are studies regarding modelling and estimation of the ship-generated emissions in the Sea of Marmara and in the Strait of Istanbul applying the method of Trozzi and Vaccaro [Citation23,Citation28–30]. In the Istanbul Strait, Kesgin and Vardar [Citation28] calculated CO2 emissions of 170,491 t/year and 173,362 t/year from passenger ships and transit ships, respectively. Deniz and Durmuşoğlu [Citation23] estimated CO2 emissions from RFs in the Sea of Marmara to be 41,367 t/year considering eight ships, whereas the estimate for domestic ships was 295,072 t/year. Also, they estimated 253,705 t/year from local passenger ships and sea buses, and 297,797 t/year from transit and non-transit ships, in the Istanbul Strait. Kılıç and Deniz [Citation29] computed CO2 emissions of 254,26 t/year from the ships in Izmit Bay. Durmuşoğlu [Citation30] computed 63,573 t/year CO2 from ro-ro ships and ferries in the Sea of Marmara, based on the statistics of Istanbul Deniz Otobüsleri A.Ş. (IDO), the company owning the vessels in question.
The location and socio-economic conditions of the Sea of Marmara offer huge potential for the carriage of vehicles and passengers in short-sea shipping in Turkish cabotage [Citation31]. Shipping lines between the south and north shores of the Sea of Marmara allow for connections with the full transportation network of Turkey. A study by Resat et al. [Citation32] shows the intermodal transport optimization approach in the Sea of Marmara in terms of transportation cost and time. The north–south lines in the Sea of Marmara present a comparative advantage over their competitor transport modes in terms of both time and distance. For this reason, ship-owning and management companies generally choose to offer north–south routes with ro-ro ships and ferries (RFs). The advantages of RFs include (1) the easing of highway congestion and reduction of accident risk, (2) prevention of financial loss on amortization of road vehicles and highways, and (3) time and fuel savings of road vehicles. However, short-sea shipping may have lower environmental competitiveness compared with road transport [Citation16]. In the present study, the environmental performance of RFs in the Sea of Marmara in terms of CO2 emissions is examined, discussed and compared with road transport.
Methodology
Data collection
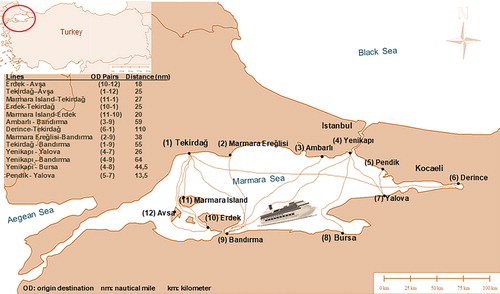
The Republic of Turkey's Ministry of Transportation and Infrastructure (MTI) issues yearly maritime statistics. They specify five regions in which vehicles are carried on domestic lines. These are Istanbul, the Marmara Basin, Çanakkale, İzmir and Lake Van. The statistical data of MTI is used for 13 RFLs [Citation33]. A map of the lines is shown in . The voyage data on RFLs in were received from the Cabotage Line RoRo and Ferry Operators Association (ROFED), IDO and GESTAŞ Deniz Ulaşım A.Ş. (GESTAŞ) (one-on-one interview). Some specifications of 30 ships on 13 RFLs were obtained from survey certificates of Turkish Lloyds [Citation34]; these included tonnage of ships, number of main engines, and power of main engines and auxiliary engines. The required data for this study are comprehensively derived and presented in [dataset] [Citation35].
Figure 1. Thirteen ro-ro and ferry lines in the Sea of Marmara.
Study area
The Marmara Region is the highest CO2 emission-producing area in Turkey [Citation36]. As a semi-enclosed sea lying between the Çanakkale and Istanbul straits, the Sea of Marmara hosts congested international shipping traffic between the Mediterranean and the Black Sea as well as domestic short-sea shipping traffic. It is also subject to the effects of urbanization and industrialization [Citation37]. It is the busiest region for RFLs in Turkey, and the comparative analysis is applied for 13 RFLs in the region. shows the shipping lines with the numbers of their origin–destination (OD) pairs in the region.
Computation of seaway advantage factor
The seaway advantage factor (SAF) shows the distance advantage of a short-sea shipping considering the potential highway distance between the origin and destination port. High SAF value indicates high distance advantage of shipping comparing with the highway. The formula for calculating SAF is defined in EquationEquation (1)(1)
(1) :
(1)
(1)
where dh is the highway distance between the origin and destination ports (km), ds is the seaway distance between the origin and destination ports (NM), and r is the km equivalent of 1 NM, which is 1.852 km/NM.
Application of the Entec method
The Entec UK Ltd method [Citation10,Citation11] is based on the bottom-up approach and is applicable to RFLs in the Sea of Marmara. Necessary data for the application of the method are (1) the type of ship, (2) the distance covered, (3) the time spent in maneuvering, (4) the time spent in port/at anchor, and (5) the type and power of the main and auxiliary engines. It is possible to estimate the amount of ship emissions during sailing, maneuvering, and port calls when these data are obtained.
This study considered that total emissions produced by RFLs in the Marmara are equal to the sum of the emissions in sailing and maneuvering. The emissions produced at the port are not factored in because the engines are shut down while in port. The calculations for the emissions produced while sailing (EquationEquation 2(2)
(2) ) and maneuvering (EquationEquation 3
(3)
(3) ) are given below:
(2)
(2)
(3)
(3)
where Enav is emissions produced during sailing, D is distance (NM), ME is main engine power (kW), AE is auxiliary engine power (kW), EFnav is the emission factor depending on the ship’s type, V is the ship’s speed (knot), Eman is the emissions produced during maneuvering, T is the ship’s maneuvering time (h), and EFman is the emission factor while maneuvering.
It is important to note that the main engine and auxiliary engine are not operated at full power during the voyage. This rate is calculated as 80% for the main engine and 30% for the auxiliary engine. These rates are given as coefficients in EquationEquation (2)(2)
(2) . While maneuvering, the main engine operating capacity decreases to 20% and the auxiliary engine's operating capacity increases to 40%. The coefficients can also be seen in EquationEquation (3)
(3)
(3) .
EquationEquations (4)(4)
(4) and Equation(5)
(5)
(5) are derived to compute CO2 emissions of RFs considering the emission factors as given by the Entec method. The equations are computed for each ship type and number of voyages on each line as given in [dataset] [Citation35].
(4)
(4)
(5)
(5)
Application of the Trozzi and Vaccaro method
This method was introduced by Trozzi and Vaccaro [Citation12] and revised in 2006 and 2010 [Citation26,Citation27]. The method offers the formulas presented in EquationEquations (6)(6)
(6) and Equation(7)
(8)
(8) , which compute the total emissions of the pollutants and fuel consumption. In this study, the method was applied to 13 RFLs in the Sea of Marmara to compare the results with the Entec method. All of the required data are given in [dataset] [Citation35].
(6)
(6)
(7)
(7)
where i is the pollutant type, j is the fuel type, k is the ship type, l is the engine type, m is the navigation mode, Eijklm is the total emissions of pollutant i from the ship's use of fuel j on ships with type l engine (kg), Sjkm is the fuel consumption (ton), tjklm is the daily navigation time (day), Fijlm is the emission factors of pollutant i for ships with engine type l using fuel type j (kg/ton), Cjkm is the daily j type fuel consumption at full power according to the ship's tonnage and ship type k (ton), and Pm is the ratio of the amount of fuel consumption at navigational mode and at full load.
Computation of potential CO2 emissions of road vehicles
In this part of the study, the CO2 emissions of the road vehicles carried by RFs in the Sea of Marmara are calculated. These are the amounts that would have been produced if the vehicles had used the highway instead of RFL. To compute and compare CO2 emissions of highway and RFL usage, this study based calculations on the highway distance between the loading and discharging RF terminals. The distance between the departure and destination coordinates was obtained from a highway navigation application. The distances of the RFL lines, including those to Marmara Island and Avşa Island, have been converted from nautical miles (NM) to kilometers (km). They are based on the highway distance supposing there were a bridge that spanned the Marmara and followed the same route as the RFL. OD numbers of the Island lines are (1-12), (10-12), (11-1), (11-10) (see ). Computing these lines as the crow flies is not feasible, as the ships do not travel in a straight line between ports.
Several models can be used to compute the road vehicles' generated emissions. The most common and consistent mathematical models are based on emission factors [Citation38–Citation42]. One of these models, the Tier 1 method proposed by EMEP/EEA [Citation38], is used in this study.
Tier emission calculation methods are divided into various levels according to their activity and technological features. Tier 1 is a method that requires less data compared to the Tier 2 method. It is necessary to know the fuel consumption statistics for each fuel type according to four vehicle categories to apply the Tier 1 method. In the Tier 2 method, vehicle categories used in Tier 1 are divided into different technology subclasses according to emission control laws. Tier 3 is a more complex method yet. In the Tier 3 method, a combination of activity data including precise technical data such as emission factors is used.
The Tier 1 method is specifically designed to provide a rough CO2 emission computation where detailed features and combustion technology are not known. In this method emission factors are based on fuel consumption for different vehicle types. The emission factors are proposed by the EMEP/EEA Guidebook [Citation38]. The emission factors from the EMEP/EEA Guidebook are multiplied by the fuel consumption values. The method is applied for each vehicle type carried in the RFLs per km per vehicle. Vehicle types carried in RFLs are grouped as classified in the Tier 1 method: passenger cars, light commercial vehicles (LCVs), heavy-duty vehicles (HDVs) and two-wheel vehicles (L-category). The fuels to be considered include petrol, diesel, liquefied petroleum gas (LPG) and compressed natural gas (CNG) or liquefied natural gas (LNG). Each line carries different percentages of vehicle types. The total emission values are found as in EquationEquation (8):(8)
(8)
(8)
(8)
where Ei is the emission frompollutant i (g), FCj,m is the fuel consumption for a vehicle in category j and using fuel m (kg), and EFi,j,m is the fuel consumption of the pollutant i for the vehicle of category j and using fuel m (g/kg). In this study, Tier 1 typical fuel consumption per km for each vehicle category and Tier 1 emission factors [Citation38] for CO2 were calculated considering [dataset] [Citation35].
The percentage distribution of the vehicle types carried in the 13 RFLs is calculated based on information from ROFED. The vehicles that are carried are predominantly or entirely HDVs for the lines whose OD pairs are (1-9), (2-9), (3-9) and (10-1) (see ). Island lines generally carry passenger cars in summer, but in the winter the rate of truck carriage increases. The line (6-1) carries railway wagons. The other lines generally carry passenger cars. The percentages of fuel types are estimated for passenger cars in accordance with the Turkish Statistical Institute [ Citation43] as follows: LPG (39%), diesel (33.8%), gasoline (26.7%), and other fuels (0.5%).
Results and discussion
Comparing the seaway and highway route in terms of distance
RFLs offer several advantages for road vehicles, as mentioned in the Literature review section. The distance factor is one of the important advantages when using the different ro-ro lines [Citation18]. The current study defined the SAF, which shows the distance benefit of these lines. As shown in , seaway line distances compared with the highway distances between the loading and discharging ports and line-based SAFs were obtained. The results show a high SAF for the north–south lines across the Sea of Marmara.
Figure 2. Highway and seaway distance and seaway advantage factors of nine ro-ro and ferry lines in the Sea of Marmara.
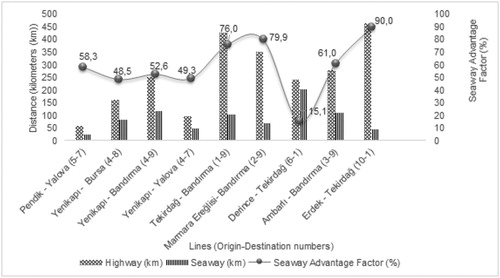
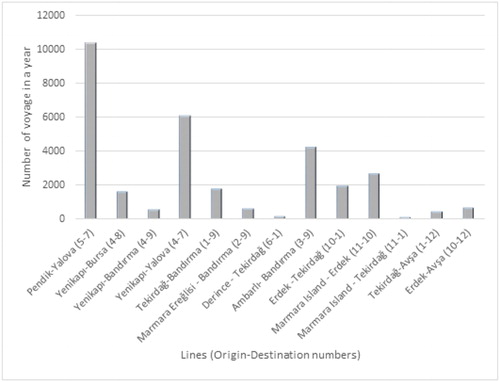
Figure 3. Number of voyages of thirteen ro-ro and ferry lines in the Sea of Marmara in a year.
The SAF is important for RF management companies to evaluate competitiveness and benefits to customers as well as environmental impact. shows that the SAFs of the lines (1-9), (2-9), (10-1) and (5-7) are higher. Only the (6-1) line offers a SAF that is lower than 50%. As shown in , the line (6-1) is 110 NM and covers the greatest east–west distance compared to the other lines. It might be considered to be less competitive than the others. However, this line is targeted at a specific cargo: it carries railway wagons, and consequently the line offers more benefits compared to the carriage of the wagons by a trailer truck. This is because of a reduction in the highway traffic and accident risks, and the connection of multimodal transportation between Europe and Asia. Full details of the types of vehicles carried in RFLs as well as SAF values allow a comprehensive assessment of the line’s competitiveness and advantages. The types of vehicles carried and SAFs are also important when comparing the emission amounts for highways versus seaways in this study.
Comparing the RFLs in terms of voyage density and carriage capacity
The busiest lines in the Sea of Marmara are the lines (3-9), (4-7), and (5-7), as can be seen in and Citation4. Considering the high number of voyages and vehicles carried, the high rate of HDV carried, and the high value of SAF of the line (3-9), the line plays an important role in the reduction of truck traffic on highways around the Sea of Marmara and beyond.
Considering the data of , five lines in the Sea of Marmara offer a high vehicle carriage capacity and are in high demand. Although the lines (1-9), (2-9), and (10-1) have a low number of carried vehicles, their SAF value is higher than those of the other lines (see ), and the vehicle type carried is predominantly HDV. Consequently, investments in RFL in these regions especially contribute to the reduction of truck traffic on highways. In light of the above environmental and economic cost–benefit analysis, the establishment of new lines in the region could increase demand potential although the lines currently have a low carriage capacity.
Figure 4. Number of vehicles carried by thirteen ro-ro and ferry lines in the Sea of Marmara in 2017, 2018, and 2019 (This figure is derived from the statistical data on [Citation33] ) .
![Figure 4. Number of vehicles carried by thirteen ro-ro and ferry lines in the Sea of Marmara in 2017, 2018, and 2019 (This figure is derived from the statistical data on [Citation33] ) .](/cms/asset/09bf8713-38e9-4034-a2c7-7f0e04633bf3/tcmt_a_1852853_f0004_b.jpg)
Comparing the CO2 emissions of RFLs and potential CO2 emissions of road vehicles carried
The yearly total CO2 emissions of the RFLs depend on certain factors, including distance, engine power, number of voyages, ship’s speed, and gross tonnage as well as the method of calculating emissions. On the one hand, levels of potential CO2 emissions of road vehicles carried depend on highway distance, the number of vehicles, vehicle type, and fuel. The results of the calculations using the Entec and Trozzi and Vaccaro methods and the potential CO2 emissions of road vehicles using alternative road transport are compared in . The line with the best record is the (3-9) compared with road vehicles' potential CO2 emissions. This is the case even though it is the line generating the second-highest level of CO2 emissions. This result arises from trucks being high-emitting vehicles, the high SAF of the line, and the large number of trucks carried in a year. This result also supports the environmental advantage of replacing the truck transport with intermodal transport as described by Liao et al. [Citation19].
Figure 5. Comparative analysis of the CO2 emission results for the ro-ro and ferry lines and highways, using the applied methods.
The lines (4-7), (4-8), (4-9) and (5-7) are served by fast ferries [Citation35] and their engine power is higher than that of the others mentioned above. The ferries of line (4-8) have the highest engine power, and this is reflected in this line’s higher amount of CO2 emissions because of high speed and high engine power.
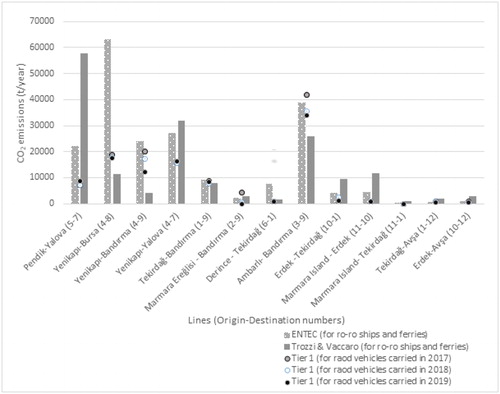
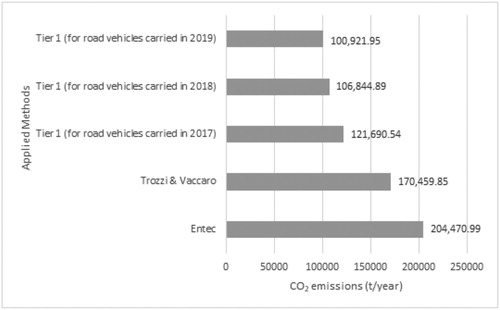
In the quantity of CO2 emissions from 13 RFLs in the Sea of Marmara, and the potential CO2 emissions from the road vehicles, were they to be carried by the RFLs, are compared. The total CO2 emission amount from the RFLs in the Sea of Marmara is computed as 204,470.99 t/year by applying the Entec method and 170,459.85 t/year by applying the Trozzi and Vaccaro method. The difference in numbers arises because there are a greater number of emission factors in the Entec method than in the Trozzi and Vaccaro method. Additionally, there are some differences between these methods in terms of their application. For example, time is a parameter for the Trozzi and Vaccaro method (measured in days), but the Entec method does not use it as a parameter. A second difference is that engine information must be known for the Entec method, but it is not necessary for the Trozzi and Vaccaro method.
Figure 6. Total CO2 emission computation by the methods of Entec and Trozzi and Vaccaro for the thirteen ro-ro and ferry lines in the Sea of Marmara in a year, and the hypothetical CO2 emissions for road vehicles carried by the ro-ro and ferry lines .
Previous studies in the region computed CO2 emissions by the Trozzi and Vaccaro method, as mentioned in the literature review section. These studies were not specific to the RFLs and aimed to compute the emissions of ships in the region in general. Also, they give details about computation of CO2 emissions for RFs. Deniz and Durmuşoğlu [Citation23] estimated CO2 emissions of 41,367 t/year in the Sea of Marmara considering eight ships, and Durmuşoğlu [Citation30] estimated CO2 emissions of 63,573 t/year in the Sea of Marmara and in the Strait of Istanbul considering IDO statistics. The current study provides estimates for 13 RFLs involving 30 RFs in the Sea of Marmara, and thus is the first study to compute CO2 emissions for each of the RFLs in the region. Consequently, the CO2 emissions of 170,459.85 t/year estimated here by applying the Trozzi and Vaccaro method are considerably higher than the estimates of Deniz and Durmuşoğlu [Citation23] and Durmuşoğlu [Citation30].
In the hypothetical scenario in which the road vehicles carried on RFLs had instead used the highway, the total potential CO2 emissions of these road vehicles in 2017, 2018, and 2019 are calculated as 121,690.54, 106,844.89, 100,921.95 t/year, respectively (see ).
Although the yearly CO2 emissions budget of the RFLs in the Sea of Marmara is higher than the potential CO2 emissions of road vehicles carried, seaway transport is more environmentally friendly for some of the lines. These results show that the comparative environmental advantages of sea transport are not present in RFLs. When compared with a bulk carrier, these advantages could be considerably reduced and even disappear due to RFLs' smaller cargo capacity and high speed [Citation18]. For this reason, when focusing on providing a more environmentally friendly mode of transport, line-based emission estimation is highly significant for the evaluation and optimization of RFLs in the Sea of Marmara. In light of the above, this study suggests that the category of vehicles carried, the SAF value, and the ship’s engine power should be carefully evaluated for the economic and environmentally sustainable management of the lines in the Sea of Marmara. Investment in environmentally optimized lines is of great importance for sustainability in the Sea of Marmara. Shifting the road freight transport there from the highway to RFLs can contribute to the reduction of yearly CO2 emissions from the transport sector as well as the reduction of highway congestion.
The level of CO2 emissions in the Sea of Marmara is important since the region is the most urbanized region in Turkey and is the region producing the highest level of CO2. Consequently, providing more environmentally friendly approaches to the management of domestic lines in the Sea of Marmara will contribute to environmental sustainability.
The development of cleaner alternative energies, planned for use by newly built ships, will contribute much more to the reduction of CO2 emissions in the future [ Citation44,Citation45]. Short-distance sea transport could take the first steps to decarbonization through the adoption of these technologies [Citation16], and the application of these technologies for RFs in the Marmara will create significant emissions advantages in the future. In addition, other recommendations and management strategies for reducing CO2 emissions in short-sea transport are given in .
Table 1. Recommendations and management strategies for reducing carbon dioxide emissions generated from short-sea shipping.
Conclusion
The Marmara region is the most highly trafficked region in Turkey, and the geographical location of the Sea of Marmara leads to a high level of domestic short-sea shipping as well as international shipping. The RFLs in the Sea of Marmara support multimodal transportation and the flow of domestic and international transportation of road vehicles between Europe and Asia. Considering the increased CO2 emissions share of the transport sector, current and new investments for RFLs should be evaluated environmentally as well as in terms of economic cost–benefit analysis. Environmentally friendly measures should be taken by policymakers, ship owners, and service providers to provide lower CO2 emissions and greater sustainability. Within this scope, the approach of our study can be implemented in the other regions to compare CO2 emissions generated from highways versus seaways and to develop CO2 emissions mitigation strategies for the current situation. In view of the above, this study emphasizes the following points for the RFLs in the Sea of Marmara:
Although maritime transport in general produces the lowest CO2 emissions per ton of cargo/km compared to other modes of transport, CO2 emissions from short-sea transport are subject to different factors and thus can be higher than those from highway transport. Consequently, CO2 emissions generated from short-sea shipping should be computed and evaluated for each line and each region.
SAF is an important factor in the management of any RFL worldwide. The north–south lines in the Sea of Marmara, which have a high SAF value, offer many advantages in terms of distance, time, decrease of highway traffic, fuel savings, and reduction of emissions.
The carriage of HDV by seaway in the Sea of Marmara can contribute significant CO2 reductions depending on SAF. This is because they minimize the generation of potential CO2 emissions from the highways.
Fast-car ferries cause far more CO2 emissions in the Sea of Marmara and higher CO2 emissions than the same cars cause while using the highway. This is due to the ferries' high engine power. However, these ferry lines are beneficial and preferable especially for passenger cars in terms of reduction of distance and time, and these lines are necessary due to the sheer demand for them. Therefore, a line optimization cost–benefit analysis is important for the ship owners/service providers and their customers.
As a form of short-sea transport, the service functionality of RFLs in the Sea of Marmara is higher than their environmental functionality, as is the case for other RFLs in the world. Consequently, the application of cleaner alternative energy to newly built ro-ro ships and ferries is necessary due to the high emissions that result from short-sea transport.
SAF, vehicle type, ships’ engine type and power, fuel consumption, generated emissions, and potential emissions from alternatives are factors that should be considered when evaluating an RFL in a region to provide optimum benefit for service providers, their customers, and the environment.
Supplemental Material
Download MS Excel (14.6 KB)Acknowledgements
With special thanks to Mr Atılay ÖZAY from ROFED and Captain Raşit ALTINOK from Gate Shipping for their support on sectoral information about ro-ro ships, ferries, and lines. We also thank The Republic of Turkey's Ministry of Transportation and Infrastructure and Turkish Lloyd for the open data sources and GESTAŞ and IDO for their valuable information sharing.
Disclosure statement
No potential competing interest was reported by the authors.
Data availability statement
The data that support the findings of this study are openly available in [figshare] at [https://doi.org/10.6084/m9.figshare.12644192.v1].
Funding
This research did not receive any specific grant from funding agencies in the public, commercial, or not-for-profit sectors.
Correction Statement
This article has been republished with minor changes. These changes do not impact the academic content of the article.
References
- Sims R, Schaeffer R, Creutzig F, et al. Transport. In: Edenhofer O, Pichs-Madruga R, Sokona Y, Farahani E, Kadner S, Seyboth K, Adler A, Baum I, Brunner S, Eickemeier P, editors, Transport. Cambridge: IPCC; 2014. p. 599–670.
- Winnes H, Styhre L, Fridell E. Reducing GHG emissions from ships in port areas. Res Transp Bus Manag. 2015;17:73–82. Available from: doi:10.1016/j.rtbm.2015.10.008.
- IMO. Consideration of how to progress the matter of reduction of GHG emissions from ships. Available from: http://www.imo.org/en/OurWork/Environment/PollutionPrevention/AirPollution/Documents/ISWG-GHG%201-2.pdf.
- Suner M, Yalcin E. Ship emissions and human health relationship: a theoretical and numerical investigation in Asyaport. In: Karakoç T, Colpan CŞY, editor. Advances in sustainable aviation. Cham: Springer; 2018. p. 205–219.
- IMO. Resolution MEPC.203(62), Amendments to the annex of the protocol of 1997 to amend the international convention for the prevention of pollution from ships, 1973, as modified by the protocol of 1978 relating thereto (Inclusion of regulations on energy effic. London; 2011. Available from: https://wwwcdn.imo.org/localresources/en/KnowledgeCentre/IndexofIMOResolutions/MEPCDocuments/MEPC.203(62).pdf.
- IMO. Resolution MEPC.212(63) Guidelines on the method of calculation of the attained energy efficiency design index (EEDI) for new ships. 2012. Available from: https://www.imo.org/en/KnowledgeCentre/IndexofIMOResolutions/Marine-Environment-Protection-Committee-(MEPC)/Documents/MEPC.212(63).pdf.
- IMO. Guidelines for the development of a ship energy efficiency management plan (SEEMP). 2018. https://www.irclass.org/media/3810/guidelines-imo-dcs-and-development-of-seemp-part-ii-aug-2018.pdf.
- Yalcin E, Suner M. The changing role of diesel oil-gasoil-LPG and hydrogen based fuels in human health risk: A numerical investigation in ferry ship operations. Int J Hydrogen Energy. 2020;45(5):3660–3669. Available from: doi:10.1016/j.ijhydene.2019.02.238.
- Misra A, Panchabikesan K, Gowrishankar SK, et al. GHG emission accounting and mitigation strategies to reduce the carbon footprint in conventional port activities–a case of the Port of Chennai. Carbon Manag. 2017;8(1):45–56. doi:10.1080/17583004.2016.1275815.
- Ritchie A, de Jonge E, Hugi C, et al. European Commission Directorate General Environment, Service Contract on Ship Emissions: Assignment, Abatement, and Market-based Instruments. Task 2c–SO2 Abatement, Entec UK Limited, Cheshire, Northwich, UK, 2005.
- Whall C, Cooper D, Archer K, et al. Quantification of emissions from ships associated with ship movements between ports in the European Community. Rep. Eur. Comm. Entec UK Limited, Northwich, Gt. Britain. 2002.
- Trozzi C, Vaccaro R. Methodologies for estimating air pollutant emissions from transport. European Commission; 1998. Available from: https://trimis.ec.europa.eu/sites/default/files/project/documents/meet.pdf.
- Bayırhan İ, Mersin K, Aydın T, et al. Modelling of ship originated exhaust gas emissions in the Strait of Istanbul (Bosphorus). Int J Environ Geoinform. 2019;6(3):238–243.
- Gemechu ED, Butnar I, Llop M, et al. CO2 emissions flow due to international trade: multi-regional input–output approach for Spain. Greenh Gas Meas Manag. 2014;4(2–4):201–214. doi:10.1080/20430779.2015.1022092.
- Mersin K, Bayirhan İ, Gazioglu C. Review of CO2 emission and reducing methods in maritime transportation. Therm Sci. 2019;23(Suppl 6):2073–2079. doi:10.2298/TSCI190722372M.
- Chapman L. Transport and climate change: a review. J Transp Geogr. 2007;15(5):354–367. doi:10.1016/j.jtrangeo.2006.11.008.
- Hjelle HM, Fridell E. When is short sea shipping environmentally competitive? In Environmental health - Emerging issues and practice. London: InTech Open; 2012. p. 3–20.
- Svindland M, Hjelle HM. The comparative CO2 efficiency of short sea container transport. Transp Res Part D Transp Environ. 2019;77:11–20. doi:10.1016/j.trd.2019.08.025.
- Hjelle HM. The double load factor problem of Ro-Ro shipping. Marit Policy Manag. 2011;38(3):235–249. doi:10.1080/03088839.2011.572697.
- Liao CH, Tseng PH, Lu CS. Comparing carbon dioxide emissions of trucking and intermodal container transport in Taiwan. Transp Res Part D Transp Environ. 2009;14(7):493–496. Available from: doi:10.1016/j.trd.2009.05.002.
- Berechman J, Tseng P-H. Estimating the environmental costs of port related emissions: the case of Kaohsiung. Transp Res Part D Transp Environ. 2012;17(1):35–38. doi:10.1016/j.trd.2011.09.009.
- Dragović B, Tzannatos E, Tselentis V, et al. Ship emissions and their externalities in cruise ports. Transp Res Part D Transp Environ. 2018;61:289–300. doi:10.1016/j.trd.2015.11.007.
- Deniz C, Durmuşoğlu Y. Estimating shipping emissions in the region of the Sea of Marmara, Turkey. Sci Total Environ. 2008;390(1):255–261. doi:10.1016/j.scitotenv.2007.09.033.
- Miola A, Ciuffo B, Marra M, et al. Analytical framework to regulate air emissions from maritime transport. Ispra (VA): European Union; 2010.
- Miola A, Ciuffo B. Estimating air emissions from ships: meta-analysis of modelling approaches and available data sources. Atmos Environ. 2011;45(13):2242–2251. doi:10.1016/j.atmosenv.2011.01.046.
- Trozzi C, Vaccaro R. Methodologies for estimating air pollutant emissions from ships: a 2006 update. Poster presented at 2nd Environment & Transport Conference (including 15th Transport and Air Pollution conference); 2006. p. 12–14.
- Trozzi C, Vaccaro R. Update of emission estimate methodology for maritime navigation. Techne Consult. Rep. ETC. EF. 10; 2010.
- Kesgin U, Vardar N. A study on exhaust gas emissions from ships in Turkish Straits. Atmos Environ. 2001;35(10):1863–1870. doi:10.1016/S1352-2310(00)00487-8.
- Kilic A, Deniz C. Inventory of Shipping Emissions in Izmit Gulf, Turkey. Environ Progr Sustain Energy. 2010;29(2):221–232.
- Durmusoglu Y. Damage costs of air pollution from ships in the region of the sea of Marmara. Nav. Eng. J. 2013;125(3):71–85.
- Görçün ÖF, Burak SZ. Formal safety assessment for ship traffic in the Istanbul Straits. Proced Soc Behav Sci. 2015;207:252–261. doi:10.1016/j.sbspro.2015.10.094.
- Resat HG, Turkay M. Design and operation of intermodal transportation network in the Marmara region of Turkey. Transp Res Part E Logist Transp Rev. 2015;83:16–33. doi:10.1016/j.tre.2015.08.006.
- MTI. Official Maritime Statistics of the Ministry of Transport and Infrastructure. Repub. Turkey Minist. Transp. Infrastruct; 2020. Available from: https://atlantis.udhb.gov.tr/istatistik/istatistik_yuk.aspx%0A.
- Turkish L. Turkish Lloyds Survey Status Information. Turkish Lloyds Surv. Status Inf. Off. 2020. Available from: https://tleasy.turkloydu.org/tleasy/public/srvInf/1.
- Ülker D, Bayırhan İ. 13 Ro-Ro and ferry lines in the Sea of Marmara. figshare. Dataset. 2020 doi:10.6084/m9.figshare.12644192.v1
- Can A, Atımtay AT. CO2 emission inventory for Turkey. Paper presented at 13th World Clean Air and Environment Protection Congress and Exibition, London, UK; 2004.
- Ülker D, Baltaoğlu S. Ship born oil pollution in Turkish straits sea area and MARPOL 73/78. In: Ünlü S, Alpar B, Öztürk B, editors. Oil spill along the Turkish straits sea area; accidents, environmental pollution, socio-economic impacts and protection. Istanbul: TUDAV; 2018.
- EMEP/EEA. Air Pollutant Emission Inventory Guidebook 2019; Technical Guidance To Prepare National Emission Inventories 1.A.3.b. 2019.
- EPA AVERT. Energy Resources for State and Local Governments AVERT. 2020. Available from: https://www.epa.gov/statelocalenergy/avert-web-edition.
- Nikolaou K, Basbas S, ToskasG. Air pollutant emissions and concentrations based on urban traffic modelling. Fresenius Environ Bull. 2002;11(8):494–498.
- Borrego C, AmorimJH, TchepelO, et al. Urban scale air quality modelling using detailed traffic emissions estimates. Atmos Environ. 2016;131:341–351. doi:10.1016/j.atmosenv.2016.02.017.
- IEA. CO2 emissions from fuel combustion. IEA Publ; 2019. p. 1–165. Available from: https://webstore.iea.org/download/direct/2505?fileName=CO2_Emissions_from_Fuel_Combustion_2019_Overview.pdf.
- TURKSTAT. Turkish Statistical Institute. 2019. Available from: http://www.turkstat.gov.tr/Start.do,.
- EyringV, Köhler HW, Van Aardenne J, et al. Emissions from international shipping: 1. The last 50 years. J Geophys Res. 2005;110(D17):171–182. doi:10.1029/2004JD005619.
- Eide M S, Chryssakis C, Endresen Ø. CO 2 abatement potential towards 2050 for shipping, including alternative fuels. Carbon Manage. 2013;4(3):275–289. doi:10.4155/cmt.13.27.