
 ?Mathematical formulae have been encoded as MathML and are displayed in this HTML version using MathJax in order to improve their display. Uncheck the box to turn MathJax off. This feature requires Javascript. Click on a formula to zoom.
Abstract
A study was conducted in lower Shiwaliks of Punjab, India to study the soil organic carbon (SOC) stock variation in hill, piedmont plain and alluvial plain regions of Punjab, and further to investigate the SOC variability down the slope in the lower Shiwaliks region of Punjab. The SOC fractions viz. very labile carbon, labile carbon, less labile carbon and recalcitrant were determined using standard methodologies. The total SOC stock in 0–60 cm soil depth was highest in plain region (31.81 Mg ha−1), followed by piedmont (23.43 Mg ha−1) and lowest in hill region (22.86 Mg ha−1). Whereas, the SOC concentration in surface layer was highest in foot slope (5.76 g kg−1) followed by mid slope (4.14 g kg−1) and lowest in up slope (2.32 g kg−1). Among the SOC fractions the average labile carbon content in soil samples was found in the order, hills (0.81 g kg−1) > piedmonts (0.73 g kg−1) > plains (0.50 g kg−1). The soil bulk density (Db) was higher in the plain than that of piedmont and hills. Moreover, a similar trend is observed in case of water holding capacity. Regression analysis has revealed significant relationship between Db and SOC stock at p < 0.05. Further, analysis of variance (ANOVA) at p < 0.05 has indicated significant differences among concentration of SOC and stock influenced by land use and soil depths. Thus, an understanding of the effect of physiography on SOC via such studies is important for soil quality management.
Introduction
Catastrophic effects, due to increased CO2 concentration in the atmosphere, are quite evident from weather disasters occurring across the globe. Intergovernmental panel on climate change reported that environmental security has become a serious concern all over the blue planet and has led to an increased interest in identification of the mitigation options [Citation1]. Restoration of soil C pools by minimizing land use intensity has been identified as potentially high impact and rapidly deployable option to partially counteract the atmospheric CO2 increase [Citation2–4]. Soils are considered as the largest terrestrial active sink for atmospheric carbon and have the potential to mitigate the effect of global warming [Citation5]. In surface soil, soil organic carbon (SOC) has been reported as one of the key parameters to increase agricultural productivity in semi-arid regions of India [Citation6,Citation7]. Depletion in SOC level in this region may cause threat to soil quality and agricultural growth [Citation8].
Land use system is the main cause of controlling SOC levels, as it influences the quantity and quality of litter input, decomposition rates of litter and the processes of organic matter stabilization in soils [Citation9,Citation10]. The alteration in land use from native ecosystem to cultivated ecosystem is root cause for loss of SOC [Citation11]. However, development of vegetation enhances the C sequestration on the abandoned agricultural land [Citation12,Citation13]. Similarly, the grassland soils have been identified as one of the potential sites to sequester atmospheric CO2 in the terrestrial ecosystem [Citation14,Citation15]. These soils have been reported to possess higher SOC concentration in comparison to soils under forest or agricultural lands due to continuous input of carbon from above-and below-ground plant biomass, and the minimal potential for erosion loss of SOC as compared to the cultivated soils. Apart from management practices, SOC stocks also get influenced with texture and amount of clay present in the soil, as these are key parameters for SOC protection [Citation16–18] due to interactions between SOC and reactive surfaces of clay minerals [Citation19]. In areas with large topographic variations, the SOC is reasonably predicted by terrain attributes, such as elevation, slope and curvature [Citation20,Citation21].
Due to undulating topography, water erosion is the persistent problem in the Sub montane tract of Punjab, resulting in the high soil erodibility [Citation22]. Soil erodibility is the natural capacity of soil particles to become detached or transported by the erosive agents like water, runoff, wind and mostly by rainfall [Citation23,Citation24]. Degradation of land due to anthropogenic activities, especially conversion of forest to arable land in the most fragile Shiwalik (hill) region of the lower Himalayan region, is very hasty because of soil erosion by water. Erosion of soil with SOC on a large scale leads to downstream sedimentation. Diverse land uses in this region have been reported to influence the SOC stock [Citation25]. The Indo-Gangetic Plain (IGP) with soils of Alfisols and Inceptisols, known for food security of the nation, is intensively cultivating rice-wheat and maize-wheat systems. Rice crop for its prolonged aquic environment has resulted in a different microenvironment in comparison to arable crops with varied soil organic properties and its stabilization mechanisms [Citation26]. About 55% of the organic carbon (OC) in submerged rice soils belongs to recalcitrant pools, which are not readily decomposed [Citation27] due to presence of lignins and phenolics.
For sustainable productivity and quality of soils, the complete understanding about SOC stock in terms of its quantity and quality in soils is necessary. To rejuvenate soil health, SOC stock is a big restoring parameter surveyed to adopt prioritized action for soil health management [Citation28]. Fewer studies have been reported to estimate the SOC stock in dominant physiographic regions of India, in Shiwaliks of Punjab. Thus, the present attempt is to elucidate the SOC stocks, their distribution over a range of soil depths and their relative contribution, as influenced by physiography from this region.
Materials and methods
In the present study, SOC stock was assessed in different physiographic regions in Shiwaliks of Punjab. The study area Pathankot is situated at 32°17′ North Latitude and 75°42′ East Longitude and Hoshiarpur is situated at 31°32′ North Latitude and 75°57′ East Longitude.
Study site description
Three physiographic regions i.e. hills, piedmont and plains, were selected in the present study in lower Himalaya. The study area has semi-arid to sub-humid climate. During the sampling year, the annual mean temperature of Pathankot district was 20 °C (max.) and 9 °C (min.), and the annual mean temperature of Hoshiarpur district was 21 °C (max.) and 9 °C (min.). During the sampling year, both Pathankot and Hoshiarpur districts receive heavy winds of 1075 mm and 980 mm respectively, from South-west, generally during the month of July to September and minor showers from North-east in the month of December in 2018.
The soils of the experimental sites were sandy loam. Rice-wheat (RW) and maize-wheat (MW) are the two dominant cropping systems followed in the Shiwaliks region of Punjab.
Soil sampling
Collection of soil samples from hills, piedmont and plains
Soil samples were randomly collected from the nine sites along the physiographic line in Shiwaliks region of Punjab after wheat harvest in May–July 2018.These sites were selected as these were under permanent rice-wheat system over last 20 years. Samples from each site were collected from four periodic depths viz. 0–10 cm (D1), 10–20 cm (D2), 20–40 cm (D3), 40–60 cm (D4) with the help of auger. In-situ soil bulk density was also determined using metallic cores of different dimensions. For the upper two depths, i.e. D1 and D2, metallic core of internal diameter 5 cm and height 10 cm was used and for lower depths that were D3 and D4, metallic core of internal diameter of 10 cm and height 20 cm was used at the same spot to calculate SOC stock. Soil samples were collected after clearing the land surface of the accumulated litter. These sites were selected for agricultural land use, consisted of areas without any crop cover at the time of sampling. Soil physico-chemical properties are summerized in Table 1. Soil organic carbon was measured using the method described by Walkley and Black [Citation29].
The SOC stock was calculated as follows:
Where, SOC stock is measured in Mg ha−1; d is depth of soil layer (m), Db is soil bulk density (Mg m−3) and SOC is measured in g g−1. The value of 10,000 indicates the stock for one ha of land. To assess the whole profile stock, the stock of the individual layer is summed up [Citation10].
Different oxidizable organic C fractions were determined using a gradient of oxidizing conditions, 5 and 10 mL of concentrated sulfuric acid was used instead of the 20 mL mentioned by Walkley and Black method as described by Chan [Citation30]. The oxidizable OC, extracted underneath increasing oxidizing conditions, were separated using three acid-aqueous solutions of 12 N, 18 N and 24 N of H2SO4.
On the basis of oxidizablity, SOC was categorized into following 4 fractions:
Very labile fraction (12N H2SO4): OC oxidizable under 5 mL H2SO4
Labile fraction (18N–12N H2SO4): difference between 10 mL and 5 mL H2SO4 extractable oxidizable OC
Less labile (24N–18N H2SO4): difference in oxidizible OC extracted between 20 mL and 10 mL H2SO4
Recalcitrant fraction (TOC-20 H2SO4) i.e. occluded OC resulted from difference between total organic carbon and 20 mL H2SO4 extractable OC
Total organic carbon (TOC) was determined using dry combustion method as mentioned by Ball [Citation31].
Collection of soil samples within hills
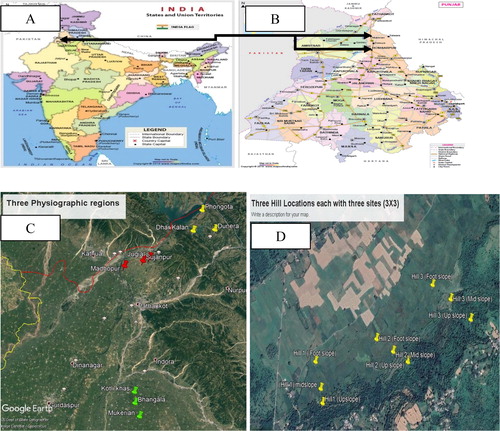
Soil samples were collected from three sites (upslope, mid-slope and foot-slope) at the selected slope transacts at four depths (D1, D2, D2 and D4) to check the variability in SOC within the hills as shown in .
Figure 1. Map of India (A), Punjab (B) along with map of study area representing three physiographic regions (C) and three hill regions with sites (D).
Statistical analysis
The SOC concentration and stock influenced by land use and soil depths were tested by analysis of variance (ANOVA) using least significant difference (LSD) of mean at p < 0.05. The regression analysis was used to assess the relationship between Db and SOC stock at p < 0.05.
Results and discussion
Soil organic carbon (SOC) and total organic carbon (TOC) content
The SOC content in surface soil (0–10 cm) was assessed in different physiographic regions. The SOC concentration in the surface soil layer was highest in the plain region (8.00 g kg−1) followed by the piedmont region (5.02 g kg−1) and lowest in the hill region (4.00 g kg−1). In comparison to hill region, plain region possessed significantly higher SOC content (50%), whereas, it was decreased by 37.25% in the piedmont region (). In sub surface (10–20 cm) soil, no significant difference was observed in hills and piedmont region while plain region differs significantly at p < 0.05. Further at the same depth (D2), it was observed that plain region differs by 47.6% from hills and 36.3% from piedmonts.
Table 2. Soil organic carbon (g kg−1) and total organic carbon (g kg−1) in relation different physiographic regions at variable soil depths in lower Shiwaliks.
The higher SOC concentration in the plain region under R-W system is attributed to submergence of rice crop in water for a prolonged period. It was further observed to be more in balanced mineral-fertilized R-W system with approximately twice the total above ground biomass production as compared to hill region under M-W system [Citation32]. Submergence induced anaerobic conditions had been reported to inhibit the rate of microbial decomposition along with generation of methane and carbon dioxide as environmental toxicants [Citation33]. Additionally, these conditions help in accumulating SOC under anaerobic conditions as compared to aerobic conditions due to less humification and incomplete microbial decomposition of organic matter that results in net accumulation of SOC under long-term rice cultivation [Citation34]. Carbon sequestering with maximum efficiency through double rice cropping system was found to be best for converting crop residues inputs into SOC stocks for sustaining long-term productivity [Citation35]. Root biomass as well as the root residues of the preceding wheat crops would face restricted decomposition due to reduced soil conditions created by rice crops. The results attributed to the low temperature condition in the month of December-January during wheat crop. Thus, the unfavorable soil moisture status will impact the later growth stage of wheat during February-April when soil temperature increases [Citation36]. These variations have resulted into higher SOC content in soil samples collected from the R-W system (Piedmont and Plain) than the M-W system (Hills).
Generally, depth-distribution of SOC has been evidenced for a reliable decreasing pattern along the profile with high variability in SOC content between all the three physiographic regions. Significant (p < 0.05) difference was observed in between surface (D1) and sub surface (D2) soil of piedmont and plain region. Similar trend was reported by Dhaliwal et al. [Citation37] under rice-wheat cropping system in alluvial soils of Punjab.
The sum of TOC content in soil samples was found to be in the order of plains (29.06 g kg−1) > piedmont (20.13 g kg−1) > hills (13.49 g kg−1) as shown in . In general, the TOC content decreased with soil depth. In surface soil (0–10 cm) and sub-surface soil (10–20 cm), no significant difference was observed under hills whereas piedmont and plain region varied significantly (p < 0.05). It was 20.5% lower in 10–20cm soil layer than in 0–10 cm layer in piedmonts followed by 19.1% in plains and lower in hills by 7.2%. However, no significant decrease was observed in TOC content in lower layers (20–40 cm and 40–60 cm) under hills while plains and piedmont region varied significantly. Saha et al. [Citation14] also observed the magnitude of TOC decline with soil depth. Because these are strongly related to root carbon inputs and other organic residues are often accumulated at the soil surface. Gu et al. [Citation38] and Sarkhot et al. [Citation39] observed that TOC losses mainly occurred in 0–10 cm top soil after conversion of forest land to arable lands because of which higher soil erosion by water on these soils could have washed the TOC from the surface layer. Under maize-wheat systems the two easily-oxidizable fractions viz., very labile carbon and labile carbon together constituted 56–60% of TOC. The rest of TOC occurred in less labile and recalcitrant fractions, which is close to 30–40% assigned to the “passive pool” of SOC in the Century Model [Citation37]. The results suggest that the organic carbon in soils under M-W system is less stable and could be easily lost through organic matter decomposition if the current land-use is discontinued.
Soil organic carbon stock
The total SOC stock in 0–60 cm soil depth was highest in plain region (31.81 Mg ha−1), followed by piedmont (23.43 Mg ha−1) and lowest in hill region (22.86 Mg ha−1) (). The plain region could store 26.33% and 28.14% higher SOC stock than piedmont and hill region, respectively.
Table 3. Soil organic carbon stock (Mg ha−1) in relation to different physiographic regions at variable soil depths in lower Shiwaliks.
The higher SOC stock was found in surface layer (D1) in all the three physiographic regions but the difference in SOC stock among the physiographic region was more prominent and the difference narrowed down in the deeper horizons. In surface layer (D1), plain region had shown higher (38.8%) SOC stock than hill region and it decreased by 27.41% in piedmont region. In sub surface (D2) soil layer, the Plain region had highest amount of SOC stock (7.99 Mg ha−1), followed by piedmont (5.75 Mg ha−1) and lowest in hill region (5.16 Mg ha−1). The lowest carbon content in hill region over the other regions might be due to the fact that hill region selected for the present study had the previous history of being under forest land, which after extensive deforestation became susceptible to soil erosion by water. Conversion of grassland and forest soils into cultivated land is always associated with a concomitant 45 and 25% decrease in SOC in surface soils, accompanied by the decrease in stability of soil particles association Saha et al. [Citation14].
The difference in SOC stock under different physiographic regions became tapered with soil depth (D1 to D4). Soil organic carbon stock decreased by 13.3% (5.95 Mg ha−1) in hills, 18.6% in piedmont (7.07 Mg ha−1) and 17.9% in plains (9.74 Mg ha−1) till 20 cm. In subsequent soil layers i.e. D3 and D4, no significant difference was observed in SOC stock in hills and piedmont, while plain region differs significantly at p < 0.05. The SOC stock declined sharply by 30.1% in hills, 36.3% and 42.6% in piedmont and plains, respectively. These findings could be endorsed with varied carbon distribution between surface and subsurface horizons and due to the plant allocation pattern of above and belowground biomass [Citation40].
Oxidizable organic carbon fractions
The study of organic fractionation is important as the soil biological properties largely depend on it. The Very labile carbon was higher under plains as compared to piedmont and hills, whereas corresponding results for hills and piedmont were found to be statistically at par in studied samples. The Very labile carbon content decreased with soil depth. It was 19.1%, 20.5% and 7.2% lower in plains, piedmont and hill region, respectively, in D2 than in D1. It was maximum in plains and ranged between 0.53 to 2.40 g kg−1 and lowest in hills, ranged between 0.61–1.46 g kg−1. The corresponding value for piedmont is 0.47–1.56 g kg−1 ().
Table 4. Distribution of oxidizable soil organic carbon fractions (g kg−1) in various physiographic regions as affected by different depths in lower Shiwaliks.
The average labile carbon content in soil samples was found in the order: hills (0.81 g kg−1) > piedmont (0.73 g kg−1) > plains (0.50 g kg−1). The labile carbon content decreased with soil depth. In surface (D1) soil, hills had 7.2% higher labile carbon content than sub surface (D2), whereas piedmont and plains had 20.5 and 19.1% higher labile carbon content, respectively. Saha et al. [Citation14] observed the magnitude of very labile carbon and labile carbon decline with soil depth. As these fractions are strongly related to root carbon inputs and other organic residues, and thus are often accumulated at the soil surface. Yang et al. [Citation11] observed that losses of very labile carbon after forest transition mainly occurred in D1 layer. As described earlier, hill region was earlier under forest cover and later converted to arable land, due to which higher soil erosion by water on these soils could have washed the very labile and labile carbon fraction from the surface layer. Under M-W systems, the two easily-oxidizable fractions viz., very labile carbon and labile carbon together constituted 56–60% of TOC. The rest of TOC occurred in less labile and recalcitrant fractions, which is close to 30–40%, assigned to the “passive pool” of SOC in the Century Model [Citation38]. The results suggested that the organic carbon in soils under M-W is less stable and could be easily lost through organic matter decomposition if the current land-use is discontinued.
Less labile carbon was maximum in plain region ranged between 0.97 and 4.40g kg−1 and in piedmont it ranged between 0.86 and 2.85 g kg−1. The corresponding result in hills was 0.46–1.02 g kg−1. In surface (D1) layer, highest amount of Less labile carbon was found in plain region (4.40 g kg−1) followed by piedmont region (2.85 g kg−1) and lowest in hills (1.00 g kg−1), as in plains and piedmont R-W system was dominantly practiced.
Recalcitrant carbon (g kg−1) was found to be maximum in the plain region ranging between 0.88 and 4.00 g kg−1 and in piedmont it ranged between 0.79 and 2.59 g kg−1 (). The corresponding result in hills was 0.38–0.83 g kg−1. The recalcitrant carbon in surface (D1) soil samples was highest in the plain region (4.00 g kg−1). However, it was significantly lower (2.59 g kg−1) in piedmont and hills (0.83 g kg−1) from that in the plain region. Down the depths (D1 and D2), plains and piedmont it varied significantly (p < 0.05) whereas no significant (p < 0.05) difference was observed under hills.
The soils under R-W contained a superior proportion (63%) of OC in less labile and recalcitrant fractions i.e. silica and lignin [Citation41]. The larger proportion of OC existing in less labile and recalcitrant forms in RW system is attributed to delayed rate of C oxidation in these soils due to flooding for 3 months during the rice season [Citation42]. As a result of slow decomposition of C substrates in anaerobic soils, plant molecules (such as lignin) that are more resistant to microbial degradation, accumulates in soil and incorporate phenolic moieties that imparts considerable recalcitrance into young SOM fractions in paddy soils [Citation42,Citation43].
Variation in soil organic carbon content with slope
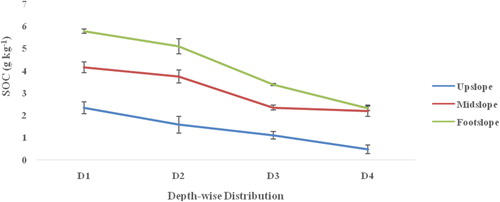
The C content has shown a significant decreasing trend with the altitude. The SOC content in D1 (surface soil) was significantly assessed in different slope transects. The SOC concentration in D1 layer was highest in foot slope (5.76 g kg−1) followed by mid slope (4.14 g kg−1) and lowest in up slope (2.32 g kg−1). It was decreased by 24.8% in mid slope as compared to the foot slope. At up slope, SOC content in D1 was found to be lowest by 28.12% and 59.7% than mid slope and foot slope, respectively (). This is due to downward erosion and washing away of organic materials from the top slope toward the foot slope [Citation35]. The low levels of SOC storage in the Shiwaliks region is due to the low organic matter content of the soils. The higher content of OC at the foot slope was found to be about three times that of the up slope () and similar results were observed by Okon et al. [Citation44].
Figure 2. Variation of Soil organic carbon content with slope and its distribution at different depths.
Relationship between soil organic carbon stock (Mg ha−1) and bulk density (Mg m−3)
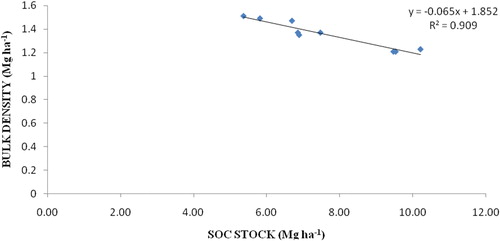
The correlation coefficient for SOC stock is summarized in . When the top layer (D1) of the entire physiographic region was assessed, negative significant correlation was observed between SOC stock and bulk density as a result of lower soil organic matter content downs the depth.
Figure 3. Relationship between soil organic carbon stock (Mg ha−1) and bulk density (Mg m−3).
Conclusions
Lower Shiwaliks foothill is one of the most fragile regions of Punjab which is prone to higher intensity of soil erosion. The SOC stock has shown greater variability with physiography and soil depth. The SOC stock varied significantly in all the physiographic regions in surface (0–10 cm) soil. The order of total SOC stock in the 0–60 cm soil depth was: plains > piedmont > hills. The surface (0–10 cm) soil contributed maximum to the soil profile SOC stock. However, piedmont region has good irrigation facilities but due to gentle slope, soil erosion occurs from the surface layer which results in depletion of SOC thus, ultimately affects soil productivity and soil health. In N-W plains of India, long term cultivation of R-W system had higher SOC stock as compared to other regions, because of intensive cultivation and slower decomposition rate of organic matter. Moreover, plain regions have no slope percent, and hence no soil erosion occurs and SOC gets accumulated in depression sites. Thus, for regular monitoring of SOC in different physiographic regions, soil health card schemes should be promoted. Government should focus on developing new research findings for adopting carbon sequestering ability of soils as a win-win strategy for mitigating the effect of climate change as well as for human health.
Acknowledgments
I would like to thanks S.S. Kukal, Dean Agriculture, Punjab Agricultural University, Ludhiana, H. Singh, Chief Agriculture officer cum Deputy Director Agriculture for helping me in design of the present study. We extend our thanks to the Principal, Khalsa College, Amritsar, India for providing necessary lab facilities for conducting the research work.
Disclosure statement
No potential conflict of interest was reported by the authors.
Table 1. Relationship between physiographic regions and physico-chemical soil properties at different depths in lower Shiwaliks.
References
- Masson-Delmotte V, Zhai P, Portner HO, et al. Global warming of 1.5 °C. An IPCC special report on the impacts of global warming of 1.5 °C above pre-industrial levels and related global greenhouse gas emission pathways, in the context of strengthening the global response to the threat of climate change, sustainable development and efforts to eradicate poverty. Geneva (Switzerland): World Meteorological Organization; 2018.
- Sahoo UK, Singh SL, Gogoi A, et al. Active and passive soil organic carbon pools as affected by different land use types in Mizoram, Northeast India. Plos One. 2019;14(7):e0219969–16. pone.0219969. doi:10.1371/journal.
- Grandy AS, Robertson GP. Land-use intensity effects on soil organic carbon accumulation rates and mechanisms. Ecosystem. 2007;10(1):59–74. doi:10.1007/s10021-006-9010-y.
- Singh BR, Lal R. The potential of soil carbon sequestration through improved management practices in Norway. Environ Dev Sustain. 2005;7(1):161–184. doi:10.1007/s10668-003-6372-6.
- Benbi DK, Chand M. Quantifying the effect of soil organic matter on indigenous soil N supply and wheat productivity in semi-arid sub-tropical India. Nutr Cycl Agroecosyst. 2007;79(2):103–112. doi:10.1007/s10705-007-9100-z.
- Lal R. Enhancing crop yields in the developing countries through restoration of the soil organic carbon pool in agricultural lands. Land Degrad Dev. 2006;17(2):197–209. doi:10.1002/ldr.696.
- Dhaliwal SS, Naresh RK, Mandal A, et al. Dynamics and transformations of micronutrients in agricultural soils as influenced by organic matter build-up: A Review. Environ Sustain Indic. 2019;1–2:1–10. doi:10.1016/j.indic.2019.100007.
- Eaton N, Mcgoff M, Byrne KA. The impact of agricultural land cover change on soil organic carbon stocks in Ireland. In Greenhouse-gas budget of soils under changing climate and land use (burn out). 2007. Journal of Soil Science and Environmental Management Variability of soil organic carbon with landforms and land use in the Usambara Mountains of Tanzania. p. 75–80.
- Mandal A, Toor AS, Dhaliwal SS. Assessment of sequestered organic carbon and its pools under different agricultural land-uses in semi-arid soils of south-western Punjab. J Soil Sci Plant Nutr. 2020;20(1):259–273. doi:10.1007/s42729-019-00137-5.
- Kukal SS, Kaur M, Bawa SS, et al. Water-drop stability of natural soil aggregates from different land uses after treatment with polyvinyl alcohol. Catena. 2007;70(3):475–479. doi:10.1016/j.catena.2006.11.013.
- Yang Y, Tilman D, Furey G, et al. Soil carbon sequestration accelerated by restoration of grassland biodiversity. NPJ Quantum Inf. 2019;10(1):718. doi:10.1038/s41467-019-08636.
- Fissore C, Dalzell BJ, Berhe AA, et al. Influence of topography on soil organic carbon dynamics in a Southern California grassland. Catena. 2017;149(1):140–149. doi:10.1016.
- Post WM, Kwon KC. Soil carbon sequestration and land-use change: processes and potential. Glob Change Biol. 2000;6(3):317–327. doi: 10.1046/j.1365-2486.2000.00308.x.
- Saha D, Kukal SS, Sharma S. Land use impacts on SOC fractions and aggregate stability in typic Ustochrept of Northwest India. Plant Soil. 2011;339(1–2):457–470. doi:10.1007/s11104-010-0602-0.
- Eynard A, Schumacher TE, Lindstrom MJ, et al. Aggregate sizes and stability in cultivated South Dakota Prairie Ustolls and Usterts. Soil Sci Soc Am J. 2004;68(4):1360–1365. doi:10.2136/sssaj2004.1360.
- Dhaliwal SS, Naresh RK, Gupta RK, et al. Effect of tillage and straw return on carbon footprints, soil organic carbon fractions and soil microbial community in different textured soils under rice-wheat rotation-a review. Rev Environ Sci Biotechnol. 2019;19(1):103–115. doi:10.1007/s11157-019-09520-1.
- Mandal A, Majumder A, Dhaliwal SS, et al. Impact of agricultural management practices on soil carbon sequestration and its monitoring through simulation models and remote sensing techniques: A Review. Crit Rev Environ Sci Technol. 2020:1–49. doi:10.1080/10643389.2020.1811590.
- Powers JS, Corre MD, Twine TE, et al. Geographic bias of field observations of soil carbon stocks with tropical land-use changes precludes spatial extrapolation. Proc Natl Acad Sci U S A. 2011;108(15):6318–6322. doi:10.1073/pnas.1016774108.
- Gruneberg E, Schoning I, Hessenmoller D, et al. Organic layer and clay content controlsoil organic carbon stocks in density fractions of differently managed German beech forests. For Ecol Manage. 2013;303:1–10. doi:10.1016/j.foreco.2013.03.014.
- Oueslati I, Allamano P, Bonifacio E, et al. Vegetation and topographic control on spatial variability of soil organic carbon. Pedosphere. 2013;23(1):48–58. doi:10.1016/S1002-0160(12)60079-4.
- Singh MJ, Khera LL. Soil erodibility indices under different land uses in lower Shiwalik. J Trop Ecol. 2008;49(2):113–119.
- Morgan RPC. Soil erosion and conservation. 3rd ed. Blackwell Publishing, Oxford, 2005. p. 304.
- Toy TJ, Foster GR, Renard KG. Soil erosion: processes, prediction, measurement and control. New York (NY): Wiley; 2002. p. 338.
- Gupta N, Kukal SS, Bawa SS, et al. Soil organic carbon and aggregation under poplar-based agroforestry system in relation to tree age and soil type. Agrofor Syst. 2009;76(1):27–35. doi:10.1007/s10457-009-9219-9.
- Olk DC, Dancel MC, Moscoso E, et al. Accumulation of lignin residues in organic matter fractions of lowland rice soils: a pyrolysis-GC-MS study. Soil Sci. 2002;167(9):590–606. doi:10.1097/00010694-200209000-00004.
- Majumder B, Mandal B, Bandyopadhyay PK. Soil organic carbon pools and productivity in relation to nutrient management in a 20-year-old rice-berseem agroecosystem. Biol Fertil Soils. 2008;44(3):451–461. doi:10.1007/s00374-007-0226-6.
- Bhattacharyya T, Pal DK, Mandal C. Organic carbon stock in Indian soils and their geographical distribution. Curr Sci. 2000;79(5):655–660.
- Mandal B, Majumder B, Bandyopadhyay PK, et al. The potential of cropping systems and soil amendments for carbon sequestration in soils under long-term experiments in subtropical India. Glob Change Biol. 2007;13(2):357–369. doi:10.1111/j.1365-2486.2006.01309.x.
- Walkley A, Black CA. An examination of the Degtjareff method for determining soil organic matter and a proposed modification of the chromic acid titration method. Soil Sci. 1934;37(1):27–38.
- Chan KY. Soil particulate organic carbon under different land use and management. Soil Use Manage. 2001;17(4):217–221. doi:10.1111/j.1475-2743.2001.tb00030.x.
- Ball DF. Loss-on-ignition as an estimate of organic matter and organic carbon in non-calcareous soils. J Soil Sci. 1964;15(1):84–92. doi:10.1111/j.1365-2389.1964.tb00247.x.
- Manik N, Pengilley SM, Field G, et al. Soil and crop management practices to minimize the impact of waterlogging on crop productivity. Front Plant Sci. 2019;10(10):140–163. doi:10.3389/fpls.2019.00140.
- Sahrawat KL. Organic matter accumulation in submerged soils. Adv Agronomy. 2004;81:169–201. doi:10.1016/S0065-2113(03)81004-0.
- Ono K, Mano M, Han GH, et al. Environmental controls on fallow carbon dioxide flux in a single-crop rice paddy, Japan. Land Degrad Develop. 2015;26(4):331–339. doi:10.1002/ldr.2211.
- Singh Y, Singh B, Ladha JK, et al. Effects of residue decomposition on productivity and soil fertility in rice-wheat rotation. Soil Sci Soc Am J. 2004;68(3):854–864. doi:10.2136/sssaj2004.8540.
- Garcia-Pausas J, Casals P, Romanyà J, et al. Seasonal patterns of belowground biomass and productivity in mountain grasslands in the Pyrenees. Plant Soil. 2011;340(1–2):315–326. doi:10.1007/s11104-010-0601-1.
- Dhaliwal SS, Naresh RK, Gupta RK, et al. Long term effects of intensive rice-wheat and agroforestry based cropping systems on build-up of nutrients and budgets in alluvial soils of Punjab, India. Archieves Agronomy Soil Sci. 2019;66(3):330–342. doi:10.1080/03650340.2019.1614564.
- Gu C, Liu Y, Mohamed I, et al. Dynamic changes of soil surface organic carbon under different mulching practices in citrus orchards on sloping lands. Plos One. 2016;11(12):e0168384–226. doi:10.1371/journal.pone.0168384.
- Sarkhot DV, Jokela EJ, Comerford NB. Surface soil carbon size–density fractions altered by loblolly pine families and forest management intensity for a Spodosol in the southeastern US. Plant Soil. 2008;307(1–2):99–111. doi:10.1007/s11104-008-9587-3.
- Fendorf S, Francis C, Lobell D, et al. Spatial variation in microbial processes controlling carbon mineralization within soils and sediments. U.S. Department of Energy Office of Science, Office of Biological and Environmental Research, Terrestrial Ecosystem Program. 2017.p. 1–13
- Benbi DK, Brar K, Toor AS, et al. Soil carbon pools under poplar-based agroforestry, rice-wheat and maize-wheat cropping systems in semi-arid India. Nutr Cycl Agroecosyst. 2012;92(1):107–118. doi:10.1007/s10705-011-9475-8.
- Benbi DK, Toor AS, Kumar S. Management of organic amendments in rice-wheat cropping system determines the pool where carbon is sequestered. Plant Soil. 2012 360(1–2):145–162. doi:10.1007/s11104-012-1226-3.
- Bierke A, Kaiser K, Guggenberger G. Crop residue management effects on organic matter in paddy soils - the lignin component. Geoderma. 2008;146(1–2):48–57. doi:10.1016/j.geoderma.2008.05.004.
- Okon MA, Osuji GE, Uzoho BU, et al. Soil organic carbon storage as affected by physiographic positions on a Caternary Landscape in an ultisol in Owerri, Southeastern. Int J Res Agric Forestry. 2014;1(2):18–22.