
Abstract
Though livestock are one of the major contributors to climate change through emission of greenhouse gases (GHG), the intensity of emission and the mitigation potential from this sector is not clearly known in the study regions. Therefore, the present study was designed to estimate the emission of GHGs from the livestock sector over the time period (2003/04–2017/18) and evaluate the mitigation potential using the global livestock environment assessment model (GLEAM). Both primary and secondary data sources were used to obtain data on livestock population, herd parameters, feeding practices, and manure management. The study revealed an increasing trend of GHG from 2003/04 to 2017/18, where the annual emission increased with an average 3.8 Mt carbon dioxide equivalent (CO2-eq) for all species and 3.3 Mt CO2-eq for cattle alone at national level. Though there is some variation between regions, methane (CH4) was the major gas emitted from ruminant production followed by nitrous oxide (N2O), however the emission of N2O was higher (> 70%) in poultry production. The emission intensity from chicken egg and meat, 1.8–3.3 and 2.2–7.2 kg CO2-eq/kg of product, respectively, was much lower than the emission intensity of meat from small ruminants (16.4–51.5 kg CO2-eq/kg of product) and cattle (34.2–148.2 kg CO2-eq/kg of product). Implementing the integrated mitigation approach has much pronounced reduction effect on GHG emissions as well as increasing the productivity of the livestock sector. Unless mitigation measures are taken, the sector’s emission will increase over time. Thus, federal and regional governments, and partner organizations working in the sector need to give more attention and implement the initiatives identified in the Climate Resilient Green Economy (CRGE) strategy and Food and Agriculture Organization of the United Nations (FAO) recommendations to mitigate GHG emissions from the livestock sector.
Introduction
Livestock are one of the major contributors to climate change (CC) through emission of greenhouse gases (GHGs). Among livestock species, ruminants particularly cattle are the main contributor to the emissions. According to the report of FAO [Citation1], livestock’s contribution to the anthropogenic GHG emissions is about 14.5% (i.e., 7.1 Gt CO2-eq/yr out of 49 Gt CO2 eq/yr considering the emission report of Intergovernmental Panel for Climate Change (IPCC) [Citation2]). The overall contribution of Ethiopia to CC through emission of GHGs is estimated about 150 Mt CO2 eq/yr [Citation3].
Livestock contribute to climate change by emitting GHGs (CH4, NO2 and CO2) either directly (e.g. from enteric fermentation and manure management) or indirectly (e.g. from feed-production activities and conversion of forest into pasture) [Citation4]. Livestock supply chains account for 5-9, 35–44, and 53-65% of the total global anthropogenic emitted carbon dioxide (CO2), methane (CH4), and nitrous oxide (N2O), respectively [Citation1,Citation5,Citation6]. Beef and milk cattle production account for the majority of emissions, respectively, contributing 41 and 20% of the sector’s emissions. While pig meat and poultry contribute, respectively 9 and 8% to the sector’s emissions, the strong projected growth of this production will result in higher emission shares and volumes over time. In industrialized countries, the emission from feed production, processing and transportation is high. However, in developing countries like Ethiopia where cattle production is mainly dependent on grassland/grazing systems, the enteric fermentation and manure are the major sources of emission [Citation1].
Globally, the livestock sector is growing faster than any other agricultural sector. Due to the growing human population (from 7.2 billion in 2010 to 9.6 billion in 2050) and growing income coupled with urbanization, the demand for meat and milk in 2050 is projected to increase by 73% and 58%, respectively, from their levels in 2010 [Citation1]. Therefore, it is not difficult to estimate the contribution of the livestock sector to the emission of GHGs under business as usual (BAU). By 2050, direct GHG emissions from meat, milk, and egg production are projected to increase by 39% above their levels in 2000 [Citation7], yet many technologies may be developed or used to decrease these projected emission levels. The emission of GHGs in Ethiopia is estimated to increase to 400 Mt CO2 eq by 2030 under the BAU scenario where the contribution from the livestock sector increases from 65 Mt CO2 eq/yr in 2010 to 125 Mt CO2 eq/yr in 2030 [Citation3].
Ethiopia aims to achieve middle-income status by 2025 while developing a green economy. Following the conventional development path would, among other adverse effects, result in a sharp increase in GHG emissions and unsustainable use of natural resources. To avoid such negative effects, the government has developed a strategy to build a green economy. The Ethiopia’s Climate Resilient Green Economy (CRGE) initiative follows a sectoral approach and has identified and prioritized more than 60 initiatives, which could help the country achieve its development goals while minimizing GHG emissions. Improving crop and livestock production practices for higher food security and farmer income, while reducing emissions is among the four pillars where the green economy plan is based. Improvement in the livestock production practices alone is expected to have an abatement potential of 48 Mt CO2 eq which is 1/5th of the abatement potential of the country [Citation3]. On the other hand, the Ethiopian livestock master plan aspires to increase cattle milk and meat production by 93 and 52%, respectively, at the end of 2020 [Citation8], which could be the major source of GHGs, if mitigation strategies are not implemented.
Due to the wide variety of farming systems (smallholder/grassland production to intensive commercial farming), measuring the emission of GHGs from the livestock sectors seems to be complicated [Citation9]. However, several approaches have been used to estimate GHG emissions from this sector where the global livestock environment assessment model (GLEAM-i) [Citation1,Citation10,Citation11], in vitro gas production [Citation12–15], respiratory gas chambers [Citation16–18], the sulphur hexafluoride (SF6) tracer technique [Citation16,Citation18–20] were the widely used approaches. A study by Dioha and Kumar has explored the GHG mitigation strategies for African agricultural sector taking Nigeria as a case study, where they also tried to estimate the emission of GHG from the sector using the Agriculture and Land Use National Greenhouse Gas Inventory Software [Citation21].
Studies indicated that by improving the feeding and management system of livestock production, the GHG emissions from this sector can be reduced significantly [Citation1,Citation22–29]. Among these strategies, animal feeding and feed crop management, manure management, and animal health care and reproductive improvement [Citation1,Citation23,Citation30] are efficient practices to reduce emissions from the sector. However, in developing countries including Ethiopia, ruminants are fed on poor quality feeds that ultimately results in increased emission of methane through enteric fermentation and manure [Citation31–33]. Furthermore, studies indicate that breed variation and livestock mix have impact on the emission of GHGs. The mitigation strategies identified in Ethiopia include enhancing intensification, and animal mix and diversification, value chain efficiency improvements (pastoralists and farmers), mechanization of the agricultural practices, and rangeland and pasture land management [Citation3]. Shifting the feeding habit from cattle meat to small ruminant and chicken meat could also play a significant role in mitigating GHG emissions from the sector. Moreover, shifting from cattle production to small ruminant and camel production is exercised by farmers as a means of adaptation to climate change impacts.
Afar region and some parts of the Tigray and Amhara regions are home to (agro)-pastoral and smallholder farmers who largely depend on livestock production for their livelihood. These areas are characterized by an arid and semi-arid climate with low and erratic rainfall. Despite the large livestock population in these regions with spontaneous growth driven by the increasing demand for livestock products, the regional aggregated GHG emissions and the contribution of livestock to CC in the regions have not been studied systematically. Besides, all measurements which were taken as options to reduce GHG were based on some speculations. The estimation of GHG from the livestock production at national level by FAO [Citation1], GLEAM-i default estimation, was majorly based on average standards for sub-Saharan Africa (SSA) and the methodology used in the CRGE estimation [Citation3] of GHG from the livestock sector was not clearly indicated. Recently, Amanuel and his colleagues attempted to use GLEAM for estimating the GHG emissions from livestock production in Tigray and Afar regions [Citation11]. However, their study was farm based and the data sources were not very comprehensive, and the potential mitigation options were not assessed in detail. In its nature, GLEAM requires an extensive data sources, both primary and secondary. Therefore, the absence of well quantified and documented GHG emissions data from the livestock sector at national and regional levels had made it difficult, complicated and unscientific to apply any intervention measures. Moreover, understanding the mitigation potential of the livestock sector and identifying appropriate mitigation measures will have a positive implication for designing mitigation strategies suitable to the production system and agro-ecology. Thus, this study aimed to quantify GHG emissions from livestock production under different management system and agro-ecology. Moreover, the study attempted to identify suitable mitigation measures and quantify their potential. The results and extensive data generated in this study will be useful for policy makers, academicians and researchers nationally and globally. The extensive data (both primary and secondary) generated in this study can be used as experience for other countries with similar climate and production systems. Moreover, the mitigation scenarios developed can be adopted and tested in areas with similar production system and agro-ecological setup.
Research questions
What is the overall emission of GHGs from livestock kept under different management systems and production targets in the study areas?
What is the mitigation potential of the livestock sector in the pastoral and agro-pastoral communities in the study areas?
Does improving the production and productivity of livestock, and manure management practices reduce the emission intensity of GHG per product?
Methodology
Study regions and livestock characteristics
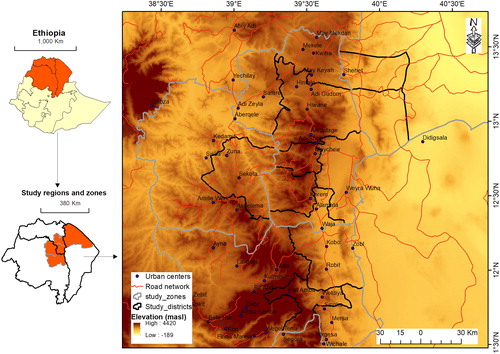
An estimation of greenhouse gases (CO2, CH4 and N2O) was attempted from food animal species (cattle, sheep, goat, chicken) commonly reared in Ethiopia and the three regions (Tigray, Afar and Amhara). These regions were selected since they share borders, have varying production systems (smallholder to pastoral/agro-pastoral) and their accessibility for data collection. The emission estimation was made at national and regional levels.
For collection of livestock related data, five districts in Tigray (Enderta, Samre, Maichew, Alamata and Humera), three districts in Amhara (Guba Lafto, Raya Kobo and Sekota) and two districts in Afar (Abala and Megale) were selected purposively due to their agro-ecological variation and accessibility of secondary data (). The livestock species in the areas and their management system were characterized by obtaining secondary data. The total livestock breeds compared to other livestock species, management system, and purpose of livestock keeping, life span of animals, reproductive performance and other important parameters were collected using the survey questionnaire. In addition, milk yield, manure produced, manure management, common feed resources and their inclusion rate in the feed were collected by survey questionnaires and recorded in a prepared format.
Figure 1. Map of the study regions and data collection sites.
Data sources and data collection methods
Both primary and secondary sources of data were used in this study. The primary data were collected using questionnaire survey, observation and direct measurement. A structured questionnaire was prepared to collect data on herd reproduction, production, feeding system and manure management from agricultural and/or veterinary experts in the selected districts (S1 File). Data on farming activities and farming system parameters were collected from different production systems. The secondary data were obtained from the data report formats of the respective districts’ offices of agriculture/pastoral and rural development. In addition, a 15-year livestock census data were obtained from the central statistical authority (CSA) of Ethiopia. Other published and unpublished materials (regional and district office reports) were also used as additional source of the secondary data, depending on availability and relationship of those materials with the study objective.
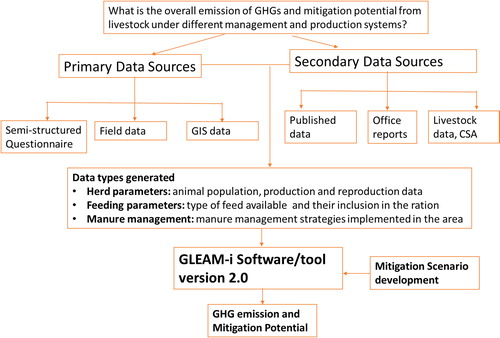
The data collected was formatted as per the requirements of the GLEAM-i tool developed by FAO [Citation1,Citation10] for quantification of GHG emissions for different production systems across the world. The major data types were livestock population and herd parameters, feed resources and their inclusion in the ration, and manure management ().
Figure 2. General methodological framework.
Data types collected
Animal population and herd parameters
A fifteen-year livestock population data were obtained from Ethiopian Central Statistical Authority. As there was shortage of data on the herd parameters on a yearly basis and no much variation was observed on the parameters used, the data was classified in to three groups each group having 5 years interval (2003/4–2007/8, 2008/9–2012/13, and 2013/14–2017/18). The proportion of adult reproductive animals over the total population was calculated based on the CSA 5 year average livestock population for each group and the proportion used in the FAO GLEAM-i tool for Ethiopia [Citation10,Citation34] (). An average value was taken from the primary and secondary (previous studies and CSA annual report) data sources on the herd parameters [Citation35–49] () and adjusted to each production type (Excel sheet SCitation1). As there was no significant variation over time horizon and due to lack secondary data, an average value for the years 2003/4–2017/18 was considered for small ruminants and poultry. The annual average data on cow milk and egg production obtained from the annual CSA report was also summarized into five-year averages at national and regional levels (). Since there was shortage of research-based data on flock characteristics in Tigray and Afar regions, the national average was considered.
Table 1. Emission of GHG at national level and the study regions over time periods.
Table 4 . Emission intensity from poultry production systems (2013/14–2017/18).
Table 5. Emission intensity from ruminant production systems (2013/14–2017/18).
Table 7. Effect of mitigation options on GHG emission from livestock (Afar and Amhara).
Table 8. Effect of mitigation options on annual average meat, milk and egg production.
Feed resources and their inclusion in the ration
The common feed resources used for livestock (cattle, sheep and goats) in the country and regions were obtained from the CSA annual reports and previous research undertakings and data collected for the present study (Table S9, supplementary material). The feed data for poultry were adopted from the GLEAM-i tool for Ethiopia with some modification based on the primary data collected for this purpose. Based on these data and the previous experience from FAO GLEAM-i tool for Ethiopia a ration was formulated for each species and production type (Excel sheet SCitation2).
Manure management
For manure management, the primary data collected during this study period and data used in the previous GLEAM-i tool for Ethiopia was used. The manure management data for national average, Tigray and Amhara regions were closely related. Thus, the average value was considered for the two regions and the national average (Table S10, supplementary material). Management of manure in a form of liquid/slurry, composting and anaerobic digestors was not a major practice in the study areas.
Evaluation of GHG emissions from livestock using GLEAM
The Global Livestock Environment Assessment Model (GLEAM) developed by a working team from FAO was used to estimate the emission of GHG mainly CH4, N2O and CO2 from livestock at a national level and in the three regions [Citation1,Citation10,Citation34]. The model enables the production of disaggregated estimates of GHG emissions and emission intensities for the main commodities, farming systems and world regions. GLEAM quantifies GHG emissions for spatially defined geographic units (cells measuring 5 km × 5 km at the equator). GLEAM is built on five modules reproducing the main elements of livestock supply chains: the herd module, the feed module, the manure module, the system module and the allocation module. The analysis uses the Life Cycle Assessment (LCA) method for the identification of all the main emission sources along the supply chain [Citation1]. The model uses explicit information from a wide range of sources and relies predominantly on the IPCC [Citation2] guideline to compute emissions which is based on Tier 2 approach. This model was developed to address the need for a comprehensive tool to assess interactions between livestock and the environment, and reduce manual calculation errors. In addition, the model generates averages and ranges at different scales and production systems, and supports stakeholders in their effort towards adopting more sustainable practices that ensure higher efficiency, improved livelihoods for farmers and mitigation of environmental impacts [Citation10]. As the model accommodates different production systems and management strategies, it is more suitable for a country like Ethiopia where there are diversified livestock production systems. Thus, in the present study, the GLEAM was used to estimate the emission of GHGs from livestock and evaluate the mitigation potential of the livestock sector in the three regions with implementation of recommended strategies by FAO and CRGE. First the emissions from the different production systems and food animal species in the three regions were assessed. Then the available and suitable mitigation potentials with respect to the production systems were also evaluated.
Global Warming Potential (GWP) described by the 4th assessment report of the IPCC [Citation5] was used to convert N2O and CH4 to CO2-eq terms. The GHG emissions factor (EF) used in the FAO assessment [Citation1] was also applied in the present study.
The mitigation potential of the livestock sector in the study regions
After estimation of the GHG emissions from livestock in the study regions and at national level, the following mitigation/abatement approaches identified by FDRE [Citation3] and FAO [Citation1] were selected and evaluated for their potential to mitigate the emission of GHG in the country and the study regions. The mitigation options were selected according to their mitigation potential, considering the production systems and their feasibility of adoption by the pastoral and agro-pastoral communities in the target sites and the specific production systems.
Scenario-I: Shifting meat consumption habit from beef to small ruminant and poultry meat
Beef is the primary meat consumed in Ethiopia (> 65%) [Citation3,Citation50], and the demand for beef is a major driver of the size of the cattle population, which results in high GHG emissions. Chicken meat has much lower emission intensity than beef [Citation1]. However, at less than 10% of total meat consumption, chicken consumption is currently low compared with other countries. In this scenario, reducing cattle beef consumption to 30% by 2030 and increasing meat consumption of small ruminants to 40% and poultry meat to 30% was evaluated. For this, the abatement potential of reducing the beef and dairy cattle by 10% and 5%, respectively, and increasing small ruminants by 20% and poultry by 50% annually was considered.
Scenario-II: Improving the productivity and reproductive performance of livestock
In this scenario improving age at first calving/lambing/kidding (months) by 5%, reducing mortality of young and adult animals by 3% and 2%, respectively, improving weight at birth and weight of adult animals by 10%, and increasing milk production by 15% was evaluated for ruminants. The milk fat and protein contents were maintained as per standards. In addition, reducing the parturition interval by 10% was considered for small ruminants. In case of poultry, improving age at first egg lay (wks) by 5%, reducing mortality of young and adult animals by 20% and 10%, respectively, improving weight of adult animals by 10%, increasing egg production by 15% and improving hatchability by 5% were evaluated.
Scenario-III: Improved feeding practices
In this scenario reducing free grazing and increasing the concentrate/improved feed resources in the ration was considered as per the recommendations of FAO [Citation1] and other research outputs [Citation23,Citation51]. Thus, in this scenario, reducing free grazing by 5% and increasing improved feed resources by 5% was evaluated.
Scenario-IV: Manure management and handling
Anaerobic digestion, solid separation, aeration, reducing storage time, storage cover with straw were among the strategies recommended by FAO [Citation1] and other research outputs [Citation23]. However, these management systems are not commonly practiced in the country or study regions. Thus, reducing the pasture/range/paddock, dry lot, uncovered anaerobic lagoon and burning for fuel use and sharing these management strategies to anaerobic digestion, solid storage and liquid/slurry management was evaluated in this scenario for ruminants.
Scenario-V: Integrated approach
In this scenario, all the above mitigation options (scenarios) were integrated to evaluate their collective abatement potential.
Data analysis and management
After collecting and formatting all the necessary data, it was entered in the GLEAM-i version 2.0 software in separate sheets for each of the production systems. For each study region the data was fed separately. Once the analysis was completed, the result was exported into excel sheet and descriptive statistics and graphical interpretations were made.
Result
Overall GHG emissions
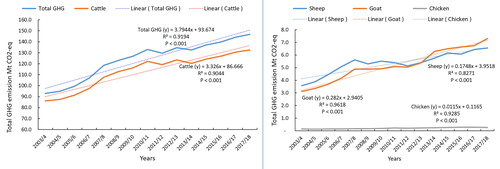
The year wise total GHG emissions from the four species of animals (cattle, sheep, goat, and chicken) at national level showed an increasing trend (92.9 Mt CO2-eq in 2003/4 to 146.8 Mt CO2-eq in 2017/18). Similarly, the emission for all the species showed an increasing trend, however, the change for cattle was very significant compared to other species. Cattle contribute 90.4–92.6% of the overall emissions (). The five-year average overall GHG emissions also showed an increasing trend at national and regional levels. Among the three regions, Amhara region took the highest share (23.5–25.8%), followed by Tigray region (6.6–7.8%) in the emission of GHGs. In Tigray and Amhara regions, the share of CH4 to the overall emission was ranging from 76.7–77.2% and 76.5–77.9%, respectively. However, in Afar region the share of CH4 was lower and the share of N2O was higher compared with the two regions. There was 127.4% and 89.3% increase in the emission of GHG in Afar region from 2003/4–2007/8 to 2008/9–2012/13 and 2008/9–2012/13 to 2013/14–2017/18, respectively, and this increase is much higher than the other regions and the national average ().
Figure 3. Year-wise emission of GHG from cattle, sheep, goat and chicken in Ethiopia (2003/04 – 2017/18).
GHG emissions by species of livestock and production system
In all the regions and the national level, cattle took the lion’s share, 73.7–91.7% of the overall GHG emissions while the contribution of chicken was less than 0.3% at all levels. Unlike other regions and the national average, the contribution of goat in Afar region was higher, ranging from 11.5 to 16.9% (). In sheep and goats, the emission of CO2 is less than 1% of the overall emission in all the regions, whereas in cattle it ranged between 1.2 and 1.5%. However, in chicken, the emission of this gas ranged between 8.3 and 12.6%. In cattle CH4 is the major emitted gas and in small ruminants, CH4 and N2O are the major gases. The major gas emitted from the chicken production was N2O which took more than 70% of the emitted gases in all the regions and the nation (). In ruminants the mixed production systems were the major emitters of GHG in Tigray and Amhara regions and the national average. However, in Afar region the emission from the grassland production systems took the highest share (84–95%). In chicken, the backyard production system was the major contributor to the emission of GHGs ().
Figure 4. Percent emission of GHGs from livestock species in the study regions and national level (2013/14 – 2017/18).
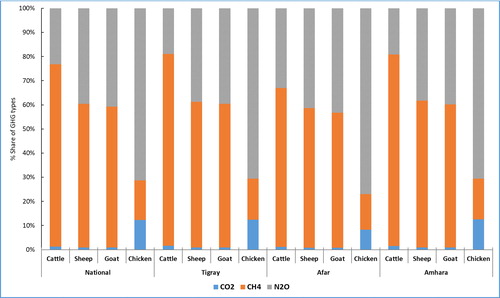
Figure 5. Emission of GHG by animal species and production system (2013/14–2017/18).
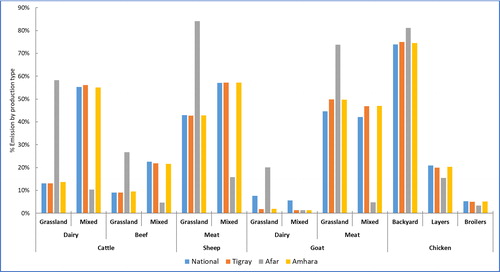
Table 2. Emission of GHGs by species of livestock.
Emission of GHG by source
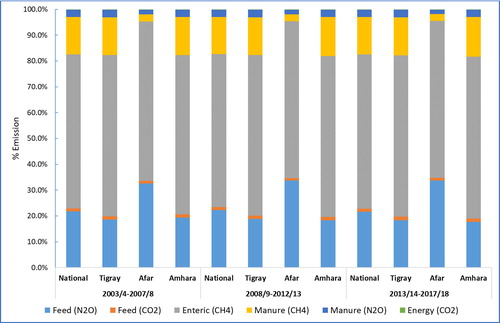
The major sources of GHG emissions in all the regions were N2O from feed (fertilizer and crop residues, and manure application and deposition), CO2 from feed (feed production, transport and processing, and land use change related to feed cultivation), CH4 from enteric fermentation and manure, and CO2 from direct and indirect on farm energy use. In all the regions enteric CH4 took the highest share (59.2–62.9%). Unlike the other two regions and the national average, the emission of CH4 from manure in Afar region was lower, whereas, the emission of N2O from feed was much higher than the other region (above 32%). Emission of CO2 from energy use was negligible, < 0.2% (). Nitrous oxide from feed was also significant.
Figure 6. Emission of GHGs by source (2003/04 – 2017/18).
Taking cattle (highest emitters of GHG) and chicken (lowest emitter) as a representative for ruminants and monogastric, the emission of GHGs by source and production system, were assessed. In all the production systems, emission from enteric fermentation took the highest share (59–67%) in cattle for all the regions though the emission from grassland systems was higher. In all cattle production systems, the emission of CO2 from feed production, and direct and indirect on farm energy use was very minimum (< 1%). In backyard chicken production emission of N2O from manure was found to be very high (79–84%). However, in layer production emission of CH4 from manure was higher (47–49%) followed by emission of CO2 from feed production, transport and processing (37–38%). Whereas in broiler production, emission of CO2 from feed production, transport and processing took the highest share (65–68%) of the emission followed by CO2 from energy use ().
Table 3. Emission of GHG by species, production system and source of emission (2013/14–2017/18).
Emission intensity per product
In general, the emission intensity (EI) from backyard production systems was found to be low in all the regions and the national average. The overall emission in chicken production was higher in backyard production system, however, the highest EI was recorded in meat produced from layers (6.9–7.2 kg CO2-eq/kg of meat). The lowest EI was recorded in eggs produced from the backyard system in Tigray region (1.8 of kg CO2-eq/kg egg) and the highest in the same production system was observed in Amhara region (2.2 of kg CO2-eq/kg egg) ().
Meat produced from dairy cattle has lower EI than meat produced from specialized beef cattle. In all the regions and the national average, the emission intensity from small ruminant meat and milk was much lower than the EI of these products from cattle. The highest EI in cattle (148.2 kg CO2-eq/kg of meat) was observed in Afar region from grassland beef production. The lowest EI in cattle (10.5 kg CO2-eq/kg of milk) was also recorded from the same region in mixed dairy production. In sheep and goat production, highest EI was recorded in Afar region ().
The mitigation potential of the livestock sector to GHG emissions
Effect of mitigation options on meat, milk, and eggs
Implementing scenario-I alone will have a negative impact on milk production since it is based on reducing the population of cattle. The highest milk reduction was recorded in Amhara region (11.3%) followed by Afar region (10.2%). Scenario-III (feed management) and scenario-IV (manure management) did not have any effect on meat, milk, and egg production. Implementing the integrated mitigation approach has an increasing effect on meat, milk, and egg production, while reducing the emission of GHGs ().
Table 6. Effect of mitigation options on GHG emission from livestock (National and Tigray).
Effect of mitigation options on GHG emissions
Except scenario-II (improving productivity and reproductive performance of livestock), all the other scenarios showed a reduction in the overall emission of GHGs from the four livestock species. Highest emission reduction was observed under scenario-V, which integrates all the mitigation options. While applying the mitigation options, CH4 and N2O showed a reduction trend except under scenario-II, however, CO2 showed an increasing trend. Except under scenario-II, the emission of GHG from cattle showed a significant reduction ( and ). In all the scenarios, the average emission and production data of 2013/14-2017/18 was taken as a baseline value.
Though the emission from chicken has increased by more than 300% under the integrated mitigation option, its contribution to the overall emission was insignificant. By applying an integrated mitigation options, there is an abatement potential of 11.6 Mt CO2-eq/yr from the livestock sector at national level. Similarly, the abatement potential from Tigray, Afar, and Amhara regions is 0.76, 0.12, and 4.39 Mt CO2-eq/yr, respectively. In general, the abatement potential in the integrated approach (scenario-V) from Afar region was found to be lower (2.9%) compared to other regions and the national average.
Effect of mitigation options on emission intensity
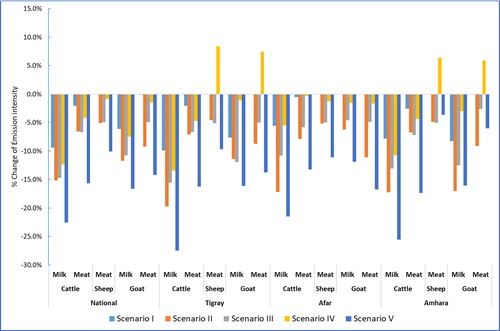
A significant reduction in EI was obtained for cattle milk, where a reduction of 27%, 26%, 23% and 21%, respectively, was recorded in Tigray, Amhara, National average and Afar. On the other hand, the EI of sheep and goat meat showed an increase in Tigray and Amhara regions under scenario-IV, and no change was observed in all the regions and the national average for the same product under scenario-I. The highest EI reduction for all the products was observed under scenario-V. In general, the EI reduction was significant for milk and meat from cattle, which also shows a reduction of GHG from these animals ().
Figure 7. Percent change of EI for milk and meat from ruminants under different scenarios.
Discussion
Under Ethiopian condition the contribution of the livestock sector to emission of GHG is more than 43% [Citation3], which is much higher than the global average (14.5%) [Citation1]. In the present study, an increasing trend of GHG was observed from 2003/4 to 2017/18, where the annual GHG emissions from cattle alone has increased with an average of 3.3 Mt CO2-eq, which is alarming to take appropriate mitigation measures. The contribution of GHG from livestock is expected to grow due to increasing populations of livestock triggered by an increasing demand of animal protein, especially in developing countries [Citation12]. According to the FDRE [Citation3] document of Ethiopia, the emission of GHG from the livestock sector was projected to increase from 65 Mt CO2-eq in 2010 to 125 Mt CO2-eq in 2030. However, the emission recorded in this study was much higher than the projection, which could be due to the variation in the methodology used and data sources. Moreover, the species of livestock considered in the estimation of GHGs were not clearly indicated in the CRGE document. Of the three regions considered in the present study, Amhara region takes the highest share of emissions which is directly related to the large livestock population in the region. However, the percent change of GHG emissions over time periods was very high (89.3% − 127.4%) in Afar, which is associated with the increasing livestock population in the region.
The share of cattle to the overall emission of GHG was much higher (90.4–92.6%), which is mainly associated with the large cattle population in the country. Cattle are the main contributors at a global scale to the sector’s emissions representing about 65% of the emissions [Citation1]. Furthermore, a review by Grossi et al. [Citation52] has indicated as the share of cattle is above 72% of the overall GHG emissions. The main difference in the share of cattle to the overall emission with the present study could be their assessment is based on the global livestock and species such as buffalo and pigs are also considered in the analysis. Furthermore, the high input poultry and pig productions in the developed countries could contribute high to the sector’s emission. Unlike to other regions the share of GHG emissions from goat in Afar region is higher, which is associated with the high goat population in the region, extensive management system and poor-quality feed that leads to longer rumination time.
Among the GHG types, CH4 took the highest share in all the three regions, though the share of N2O was significant in Afar region. Ruminants have the highest CH4 emissions among all animal types because of their unique digestive system, composed of a rumen, or large "fore‐stomach" [Citation53]. The higher emission of CH4 and N2O from ruminants could also be the reason for the higher overall emission of GHGs at national and regional levels as the global warming potential (GWP) of these gases is 34 and 298, respectively [Citation54]. In addition, enteric fermentation and manure are also indicated as the major sources of emission in developing countries [Citation1]. Since, the emission of CO2 is mainly associated with feed production and processing, and energy use in the farm, which are not the major features of livestock production in the country, its share to the overall emission is less than 1.5%. In developing regions, the use of feed grain is increasing from time to time as a result of the significant increases in monogastric production [Citation55], which would be the cause for the increasing emission of CO2 from poultry production. In industrialized regions, feed production and processing, and manure are also major contributors [Citation1].
High emission of CH4 through enteric fermentation and manure followed by N2O from feed and manure in ruminants could be associated with high methanogenic organisms in the rumen and presence of undigestible material in the manure. Enteric fermentation contributes almost 90% of the total CH4 emission from ruminants, and the rest comes from hindgut fermentation [Citation56]. The poor quality feed and longer life span of animals before slaughter (12–15 years) could be the major reasons for the higher emission of CH4 through enteric fermentation [Citation57]. The higher emission of CH4 and N2O from manure could be an indicator of weak manure management in the country and the study regions. As the feeds of poultry are rich in protein source diets, the manures and wastes containing inorganic or readily mineralizable N, will stimulate N2O emission [Citation58] through the nitrification and denitrification processes. This results in higher emission of N2O from the poultry sector.
Though the overall emission of GHGs is lower compared to developed and some developing countries, the EI per kg of product was higher than the global average for most commodities. For instance, the EI of meat from dairy cattle in grassland production systems in all the regions and national average was much higher than the global average (21.9 kg CO2-eq/kg) of the same production system. Similarly, the EI of meat from mixed production systems, and EI of milk from grassland and mixed dairy productions were higher than the global averages [Citation1]. The EI of goat milk, and meat from both sheep and goat in the study regions and the national average was higher than the global average for all production systems [Citation1]. However, the EI for meat and milk from cattle and small ruminant reported in the present study was found to be within a range of EIs for the same commodities in tropical regions [Citation9].The higher EI from cattle and small ruminant products in the country and the study regions could be the result of low productivity compared to the emission produced, and poor husbandry practices, prolonged slaughter age, low-quality feeds and feeding practices, and animals with low productive potential that were often used for draft power and to manage household risk, as well as for production. Emission intensity was usually related to management practices [Citation25,Citation59,Citation60]. In the arid regions of SSA where available animal fodder is of much lower quality, a cow can consume up to ten times more feed, in the form of rangeland grasses, to produce a kilo of protein [Citation55]. The higher EI in grassland systems compared to mixed systems is mainly attributed to feed quality and herd management [Citation1,Citation55]. Better animal feeding and nutrition in industrialized regions reduces CH4 and manure emissions (lower release of N and volatile solids), which ultimately reduces the EI of milk compared to developing countries. Higher milk yields imply a shift of the cow’s metabolism in favor of milk and reproduction as opposed to body maintenance, contributing to lower EI [Citation1,Citation61]. However, unlike to the global trend EI from goat milk was lower than cow milk, which could be mainly associated with low intensive input production in goats compared to cattle. Similarly, the carbon footprint of meat from both goat and sheep meat was lower than meat from cattle. The difference in EI among ruminant species can be attributed to the higher fecundity, faster reproductive cycles and growth rates in small ruminants [Citation60].
The EI per product showed variations across the three regions and production systems, where a higher EI for meat was observed in Afar region compared to Tigray and Amhara regions and the national average. These variations are largely driven by differences in production goals (specialized versus non-specialized production) and management practices, including animal husbandry methods, animal health and genetics which influence levels of productivity [Citation1,Citation60,Citation62].
The EI for egg and meat in backyard, layer and broiler production systems in the study regions and the national average was lower or closer to the global average. In general, the EI from backyard production system in this study as well as the global average [Citation1] was lower than the EI from layer and broiler productions. . In backyard production systems, the feed ration is mostly made up of wastes and by-products with low EI which compensate for the high manure emissions per unit of product. In contrast, industrial systems characterized by high productivity have slightly higher EI. They have optimized feed conversion ratios but are penalized by the relatively high EI of the feed materials they rely on (driven up by energy consumption and land-use change) [Citation1,Citation63]. The EI of meat from broiler production was lower than the EI of meat from layer production, which could probably be associated with more efficient production, short slaughter age of broilers and better feed conversion efficiency [Citation59,Citation64].
Beef and dairy cattle represented the largest source of livestock-related emissions because of both the abundance of these animals and the fact that emissions per animal. For this reason, the substitution of small ruminant, swine and poultry for meat, milk and egg production can be considered as an option for mitigating livestock emissions [Citation59,Citation65]. However, considering the large proportion of Orthodox Christian and Muslim population in Ethiopia, the substitution of swine for meat production does not seem feasible. Thus, in the present study, changing the feeding habit from cattle meat to small ruminant and poultry meat was considered. This approach has a potential to reduce total GHG emission by 4.0%, 5.2%, 5.3% and 9.6%, respectively in Tigray, Afar, national average and Amhara region. The disadvantage of this option is the reduction in milk production while reducing GHG emissions due to the reduction in dairy animals. However, the impact of this approach on land use change requires further investigation.
Improving the productivity and reproductive performance of livestock such as age at first calving, calving interval, better animal health and reduced mortality, improved weight at birth and growth rate, and improved milk production have a potential to lower the EI from 5–20% of the baseline value. The reduction in EI for milk was higher (15–20%) compared to other products. On the other hand, this mitigation option resulted in increased overall GHG emissions which is associated with an increased productivity in terms of milk, meat and eggs. The reduction in EI was associated with an increased productivity of animals which ultimately reduces the intensity of CH4 [Citation51,Citation66,Citation67].
One of the strategies in relation to dietary improvement to reduce GHGs is to improve feeds and feeding management practices. Reducing free-grazing and increasing improved feed resources (cereal by-products, molasses, and oilseed by-products) had shown a potential to reduce GHG and EI by 4.7–5.1%, 3–15%, respectively, from the baseline. While CH4 and N2O emissions are reduced, the emission of CO2 has increased due to the improved feed resources. It has been indicated that feeding diets with higher grain content, and oilseeds are among the dietary CH4 mitigation strategies as compared with feeding forage-based diets [Citation23,Citation51,Citation68]. Starch fermentation promotes propionate production in the rumen and lowers ruminal pH, which inhibits the growth of rumen methanogens [Citation69]. Moreover, improving feed conversion efficiency can lower CH4 production [Citation51]. Targeting reductions in CH4 emissions has the advantage over reducing CO2 because CH4 has a global warming potential 34 times than that of CO2. In addition, since it’s atmospheric residence time is short (10–12 years), the mitigation impacts can be seen in short time [Citation26,Citation51].
The manure management and handling strategies (anaerobic digestion, solid storage, and liquid management) tested in the present study had a potential of reducing GHG emissions by 0.2–5.1% across the regions. The lowest mitigation potential was observed in Afar and the highest in Amhara regions. Manure management strategies have also been indicated as they have medium to high mitigation potential [Citation1,Citation70].
The integrated mitigation approach, which included all the above-mentioned mitigation options had much better mitigation potential than the individual approaches. This approach had a potential to reduce the overall emission by 2.9–11.9%. Moreover, the reduction in EI was very significant ranging from 4% to 27% depending on the animal product. The added value in this approach is the increased productivity ranging from 2.0% for milk to 337.9% for egg. Several research findings also recommend implementing integrated mitigation approaches to reduce the emission of GHG from the livestock sector [Citation1,Citation9,Citation23–25,Citation27,Citation59,Citation71].
Conclusion
The GHG from the livestock sector in Ethiopia and the study regions has showed an increasing trend over time. This increase is very alarming and calls for taking appropriate mitigation measures. Unless mitigation measures are taken or put in place, the contribution of GHG emissions from the livestock sector is expected to grow due to increasing population of animals triggered by an increasing demand of animal protein. Compared to the other regions, the increase in the emission of GHG from Afar region was highly significant over the time periods. Grassland-based production systems have higher emissions and EIs compared to mixed production systems. The EI from chicken products (egg and meat) was much lower than ruminant products (milk and meat). It was evidenced that livestock from the country and the three regions have a higher abatement potential to reduce GHG emissions. Thus, it is time to implement mitigation measures to realize the climate resilient green economy strategy of the country. Since the EI of chicken and small ruminant meat is much lower than cattle meat, mitigation options towards substitution of cattle meat with chicken and small ruminant meat could have a promising abatement potential. Implementing the integrated approach has much pronounced reduction effect on the emission of GHG as well as increasing the productivity of the livestock sector that can satisfy the growing demand for animal products. In this study four species of animals were considered for estimating the emission of GHGs. Quantifying the emission of GHG from camel in Afar region is important to have a complete picture of the emission in the region, however, due to lack of the required data, that was not accomplished in this study. Therefore, future studies may target quantifying emission from these species of animals.
Supplemental Material
Download Zip (369.3 KB)Disclosure statement
No potential conflict of interest was reported by the author(s).
Additional information
Funding
References
- Gerber PJ, Steinfeld H, Henderson B, et al. Tackling climate change through livestock – A global assessment of emissions and mitigation opportunities. Rome (Italy): Food and Agriculture Organization of the United Nations (FAO); 2013.
- IPCC. IPCC Guidelines for national greenhouse gas inventories: agriculture, forestry and other land use. Japan: Intergovernmental Panel for Climate Change (IPCC);2004.
- FDRE. Ethiopia’s climate-resilient green economy strategy. Addis Ababa: Government of the Federal Democratic Republic of Ethiopia; 2011. p. 1–130.
- Steinfeld H, Gerber P. Livestock production and the global environment: Consume less or produce better? Proc Natl Acad Sci USA. 2010;107(43):18237–18238. doi:10.1073/pnas.1012541107.
- IPCC. Climate Change 2007: The physical science basis. Contribution of working group I to the fourth assessment report of the intergovernmental panel on climate change. Geneva, Switzerland,: Intergovernmental Panel on Climate Change (IPCC); 2007.
- Steinfeld H, Gerber P, Wassenaar T, et al. Livestock's long shadow: environmental issues and options. Rome: Food and Agriculture Organization of the United Nations (FAO); 2006.
- Pelletier N, Pirog R, Rasmussen R. Comparative life cycle environmental impacts of three beef production strategies in the Upper Midwestern United States. Agric Syst. 2010;103(6):380–389. doi:10.1016/j.agsy.2010.03.009.
- Shapiro BI, Gebru G, Desta S, et al. Ethiopia livestock master plan: Roadmaps for growth and transformation (A contribution to the Growth and Transformation Plan II (2015-2020) ILRI Project Report. Nairobi, Kenya: International Livestock Research Institute (ILRI); 2015.
- Benavides RAM, Guerrero HS, Mateus D. Livestock greenhouse gases emissions under grazing conditions in the tropic. Revinvestigagrarambient. 2018;10(1):91–106. doi:10.22490/21456453.2685.
- Anne M, Carolyn O, Alessandra F, et al. The global livestock environmental assessment model (GLEAM), Version 2.0 Rome. Italy: Food and Agriculture Organization of the United Nations (FAO);2018. [cited 2019 February 5]. Available from: http://www.fao.org/gleam/en/
- Amanuel B, Solomon AB, Mulubrhan B. Estimation of greenhouse gas emissions from three livestock production systems in Ethiopia. Int J Clim Change Strategies Manage. 2020; 12(5): 669–685
- Amlan KP. Recent advances in measurement and dietary mitigation of enteric methane emissions in ruminants. Front Vet Sci. 2016;3(39):1–17.
- Habtamu TM, Yeshi T, Gebrehiwot TM, et al. In vitro estimation of gas and methane production from locally available feed stuffs and rumen content. Ethiop J Veterin Sci Animal Prod. 2020;4(1):1–9.
- Pashaei S, Razmazar V, Mirshekar R. Gas Production: A proposed in vitro method to estimate the extent of digestion of a feedstuff in the rumen. J of Biological Sciences. 2010;10(6):573–580. doi:10.3923/jbs.2010.573.580.
- Sejian V, Bhatta R, Malik PK, et al. Livestock as sources of greenhouse gases and its significance to climate change. Greenhouse Gases ExLi4EvA. 2016;:243–259. doi:10.5772/62135
- Grainger C, Clarke T, McGinn S, et al. Methane emissions from dairy cows measured using the sulfur hexafluoride (SF6) tracer and chamber techniques. J Dairy Sci. 2007;90(6):2755–2766. doi:10.3168/jds.2006-697.
- Gardiner TD, Coleman MD, Innocenti F, et al. Determination of the absolute accuracy of UK Chamber facilities used in measuring methane emissions from livestock. Measurement. 2015;66:272–230. /doi:10.1016/j.measurement.2015.02.029.
- Pinares-Patiño C, Lassey K, Martin R, et al. Assessment of the sulphur hexafluoride (SF6) tracer technique using respiration chambers for estimation of methane emissions from sheep. Anim Feed Sci Technol. 2011;166/167:201–209. doi:10.1016/j.anifeedsci.2011.04.067.
- Johnson K, Huyler M, Westberg H, et al. Measurement of methane emissions from ruminant livestock using a sulfur hexafluoride tracer technique. Environ Sci Technol. 1994;28(2):359–362. doi:10.1021/es00051a025.
- Lassey K, Walker C, McMillan A, et al. On the performance of SF6 permeation tubes used in determining methane emission from grazing livestock. Chemosphere–Global Change Sci. 2001;3(4):367–376. doi:10.1016/S1465-9972(01)00017-4.
- Dioha MO, Kumar A. Exploring greenhouse gas mitigation strategies for agriculture in Africa: the case of Nigeria. Ambio. 2020;49(9):1549–1566. doi:10.1007/s13280-019-01293-9.
- de Oliveira Silva R, Barioni LG, Albertini TZ, et al. Developing a nationally appropriate mitigation measure from the greenhouse gas GHG abatement potential from livestock production in the Brazilian Cerrado. Agric Syst. 2015;140:48–55. doi:10.1016/j.agsy.2015.08.011.
- Dutreuil M, Wattiaux M, Hardie C, et al. Feeding strategies and manure management for cost-effective mitigation of greenhouse gas emissions from dairy farms in Wisconsin. J Dairy Sci. 2014;97(9):5904–5917. doi:10.3168/jds.2014-8082.
- Havlík P, Valin H, Herrero M, et al. Climate change mitigation through livestock system transitions. Proc Natl Acad Sci USA. 2014;111(10):3709–3714. doi:10.1073/pnas.1308044111.
- Herrero M, Henderson B, Havlík P, et al. Greenhouse gas mitigation potentials in the livestock sector. Nature Clim Change. 2016;6(5):452–461. doi:10.1038/nclimate2925.
- Hristov A, Oh J, Firkins J, et al. Special topics-Mitigation of methane and nitrous oxide emissions from animal operations: I. A review of enteric methane mitigation options. J Anim Sci. 2013;91(11):5045–5069. doi:10.2527/jas.2013-6583.
- Hristov AN, Oh J, Lee C, et al. Mitigation of greenhouse gas emissions in livestock production: A review of technical options for non-CO2 emissions. In: Gerber PJ, Henderson B, Makkar HPS. Animal Production and Health Paper No 177. Rome: FAO; 2013.
- Hyland J, Styles D, Jones D, et al. Improving livestock production efficiencies presents a major opportunity to reduce sectoral greenhouse gas emissions. Agric Syst. 2016;147:123–131. doi:10.1016/j.agsy.2016.06.006.
- Llonch P, Haskell M, Dewhurst R, et al. Current available strategies to mitigate greenhouse gas emissions in livestock systems: an animal welfare perspective. Animal. 2017;11(2):274–284. doi:10.1017/S1751731116001440.
- Vu QD, de Neergaard A, Tran TD, et al. Manure, biogas digestate and crop residue management affects methane gas emissions from rice paddy fields on Vietnamese smallholder livestock farms. Nutr Cycl Agroecosyst. 2015;103(3):329–346. doi:10.1007/s10705-015-9746-x.
- Gebrehiwot MT, Punia BS, Dey A, et al. Effects of Albizia lebbeck leaves and its extracts on methanogenesis and fermentation of feeds in buffaloes (Bubalus bulballis). Indian J Anim Nutr. 2014;31(4):362–366.
- Hristov AN, Callaway TR, Lee C, et al. Rumen bacterial, archaeal, and fungal diversity of dairy cows in response to ingestion of lauric or myristic acid. J Anim Sci. 2012;90:4449–4457.
- Hristov AN, Ivan M, Rode LM, et al. Fermentation characteristics and ruminal ciliate protozoal populations in cattle fed medium – or high concentrate barley-based diets. J Anim Sci. 2001;79(2):515–524. doi:10.2527/2001.792515x.
- MacLeod M, Gerber P, Vellinga T, et al., editors. GLEAM: an example of the potential contribution of livestock modelling to sustainable intensification. Carbon Management Centre International Conference: Sustainable intensification: The pathway to low carbon farming; Edinburgh, Scotland; 2013.
- Ayalew H, Chanie D, Lamesegn D. Review on productive and reproductive performance of indigenous dairy cattle breeds under farmer’s management practices in Ethiopia. Online J Anim Feed Res. 2018;8(6):169–174.
- Aynalem H, Workneh A, Noah K, et al. Breeding strategy to improve Ethiopian Boran cattle for meat and milk production. IPMS (Improving Productivity and Market Success) of Ethiopian Farmers Project Working Paper 26 Nairobi, Kenya: International Livestock Research Institute (ILRI); 2011.
- DADIS. Domestic Animal Diversity Information System (DADIS). Number of breeds by species and country: Food and Agriculture Organization of the United Nations; [cited 2020 January 12]. Available from: http://www.fao.org/dad-is/data/en/.
- DAGRIS. Domestic Animal Genetic Resources Information System (DAGRIS) Addis Ababa. Ethiopia: International Livestock Research Institute; 2007. [cited 2020 January 12]. Available from: http://www.dagris.info/countries/192/breeds?name=&name_1=&title=&order=name&sort=desc.
- Dereje T, Mengistu U, Getachew A, et al. A review of productive and reproductive characteristics of indigenous goats in Ethiopia. Livestock Res Rural Develop. 2015;27(2):2015.
- Gizaw S, Komen H, Hanotte O, et al. Indigenous sheep resources of Ethiopia: types, production systems and farmers preferences. Anim Genet Resour Inf. 2008;43:25–39. doi:10.1017/S1014233900002704.
- Melkamu T, Kumar N, Gebrekidan B, et al. Performance of Bovans Brown chickens under intensive and backyard management system in Mekelle, Ethiopia. Ethiop J Vet Sci Anim Prod. 2017;1(1):73–80.
- Mengistu R. Performances of highland sheep under community-based breeding program in Atsbi Wenberta District, Tigray, Ethiopia. Bahir Dar, Ethiopia: Bahir Dar University; 2018.
- Moges TT. Phenotypic characterization of indigenous sheep and farmers' breeding objectives in three selected districts of South Wollo Zone, Ethiopia. Bahir dar, Ethiopia: Bahir Dar University; 2016.
- Tadesse D, Singh H, Mengistu A, et al. Study on productive performances and egg quality traits of exotic chickens under village production system in East Shewa, Ethiopia. Afr J Agric Res. 2013;8(13):1123–1128.
- Tadesse G, Tegegne A. Reproductive performance and wastage in large ruminant (cattle) in Ethiopia–review. Dairy Vet Sci J. 2018;8(1):001–009.
- Teweldemedhn M. Characterization of productive and reproductive performances, morphometric and challenges and opportunities of indigenous cattle breeds of Ethiopia: A review. Int J Livest Prod. 2018;9(3):29–41. doi:10.5897/IJLP2017.0426.
- Zelalem A. Assessing fertility, hatchability and chick quality in Andasa Poultry Multiplication Center. Mekelle, Ethiopia: Mekelle University; 2014.
- Eyob T. Morphological characterization of indigenous chicken and their production system in Silte, Dalocha and Wulbareg Woredas of Silt'e Zone, South Region, Ethiopia. Bishoftu, Ethiopia: Addis Ababa University; 2019.
- Getiso A, Bekele B, Zeleke B, et al. Production performance of Sasso (distributed by ethio-chicken private poultry farms) and Bovans brown chickens breed under village production system in three agro-ecologies of Southern Nations, Nationalities, and Peoples' Regional State (SNNPR), Ethiopia. Int J Livestock Prod. 2017;8(9):45–157.
- Abegaz GA, Hassen IW, Minten B. Consumption of animal-source foods in Ethiopia: Patterns, changes, and determinants. Vol. 113. Intl. Food Policy Res. Inst.; 2018.
- Beauchemin KA, McAllister TA, McGinn SM. Dietary mitigation of enteric methane from cattle. CAB Rev. 2009;4(035):1–18. doi:10.1079/PAVSNNR20094035.
- Grossi G, Goglio P, Vitali A, et al. Livestock and climate change: impact of livestock on climate and mitigation strategies. Anim Front. 2019;9(1):69–76. doi:10.1093/af/vfy034.
- Denef K, Archibeque s, Paustian K. Greenhouse gas emissions from U.S. agriculture and forestry: A review of emission sources, controlling factors, and mitigation potential Interim report to USDA under Contract #GS23F8182H. 2011.
- IPCC. climate change 2014: synthesis report. Contribution of working Groups I, II and III to the Fifth Assessment Report of the Intergovernmental Panel on Climate Change. [Core Writing Team, R.K. Pachauri and L.A. Meyer (eds.)]. Geneva, Switzerland: Intergovernmental Panel on Climate Change; 2014.
- Herrero M, Havlík P, Valin H, et al. Biomass use, production, feed efficiencies, and greenhouse gas emissions from global livestock systems. Proc Natl Acad Sci U S A. 2013;110(52):20888–20893. doi:10.1073/pnas.1308149110.
- Prasad CS, Malik PK, et al. Bhatta R, Overview. In: Malik PK, Bhatta R, Takahashi J. editors. Livestock production and climate change. Vol. 6, Climate change series. Oxfordshire, UK: CABI; 2015. p. 1–7.
- CSA. Agricultural Sample Survey 2017/18 (2010 E.C.): Report on Livestock and Livestock Characteristics (Private Peasant Holdings), Statistical Bulletin 587 Addis Ababa, Ethiopia: Central Statistical Agency (CSA); 2018. [cited 2020 March 20]. Available from: http://www.csa.gov.et/survey-report/category/358-eth-agss-2017?download=938. :livestock-report-2010-ec-2017
- Soussana J-F, editor The role of the carbon cycle for the greenhouse gas balance of grasslands and of livestock production systems. Livestock and Global Climate Change; 2008. Hammamet, Tunisia: Cambridge University Press.
- Nugrahaeningtyas E, Baek C-Y, Jeon J-H, et al. Greenhouse Gas Emission Intensities for the Livestock Sector in Indonesia, Based on the National Specific Data. Sustainability. 2018;10(6):1912. doi:10.3390/su10061912.
- Opio C, Gerber P, Mottet A, et al. Greenhouse gas emissions from ruminant supply chains–A global life cycle assessment. Food and agriculture organization of the United Nations; 2013.
- Herrero M, Gerber P, Vellinga T, et al. Livestock and greenhouse gas emissions: The importance of getting the numbers right. Anim Feed Sci Technol. 2011;166-167:779–782. doi:10.1016/j.anifeedsci.2011.04.083.
- Zhu B, Kros J, Lesschen JP, et al. Assessment of uncertainties in greenhouse gas emission profiles of livestock sectors in Africa, Latin America and Europe. Reg Environ Change. 2016;16(6):1571–1582. doi:10.1007/s10113-015-0896-9.
- MacLeod M, Gerber P, Mottet A, et al. Greenhouse gas emissions from pig and chicken supply chains–A global life cycle assessment. Rome, Italy: Food and Agriculture Organization of the United Nations (FAO); 2013.
- Thornton PK. Livestock production: recent trends, future prospects. Philos Trans R Soc Lond B Biol Sci. 2010;365(1554):2853–2867. doi:10.1098/rstb.2010.0134.
- Henry B, Charmley E, Eckard R, et al. Livestock production in a changing climate: adaptation and mitigation research in Australia. Crop Pasture Sci. 2012;63(3):191–202. doi:10.1071/CP11169.
- Howden S, Reyenga P. Methane emissions from Australian livestock: implications of the Kyoto Protocol. Aust J Agric Res. 1999;50(8):1285–1292. doi:10.1071/AR99002.
- Audsley E, Wilkinson M. What is the potential for reducing national greenhouse gas emissions from crop and livestock production systems? J Cleaner Prod. 2014;73:263–268. doi:10.1016/j.jclepro.2014.01.066.
- Johnson KA, Johnson DE. Methane emissions from cattle. J Anim Sci. 1995;73(8):2483–2492. doi:10.2527/1995.7382483x.
- Van Kessel JAS, Russell JB. The effect of pH on ruminal methanogenesis. FEMS Microbiol Ecol. 1996;20(4):205–210. doi:10.1111/j.1574-6941.1996.tb00319.x.
- Petersen SO, Blanchard M, Chadwick D, et al. Manure management for greenhouse gas mitigation. Animal. 2013;7(s2):266–282. doi:10.1017/S1751731113000736.
- Shemdoe R, Kassenga G, Mbuligwe S. Implementing climate change adaptation and mitigation interventions at the local government levels in Tanzania: where do we start? Curr Opin Environ Sustain. 2015;13:32–41. doi:10.1016/j.cosust.2015.01.002.