
 ?Mathematical formulae have been encoded as MathML and are displayed in this HTML version using MathJax in order to improve their display. Uncheck the box to turn MathJax off. This feature requires Javascript. Click on a formula to zoom.
Abstract
Open field burning of rice straw besides causing environmental pollution and human health problems results in loss of organic carbon and essential nutrients. Urgent solution is required for management of rice straw in an eco-friendly and sustainable manner. The aim of the present study was to examine the efficiency of direct return of rice straw into the soil versus biochar generated from rice straw, and compare it with wood derived biochar in influencing soil biological processes and potential to accumulate soil organic C (SOC). We studied the effect of pyrogenic conversion of rice straw and wood chips to biochar on changes in chemical composition of feedstock by Fourier Transform Infrared (FTIR) spectroscopy and C and N mineralization kinetics, microbial metabolism, carbon use efficiency (CUE) and soil enzyme activities in a series of laboratory incubation experiments conducted at 25 °C temperature and field capacity moisture. Pyrogenic conversion of feedstock to biochar resulted in increase in C (39.6% to 69.2%) and N (0.4% to 1.65%) contents and lowering of C/N (99 to 28.4) and H/C (1.94 to 0.60) ratios. Charring resulted in decrease in aliphatic and increase in aromatic components. Decomposition of organic substrates was governed by aromaticity and C/N ratio; in 127 days, only 12% of rice straw biochar embodied C was mineralized as against 76% from rice straw. The addition of biochars resulted in soil N priming (120 ± 24 mg N kg−1) whereas straw application resulted in net N immobilization (−13 mg N kg−1). Compared to unpyrogenic straw, the rice straw biochar led to greater microbial growth, lower metabolic quotient, higher CUE (3.3 times) and decreased microbial respiration, with potential to promote SOC accumulation. It was concluded that addition of rice residue generated biochar into soil is more beneficial for soil biological processes and SOC stabilization to stymie climate change than direct return of plant residue into the soil. The results are significant for devising eco-friendly rice residue management practices in the Indo-Gangetic plains.
1. Introduction
India is the second largest producer of rice after China and contributed about 172.6 million tonnes (mt) of rice in 2018, which was 21.9% of the world production [Citation1]. An estimated 224 mt of rice straw is produced as a by-product annually in the country. Majority of rice straw is burnt in situ in the north-western states (Punjab, Haryana and Uttar Pradesh) of India. The burning of rice straw besides causing environmental pollution and human health problems because of the release of respirable particulate matter (PM2.5 and PM10) and the emission of toxic gases, leads to loss of essential nutrients and organic matter. It is estimated that burning of one tonne of rice straw leads to emission of 3 kg particulate matter, 60 kg CO, 1460 kg CO2, and 2 kg SO2 [Citation2]. In order to prevent crop residue burning, ex situ and in situ management options are being explored. The ex situ options including production of electricity and biogas (bio-CNG) have limited success because of technological and economic constraints and lack of infra structure for handling, transport and storage of rice straw. Current annual utilization of rice straw for power generation is only 0.5 mt [Citation3]. The in situ management options include incorporating the residue in the soil, seeding the following crop of wheat in the presence of stubble, and leaving the residue as surface mulch. Incorporating residue in the soil poses problems with seed-bed preparation, particularly because of small window period (about 3-weeks) between rice harvest and the seeding of the following crop, mainly wheat. Seeding of wheat in the standing stubble needs special machinery, locally called happy seeder or a machine attached with zero till drill. Though on-farm residue management has obvious benefits, yet its adoption is constrained due to large financial investment on the part of the farmers and entails greater energy consumption. Another less explored option is the recycling of rice straw derived biochar obtained as a by-product of bioenergy generation. Using rice straw for bioenergy production through anaerobic digestion and its use as an alternative fuel has the lowest environmental impact in terms of energy balance, compared to other options including incorporation of rice straw in the soil and generation of electricity [Citation4]. Biochar, produced through pyrolysis of organic matter, has often been advocated as an amendment for sequestrating C and improving soil quality [Citation5, Citation6]. A number of studies as well as review articles have examined the effects of biochar application on soil physical and chemical properties [Citation7, Citation8], nutrient dynamics [Citation9, Citation10], C mineralization [Citation11–13], soil microbial community composition and activity [Citation14–16], agronomic productivity [Citation17–20] and net ecosystem C balance and C sequestration [Citation21, Citation22]. These studies mainly focused on biochar generated from extraneous feedstock as a soil amendment and did not investigate the efficiency of direct return of crop residue vis-à-vis biochar produced from the same feedstock in influencing soil biological processes and C stabilization.
Pyrolysis induced changes in the composition of the feedstock could impact its decomposability, microbial metabolism, carbon use efficiency (CUE) and C sequestration potential. CUE is an important metric allocating C resources between soil organic matter pools such as microbial biomass and mineralized C, with potential effects on the soil organic C [Citation23, Citation24]. Since soil organic matter foster enzyme activities involved in many biochemical processes, studying the influence of different straw management practices on soil enzymes and microbial dynamics can help in identifying appropriate alternative to burning. Such information will not help in identifying climate smart residue management practice but will also provide an insight into the mechanism of C turnover in soil. Our hypothesis was that charring of organic biomass will lead to change in its chemical composition that will influence the decomposition process, microbial activity and metabolism and thus CUE; further the effect could vary with the nature of feedstock such as wood versus straw and rate of application. The specific objectives were to (i) study the chemical composition and C and N mineralization kinetics of rice straw, rice straw derived biochar and wood biochar, and (ii) enumerate the effect of charred and uncharred biomass on microbial growth, metabolism and CUE and soil enzyme activities to understand mechanism of C accumulation in soil.
2. Materials and methods
2.1. Experimental design
Laboratory incubation experiments were conducted to study C mineralization (Cmin) kinetics of rice straw (RS), biochar derived from rice straw (RB) and wood biochar (WB) in a sandy loam soil (49.6% sand and 21.9% clay) classified as Typic Ustorthents [Citation25]. The soil was non-saline (electrical conductivity: 0.20 dS m−1), near neutral in reaction (pH: 7.6), high in sodium bicarbonate extractable P (20.3 mg kg−1) and ammonium acetate extractable K (114 mg kg−1). The total, inorganic and organic C concentrations in soil averaged 8.71, 0.36 and 8.35 g kg−1, respectively. Total and mineral N (NH4++NO3–N) concentrations were 0.735 g N kg−1 and 120 mg N kg−1 soil, respectively. The rice straw biochar (RB) and wood biochar (WB) were obtained through pyrolysis of RS and chipped trunks and thick branches of Populus deltoid, respectively at 400 0C for 5 h. Straw and biochar samples were ground to pass 2 mm sieve prior to addition to the soil. The treatments included (i) control-unamended soil, (ii) RS: application of rice straw to supply 1 g C kg−1 soil, (iii) RB1: application of rice straw biochar at 1 g C kg−1 soil, iv) RB2: application of rice straw biochar at 2 g C kg−1 soil, v) RSRB: combination of treatment (ii) and (iii) involving application of RS and RB each at 1 g C kg−1 soil, vi) WB1: application of wood biochar at 1 g C kg−1 soil, and vii) WB2: addition of wood biochar at 2 g C kg−1 soil. Requisite amounts (g kg−1 soil) of RS (2.53), RB (2.13 in RB1and 4.26 in RB2) and WB (1.45 in WB1and 2.90 in WB2) were mixed with field fresh soil. The addition rate of 1 g C kg−1 through RS equates paddy straw application of 6 t ha−1 in the 15 cm soil; the amount generally available for in situ management. All the treatments were replicated three times in a completely randomized design.
2.2. Experimental procedure and measurement
Fifty gram (oven dry equivalent) of treated soil was brought to field capacity moisture (145 g kg−1) and placed in 500-ml conical flasks along with vials containing 10 ml 1 M NaOH to trap evolved CO2. The flasks with treated and untreated (control) soil were incubated in a BOD (biological oxygen demand) incubator at 25 °C temperature. Parallel incubations were carried out for 30, 60, 90 and 127 days. For each incubation period a total of 21 flasks (7 treatments x 3 replications) were maintained. Alkali traps were replaced daily during the first week and every alternate day thereafter. The alkali in the traps was titrated with 0.1 M HCl to determine the amount of CO2 evolved [Citation26]. The amount of C mineralized from straw and biochars was calculated by subtracting C mineralized in unamended control soil.
At the initiation and the end of each incubation period, soil samples were analyzed for microbial biomass C (MBC), enzyme activities (Fluorescein diacetate hydrolysis, dehydrogenase, acidic and alkaline phosphatase) and mineral N (NH4+ and NO3–N). The enzymes were selected based on their ability to describe overall microbial activity, intensity of oxidation–reduction reactions associated with organic matter decomposition and nutrient availability in soil. Microbial biomass C was determined by chloroform fumigation extraction method [Citation27]. Fluorescein diacetate (FDA) hydrolytic activity was determined according to the method given by Adam and Duncan [Citation28]. Dehydrogenase (DHA) enzyme (E.C. 1.1.1.1) activity was assayed by measuring the production of triphenyl formazan (TPF) following incubation of the soil samples with 2,3,5-triphenyl tetrazolium chloride at 37 °C for 24 h [Citation29]. Alkaline phosphatase (AlkPHA) (E.C. 3.1.3.1) and acidic phosphatase (AcdPHA) (E.C. 3.1.3.2) activities were assayed using modified universal buffer of pH 6.5 and 11.5, respectively [Citation30]. Mineral-N was determined by extracting NH4 and NO3–N with 2 M KCl and measuring the amount extracted by steam distillation. Total C and N in soil and organic materials were determined by dry combustion using CHN analyser (Elementar model Vario EL III cube). The functional group analysis of straw and biochar samples was performed through Fourier Transform Infrared (FTIR) spectroscopy with a Thermo Nicolet 6700 FTIR Spectrometer with NXRFT Raman accessory. The spectral bands were identified in accordance with the published literature and a functional group was associated with each peak [Citation31–33].
2.3. Calculations and statistical analysis
Kinetic models of varying complexity ranging from single compartment to multi-compartment were fitted to C mineralization (Cmin, mg kg−1) Vs time (t, days) data [Citation34] using non-linear regression technique in SPSS. First order two compartment (FOTC, EquationEq. (1)(1)
(1) ) and first order zero order (FOZO; EquationEq. (2)
(2)
(2) ) models were finally selected based on minimum residual sum of squares.
(1)
(1)
(2)
(2)
Where, Cd and Cr represent decomposable and recalcitrant C pools with first-order rate coefficients kd and kr, respectively. The sum of Cd and Cr (Cd+Cr) represent carbon mineralization potential. K is the zero-order rate constant.
Microbial carbon use efficiency (CUE) defined as the ratio of microbial growth to assimilation (Eq. (3)) was calculated [Citation35] for various incubation periods.
(3)
(3)
Where ΔMBC is the increase in microbial biomass C at a given time over initial value at zero time (mg biomass C g−1 added C) and Cmin is the cumulative C mineralized or respired at a given time (mg C–CO2 g−1 added C). Metabolic quotient (qCO2) was calculated as the ratio of C mineralization rate (h−1) for a given time period to MBC and was expressed as µg C–CO2 respired mg−1 MBC h−1 (Eq. (4)) [Citation36]).
(4)
(4)
Priming effect (PE) of organic materials on soil organic N mineralization was calculated as (EquationEq. (5)(5)
(5) )
(5)
(5)
Where Ntreat is the N mineralization in treated soil, Ncontrol is the N mineralization in untreated control soil and Nadd is the amount of nitrogen added through an organic source in the treated soil.
The results were statistically analyzed by one way analysis of variance (ANOVA) using SPSS 16.0 (SPSS, Inc., Chicago, IL, USA). The significance of the difference between treatment means was evaluated at 95% confidence interval using Duncan’s multiple range post hoc text (DMRT). Differences in treatment means at p < 0.05 were considered statistically significant.
3. Results
3.1. Straw and biochar composition
The RS, RB and WB contained 396, 469 and 692 g C kg−1 and 4.0, 16.5 and 9.8 g N kg−1, yielding C/N ratios of 99.0, 28.4 and 70.6, respectively. The H/C molar ratios were 1.94, 0.72 and 0.60 for RS, RB and WB, respectively. The FTIR spectra of all the samples showed 6 clear bands over the wave number range 4000–500 cm−1 (). Strong absorption bands were observed at 3337–3354, 2917.5–2923.4, 1595.1–1647.2, 1418.7–1457.0, 1058.8–1112.9 and 783.3–802.3 cm−1. All the samples showed characteristic bands for the functional groups hydroxyl, methyl, methylene, aromatic, carboxyl, phenol, alcohol and polysaccharide. Carbonyl groups were observed only in rice straw. The characteristic bands related to –OH stretching; C–H stretching (aliphatic); benzoid rings in lignin (aromatic skeletal stretching vibrations); aliphatic C–H deformation; –C–O stretching (non cellulosic vibrations); and aromatic C–H deformation (). The region between 3337–3354 cm−1 corresponds to the symmetric stretching of O–H groups; whereas other peaks corresponded to symmetric and asymmetric C–H stretching vibrations in aliphatic –CH, –CH2, –CH3; C = O and C = C stretching in the aromatic ring indicating the presence of lignin components; plane bending vibrations in C–H and variable C–H alkene groups; stretching of C–O groups of secondary alcohol; C–H bending of aromatic compounds like phenyl rings or presence of adjacent aromatic hydrogen in the samples. The spectra for the three samples showed different peak intensities and the majority of the variations occurred in the spectral range of 4000–2900 cm−1 and 1600–500 cm−1 (). The spectral region of 2800–1800 cm−1 also showed variation between the samples in terms of upward shift.
Figure 1. FTIR spectra of rice straw, biochars produced from rice straw and wood.
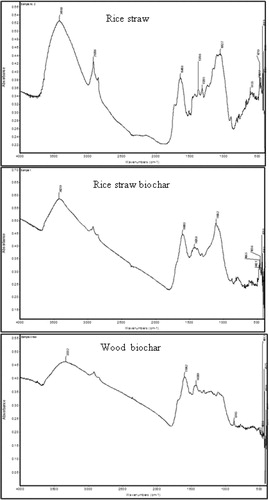
Table 1. Characteristics of FTIR spectra of rice straw, rice biochar and wood biochar.
3.2. Carbon and nitrogen mineralization and soil organic carbon content
The organic materials differed significantly (p < 0.05) in C mineralization (). The cumulative Cmin in 127 days was higher in RS amended soils irrespective of whether applied alone or mixed with biochar and ranged from 1760 to 1886 mg C kg−1 soil. Rice straw biochar at both the rates (RB1 and RB2), significantly increased Cmin by 120 and 140 mg C kg−1 compared to control soil though the effect was small. Carbon mineralization from WB was significantly higher than RB1 and RB2 and its rate of addition also significantly influenced Cmin, being higher in WB2 (1752 mg C kg−1 soil) than WB1 (1520 mg C kg−1 soil). The RS and RSRB were decomposed to a greater extent (76.5 and 44.6%, respectively) than RB1 (12%) and RB2 (7%). Similarly, the proportion of added C mineralized was higher from WB1 (52.6%) than WB2 (37.9%). Carbon mineralization from all the sources followed first order kinetics (). The C mineralization rate was higher during initial periods of incubation and the rate declined with time. First order two compartment model best described the relationship between Cmin and time for all the treatments except WB2 where FOZO model provided a better fit. The first order rate coefficients for decomposable (kd) and recalcitrant (kr) pools were much smaller for RB1 and RB2 than RS. The kd for WB1 was even smaller. Mean residence time calculated as the reciprocal of the mineralization rate of the added C (Treated-control soil) ranged from 2.9 to 5 years for rice biochar, 0.45 years for RS and 0.66 to 0.92 years for WB. Similar to Cmin, the total organic C (TOC) concentration in soil under different treatments changed significantly (). After 127 days, the TOC concentration was significantly higher in biochar amended soils than RS and control soils.
Figure 2. Temporal trends of A) carbon mineralization and B) total soil organic C following rice straw (RS), rice straw biochar (RB1 and RB2), RS and RB mixture (RSRB) and wood biochar (WB1 and WB2) addition to a paddy soil. Treatments labeled with different letters differ significantly (p < 0.05) by Duncan’s Multiple Range test.
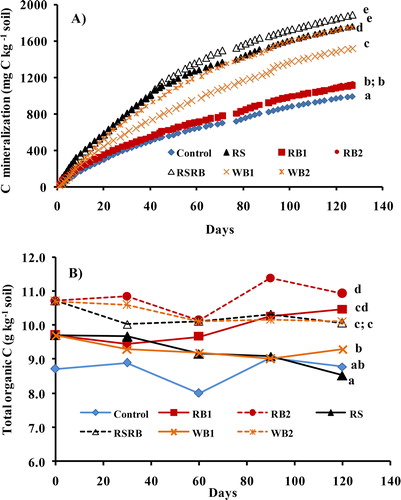
Table 2. Kinetic parameters for the first-order two comportment model (FOTC) fitted to cumulative C mineralization Vs time data.
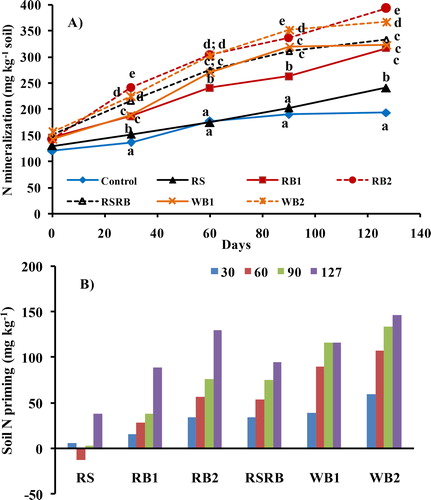
Nitrogen mineralization from all the sources increased with time (). Addition of biochars (both RB and WB) augmented N mineralization and it increased with increasing rate of application. After 127 days of incubation, the N mineralization was higher in RB (by 66 to 107%) and WB (86 to 112%) amended soils compared to control. Rice straw addition either alone or mixed with biochar did not increase N mineralization though at the end of incubation it resulted in net increase in NH4–N in soil. The effect of biochar addition was greater on –N than
–N. The increase in
–N and
–N concentrations following biochar addition ranged from 94 to 163% and 46 to 68%, respectively. After accounting for N mineralization in control soil and amount of N added through organic source, biochar addition resulted in considerable priming of soil N (). In 127 days, RB2 and WB2 resulted in greatest priming followed by RB1 and WB1. On the contrary, RS resulted in net N immobilization during 30–60 days of incubation.
Figure 3. Temporal trends of A) N mineralization and B) N priming in soils amended with rice straw (RS), rice straw biochar (RB1 and RB2), RS and RB mixture (RSRB) and wood biochar (WB1 and WB2) during 127 days of incubation. At a given time, markers followed by different letters differ significantly (p < 0.05) by Duncan’s Multiple Range test.
3.3. Microbial biomass dynamics
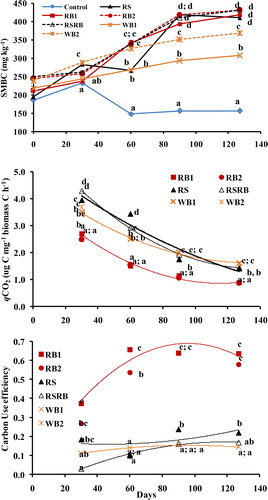
Soil MBC in control declined with time whereas it grew in amended soils as the incubation progressed. Throughout 127 days, the MBC was lowest in control soil and highest in RB2 or RSRB amended soils (). Though soil MBC also increased following RS addition, yet a dip was observed at 60 days. Wood biochar, at both the rates, resulted in gradual increase in MBC. Rice biochar strongly influenced qCO2 and microbial CUE. The qCO2 was lowest in RB amended soils and it generally declined with time. On the other hand, RS and RSRB amended soils exhibited higher qCO2 which was mostly similar to WB. The CUE was higher under both the rates of rice biochar (RB1 and RB2) addition than RS and it continued to increase upto 90 days. When averaged across sampling times and RB rates, the CUE of rice biochar was 3.3 times that of RS. On the other hand, the WB (at both the rates) had CUE almost similar to RS. Mixing RS and RB did not influence CUE compared to solitary application of RS.
Figure 4. Effect of rice straw (RS), rice straw biochar (RB1 and RB2), wood biochar (WB1 and WB2) and rice straw plus biochar (RSRB) addition on soil microbial biomass C (SMBC), microbial metabolic quotient and carbon use efficiency after different periods of incubation. Markers labelled with different letters for a given time indicate significant (p < 0.05) difference between treatments by Duncan’s Multiple Range test.
3.4. Enzyme activities
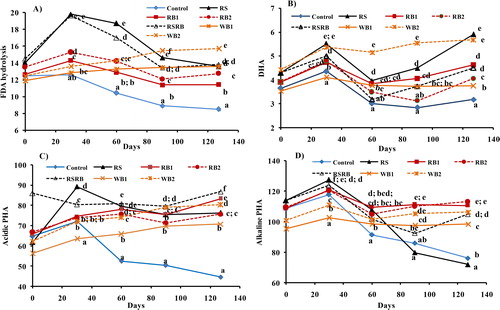
The FDA activity was generally highest at 30 days and declined gradually thereafter as the incubation progressed, except in WB1 and WB2 amended soils where it tended to increase (). At all the sampling times, the FDA activity was lowest in control and highest in RS and RSRB amended soils except WB2 after 90 days of incubation. Compared to control soil, the RB significantly enhanced FDA activity and the effect was greater with RB2 than RB1. The DHA enzyme activity also increased (48.4%) in response to RS addition but conjoint application of RSRB resulted in relatively small increase (22.6%). Addition of rice straw biochar resulted in relatively small increase (15.5 and 28.8%) in DHA activity compared to control soil. Wood biochar improved DHA activity and the effect increased with rate of addition (WB2 > WB1). Irrespective of the treatment, the DHA activity showed a decline at 60-day stage and increased steadily thereafter. The activities of acidic (AcdPHA) and alkaline (AlkPHA) phosphatases were greatest after 30 days of incubation and generally declined thereafter. Addition of RS significantly improved AcdPHA activity but did not influence AlkPHA, which was even lower than the control soil after 60 days of incubation. On the contrary, both rice and wood biochars significantly improved the activities of AcdPHA and AlkPHA, particularly after 60 days of incubation.
Figure 5. Effect of rice straw (RS), rice straw biochar (RB1 and RB2) and wood biochar (WB1 and WB2) on activities of A) Fluoresceine diacetate (FDA), B) dehydrogenase (DHA), C) acidic phosphatase (PHA) and D) alkaline phosphatase (PHA) enzymes after different periods of incubation. Markers labelled with different letters for a given time indicate significant (p < 0.05) difference between treatments by Duncan’s Multiple Range test.
4. Discussion
Pyrogenic conversion of rice straw to biochar resulted in increase in C and N contents and lowering of C/N and H/C ratios. Compared to RB, the WB had higher C/N but lower H/C ratio, which is in agreement with the published research that the elemental composition of biochar depends on the nature of the feedstock [Citation37]. The FTIR spectra of rice straw and biochar though showed the presence of similar functional groups yet the peak intensities varied indicating differences in their content. The RB had the highest aromatic components signifying that pyrogenic conversion of straw to biochar resulted in modification of functional groups leading to decrease in aliphatic C and increase in aromatic C and lowering of C/N ratio [Citation38]. Earlier studies also reported that pyrolysis of straw results in increase in aryl C and carboxyl C, and decrease in O-alkyl C and C/N ratio [Citation39]. Since rice plants are rich in Si they help in forming Si–C bonds, which increase aromatic components and thus impart recalcitrance to biochars [Citation40]. Strong bands shown by RB and straw at 1112.9 and 1111.9 cm−1 are ascribed to Si–O asymmetric stretching bond and the band close to 800 cm−1 was due to the vibrations overlapping of Si–OH and Si–O or C–Si bond [Citation41]. Consistent with other reports [Citation42, Citation43], our results showed that lignin was the main recalcitrant component in wood biochar. The shift in the bands of biochar at 3354.5, 2923.4, 1602.0, 1419.4, 1112.9 and 802.3 to diminishing absorptions of either higher or lower wave numbers in rice straw and wood biochar suggests the biopolymer depolymerisation [Citation44]. More depolymerisation was noted in WB as less significant absorption bands were observed at different wave numbers.
As hypothesized, aromaticity induced by pyrolysis in the biochar structure strongly influenced the mineralization process. Consistent with earlier reports [Citation45], RB did not add greatly to soil C mineralization. At equal rate of application (1 g kg−1 soil), Cmin from RB1 was almost 2/3rd of that from RS and increasing the rate of biochar addition (RB2) did not increase Cmin indicating recalcitrance of biochar embodied C. As a result, only about 7–12% of biochar C compared to ∼76% of straw C was mineralized. Bruun and El-Zehery [Citation46] had found that only 1.8–1.9% of the C contained in biochar was mineralized compared to 45–47% from RS. The decomposition of organic substrates depends on the size of decomposable and recalcitrant C pools [Citation47]. Exceedingly low mineralization of RB embodied C reflects its biological and chemical recalcitrance as substantiated by C mineralization kinetics and chemical analysis of biochar. The kinetic parameters for the two pools model showed that the decomposition rate (kr) for recalcitrant pool of rice biochar was 2/5th of that for straw (). Greater aromaticity, formation of Si–O or C–Si bonds and decreased C/N ratio of biochar compared to un-pyrogenic straw resulted in its slow decomposition. Biochar is generally regarded as biologically and chemically recalcitrant because of increasing aromaticity and highly condensed nature and resistance to chemical treatment [Citation48, Citation49]. The small amount of C that mineralized from biochar primarily originated from microbial decomposition of labile components as was evident from mineralization rate coefficient (kd) for decomposable pool (Cd). Besides the decomposition of labile components of biochar, probably stimulated by the presence of soil organic matter, the increase in C mineralization may also be due to abiotic release of C [Citation50, Citation51].
Mixing biochar with rice straw (RSRB) did not suppress the decomposition of RS and C mineralized from RSRB was equal to the sum mineralized from the two sources individually. Similar to our results, Abiven and Andreoli [Citation52] did not observe any difference in the decomposition between two individual substrates decomposing either separately or mixed together and it was equal to the sum decomposed from the two substrates independently. Based on a literature review, Gartner and Cardon [Citation53] concluded that decomposition of mixed substrates could be additive or greater or less than the sum of the two-litter degrading separately. We found that decomposition of RS and RB mixture was additive of the two substrates decomposing individually. A comparison of RB and WB showed that C mineralization depended on the nature of the feedstock and chemical composition of the substrate, which is in agreement with previous research [Citation54, Citation55]. The WB with wider C/N ratio and devoid of Si–O bonds decomposed to a greater extent than RB. Though WB decomposed at a higher rate than RB yet it was slower than RS due to the presence of greater lignin components and relatively low C/N ratio. Our results showed that pyrogenic conversion of rice straw to biochar imparted recalcitrance to the embodied C, which could lead to C stabilization in soil by reducing microbial respiration. This is in conformity with changes in TOC following straw and biochar application.
The C and N cycles are interrelated; therefore, the differences in the chemical composition of straw and biochar significantly impacted N mineralization. Rice and wood biochar with low C/N ratios resulted in an increase in soil N mineralization that showed rising trend with incubation time and rate of biochar addition. On the contrary, rice straw with wider C/N ration did not lead to net N mineralization, rather resulted in net N immobilization. Accounting for the amount of N contained in biochar and N mineralization in control soil, the biochar addition resulted in considerable priming of soil N. Higher rates of biochar addition (RB2 and WB2) resulted in greater priming than the lower rates. The estimates of priming effect are based on the assumption that it represents the amount of N in excess of added and mineralized from control soil. Consistent with published research [Citation56], we observed larger increase in NH4+–N than NO3−–N. Besides mineralization of native soil organic N, the increase in NH4+–N concentration could also be due to assimilation and release of clay-fixed or non-exchangeable NH4+ by heterotrophic microorganisms [Citation57]. In laboratory incubation experiments with 15N labelled wheat biochar, Fiorentino et al. [Citation58] observed higher NH4+ concentrations drawn from native soil organic N, which was attributed to an apparent priming effect associated with increased capacity of biochar amended soil to retain NH4+. In the present study, the priming effect might have been over-estimated as the gaseous losses of N from control soil were not considered and biochar addition might have reduced the gaseous N losses. In a laboratory incubation experiment, rice husk biochar addition has been reported to decrease N2O emissions by 73.1% in two paddy soils [Citation59]. Our results showed that addition of biochar can lead to soil N priming that can augment soil N supply for crops and microbes.
Microbes are the primary agents of organic matter transformation and center of biological activity in soil. The microbial biomass responds more rapidly to changes in C input to soil than soil organic matter [Citation60]. In the present study, straw and biochar strongly influenced magnitude and activity of soil microbial biomass. Addition of RS and RB significantly increased soil MBC (by 162 and 176%) compared to control soil. Several studies have reported increase in MBC [Citation61–63] and changes in microbial community composition following biochar application [Citation64]. Meta-analysis of published research showed that biochar addition in short-term laboratory incubation experiments increased soil MBC by 26% [Citation65]. In contrast, some studies found either no significant effect or a decrease in MBC with biochar addition [Citation66–68]. Different results from various studies could be attributed to the dissimilarity in the composition of biochar caused by differences in feedstock and pyrolysis temperature. The size and activity of the microbial biomass is known to depend on quantity and quality of organic matter [Citation69] and the growth in soil MBC following straw and biochar addition could be ascribed to the availability of labile or decomposable C components [Citation36, Citation70]. Moreover, biochar provides habitat for microbial growth and protection from predators [Citation71]. In our study, the greater growth of MBC following rice straw biochar than wood biochar addition may be ascribed to the difference in composition of the resources. Increase in MBC following biochar addition can potentially lead to build-up of soil organic C through humification of the microbial necromass [Citation72] as 40 to 80% of the microbial C can become part of humus [Citation73, Citation74].
The potential of biochar to build-up SOC is further substantiated by lowest (0.86–2.70) metabolic quotient (qCO2. the ratio of microbial activity measured by C–CO2 production to MBC) of biochar amended soils. A number of studies have reported lower qCO2 or a smaller amount of respired C in response to biochar addition [Citation14, Citation62, Citation75, Citation76]. Meta-analysis of results from several studies indicated ∼17% reduction in qCO2 following the addition of crop residue and manure derived biochars [Citation65]. Lower qCO2 in biochar amended soils implies improved C use efficiency of microorganisms and better soil biophysical conditions. Further, the declining trend of qCO2 with time may be attributed to the exhaustion of labile C components as the decomposition progressed or because of sorption of organic C on the biochar surface that would otherwise be easily degraded [Citation64].
Carbon use efficiency, a measure of the efficiency with which substrate C is metabolized by the microbial biomass vis-à-vis mineralized was highest (0.58–0.64) in biochar amended soils, being close to calculated thermodynamic maximum of ∼0.60 [Citation77] but much below the maximum of 0.88 on glucose [Citation78]. When averaged across sampling times and RB rates, the CUE of rice straw biochar was 3.3 times that of RS. On the other hand, the WB (at both the rates) had CUE almost similar to RS. Microbial CUE portrays the efficiency of microorganisms to convert organic C into growth [Citation77, Citation79]. Improved CUE and increased abundance of soil biota may be because of presence of resources on or near the biochar surface and sorption as well as release of different organic molecules from biochar [Citation64]. Higher CUE following RB addition indicates that greater amount of C was towards growth than for total maintenance costs (including respiration) that decreased relative to assimilation [Citation80]. This suggests that increased microbial growth and high CUE in rice biochar amended soils can facilitate SOC accumulation as the carbon retained in the organisms can potentially become part of the soil organic matter. The lower CUE values (0.14 to 0.22) for rice straw, RSRB and wood biochar treated soils were perhaps caused by nutrient limitations [Citation77] as evidenced by N immobilization following RS addition and lower AlkPHA activity following RS and WB additions. Low CUE values in straw and wood biochar amended soils imply relatively large C–CO2 losses through microbial respiration and less C converted to microbial [Citation79] thus decreasing the potential for C sequestration.
Though the microbial growth was higher under RB, yet the increase in activities of various enzymes (except AlkPHA) was more following straw addition signifying greater microbial activity in straw-amended soils. High enzyme activities resulted in larger decomposition of added straw. It is consistent with our results on FDA hydrolysis, an indicator of overall microbial activity in soil that was higher in RS (65%) and RSRB (58%) than rice biochar (24–35%) amended soils. Similarly, dehydrogenase (DHA) enzyme activity, indicating the intensity of oxidation-reduction reactions in soil, was higher in straw amended soil. Application of biochar at both the rates (1 and 2 g C kg−1 soil) suppressed DHA activity though it was never below unamended control soil. High DHA activity following straw addition could be attributed to the larger pool of easily decomposable as opposed to predominance of recalcitrant pool in biochar. Low enzyme activities and the associated decrease in mineralization in RB-amended soils may be due to location of C and microorganisms on the same site of biochar surfaces that improved efficiency and reduced the need for enzyme production [Citation64]. Straw and biochar addition also influenced phosphorus availability in soil. The activities of AcdPHA and AlkPHA, the enzymes linked with phosphorus cycling in soil were significantly improved following straw and biochar (RB or WB) addition, particularly after 60 days of incubation. Earlier studies have also reported increase in alkaline phosphatase activity with biochar applications [Citation81]. The effect of straw addition (RS and RSRB) was greater on AcdPHA (46–49%) than AlkPHA (4–14%). Similarly, wood biochar had greater effect on AcdPHA (23–39%) than alkPHA (7–14%). This contrasts with rice biochar that increased AlkPHA activity to a greater extent (averaged 21–22%) than AcdPHA. It could be argued that the increase in phosphatase enzyme activities was due to larger microbial biomass pool and the release of soluble alkaline components from biochar. Chen et al. [Citation82] observed significant increase in activity of alkaline phosphatases in soil amended with biochar prepared at pyrolysis temperature of 350 °C–500 °C. Increased phosphatase activity suggests greater availability of P in soil for crops since phosphatases stimulate the hydrolysis of oxides and mineral bound P, ester phosphate bonds thus releasing orthophosphates for plants and soil microbes [Citation83]. The effect of biochar addition on soil enzyme activities depends on the biochar-enzyme interaction which varies with soil type and feedstock, composition and method of biochar preparation [Citation81, Citation84–86]. Biochar surface area and pore size distribution are considered primal indicators of biochar-enzyme interactions [Citation86]. Therefore, it is not surprising that variable effects of biochar addition on soil enzyme activities have been reported. In the present study, differential effects of RB and WB on soil enzyme activities corroborate the previous findings that biochar feedstock and the specific enzyme, influences the extent of sorption and activity rates. Our results showed that addition of rice biochar compared to unpyrogenic rice straw resulted in greater microbial growth and CUE and decreased enzyme activities and respiration, which can potentially promote SOC accumulation.
5. Conclusions
In conformity with our hypothesis, the charring of rice straw and wood brought about changes in the chemical composition of the feedstock that influenced the decomposition process, microbial activity and metabolism. The rice straw biochar, besides leading to greater microbial growth, higher CUE and decreased microbial respiration, resulted in improved nutrient availability. We have provided scientific evidence that addition of rice residue generated biochar into soil is more beneficial than direct return of plant residue into the soil and it has a greater potential for C sequestration. Future studies should aim at enumerating the effects of biotic and abiotic factors and plant mediated C input on decomposition and persistence of rice straw biochar under field conditions.
Disclosure statement
No potential conflict of interest was reported by the authors.
Additional information
Funding
References
- FAOSTAT. Food and Agriculture Organization of the United Nations (FAO) http://www.fao.org/faostat/en/#data.
- Benbi DK. Carbon footprint and agricultural sustainability nexus in an intensively cultivated region of Indo-Gangetic plains. Sci Total Environ. 2018;644:611–623. doi:https://doi.org/10.1016/j.scitotenv.2018.07.018.
- NAAS. 2017. Innovative viable solution to rice residue burning in rice-wheat cropping system through concurrent use of super straw management system-fitted combines and turbo Happy Seeder. Policy Brief No. 2, National Academy of Agricultural Sciences, New Delhi. 16 p.
- Amarante AB, Schulz AK, Romero OR, et al. Life cycle assessment of the valorization of rice straw for energy purposes. Rice production in Cuba. J Agric Environ Intern Devel – JAEID. 2018;112:295–318.
- Lehmann J, Gaunt J, Rondon M. Bio-char sequestration in terrestrial ecosystems: a review. Mitig Adapt Strat Glob Change. 2006;11(2):403–427. doi:https://doi.org/10.1007/s11027-005-9006-5.
- Laird D. The charcoal vision: a win-win-win scenario for simultaneously producing bioenergy, permanently sequestering carbon, while improving soil and water quality. Agron J. 2008; 100:178–181.
- Glaser B, Lehmann J, Zech W. Ameliorating physical and chemical properties of highly weathered soils in the tropics with charcoal: a review. Biol Fertil Soils. 2002;35(4):219–230. doi:https://doi.org/10.1007/s00374-002-0466-4.
- Laird DA, Fleming P, Davis DD, et al. Impact of biochar amendments on the quality of a typical midwestern agricultural soil. Geoderma. 2010;158(3-4):443–449. doi:https://doi.org/10.1016/j.geoderma.2010.05.013.
- Clough TJ, Condron LM, Kammann C, et al. A review of biochar and soil nitrogen dynamics. Agronomy. 2013;3(2):275–293. doi:https://doi.org/10.3390/agronomy3020275.
- Zheng H, Wang ZY, Deng X, et al. Impacts of adding biochar on nitrogen retention and bioavailability in agricultural soil. Geoderma. 2013;206:32–39. doi:https://doi.org/10.1016/j.geoderma.2013.04.018.
- Jones DL, Murphy DV, Khalid M, et al. Short-term biochar-induced increase in soil CO2 release is both biotically and abiotically mediated. Soil Biol Biochem. 2011;43(8):1723–1731. doi:https://doi.org/10.1016/j.soilbio.2011.04.018.
- Luo Y, Durenkamp M, De Nobili M, et al. Short term soil priming effects and the mineralisation of biochar following its incorporation to soils of different pH. Soil Biol Biochem. 2011;43(11):2304–2314. doi:https://doi.org/10.1016/j.soilbio.2011.07.020.
- Zimmerman AR, Gao B, Ahn M-Y. Positive and negative carbon mineralization priming effects among a variety of biochar-amended soils. Soil Biol Biochem. 2011;43(6):1169–1179. doi:https://doi.org/10.1016/j.soilbio.2011.02.005.
- Kuzyakov Y, Subbotina I, Chen HQ, et al. Black carbon decomposition and incorporation into soil microbial biomass estimated by 14C labeling. Soil Biol Biochem. 2009;41(2):210–219. doi:https://doi.org/10.1016/j.soilbio.2008.10.016.
- Steinbeiss S, Gleixner G, Antonietti M. Effect of biochar amendment on soil carbon balance and soil microbial activity. Soil Biol. Biochem. 2009;41(6):1301–1310. doi:https://doi.org/10.1016/j.soilbio.2009.03.016.
- Anderson CR, Condron LM, Clough TJ, et al. Biochar induced soil microbial community change: Implications for biogeochemical cycling of carbon, nitrogen and phosphorus. Pedobiologia. 2011;54(5-6):309–320. doi:https://doi.org/10.1016/j.pedobi.2011.07.005.
- Jeffery S, Verheijen FGA, van der Velde M, et al. A quantitative review of the effects of biochar application to soils on crop productivity using Meta-analysis. Agr Ecosyst Environ. 2011;144(1):175–187. doi:https://doi.org/10.1016/j.agee.2011.08.015.
- Spokas KA, Cantrell KB, Novak JM, et al. Biochar: a synthesis of its agronomic impact beyond carbon sequestration. J Environ Qual. 2012;41(4):973–989. doi:https://doi.org/10.2134/jeq2011.0069.
- Zhang AF, Liu YM, Pan GX, et al. Effect of biochar amendment on maize yield and green house gas emissions from a soil organic carbon poor calcareous loamy soil from Central China plain. Plant Soil. 2012;351(1-2):263–275. doi:https://doi.org/10.1007/s11104-011-0957-x.
- Liu X, Zhang A, Ji C, et al. Biochar’s effect on crop productivity and the dependence on experimental conditions – a meta-analysis of literature data. Plant Soil. 2013;373(1–2):583–594. doi:https://doi.org/10.1007/s11104-013-1806-x.
- Smith P. Soil carbon sequestration and biochar as negative emission technologies. Glob Change Biol. 2016;22(3):1315–1324. doi:https://doi.org/10.1111/gcb.13178.
- Benbi DK, Toor AS, Brar K, et al. Soil respiration in relation to cropping sequence, nutrient management and environmental variables. Arch Agron Soil Sci. 2020;66(13):1873–1887. doi:https://doi.org/10.1080/03650340.2019.1701188.
- Frey S, Lee J, Melillo JM, et al. The temperature response of soil microbial efficiency and its feedback to climate. Nature Clim Change. 2013;3(4):395–398. doi:https://doi.org/10.1038/nclimate1796.
- Kallenbach CM, Frey SD, Grandy AS. Direct Evidence for microbial-derived soil organic matter formation and its ecophysiological controls. Nat Commun. 2016; 67:10.
- Soil Survey Staff. Keys to Soil Taxonomy. 12th ed. 2014. Washington (DC): USDA-Natural Resources Conservation Service.
- Benbi DK, Sharma S, Toor A, et al. Differences in soil organic carbon pools and biological activity between organic and conventionally managed rice-wheat fields. Org Agr. 2018;8(1):1–14. doi:https://doi.org/10.1007/s13165-016-0168-0.
- Vance ED, Brookes PC, Jenkinson DS. An extraction method for measuring soil microbial biomass C. Soil Biol Biochem. 1987;19(6):703–707. doi:https://doi.org/10.1016/0038-0717(87)90052-6.
- Adam G, Duncan H. Development of a sensitive and rapid method for the measurement of total microbial activity using fluorescein diacetate (FDA) in a range of soils. Soil Biol Biochem. 2001;33(7–8):943–951. doi:https://doi.org/10.1016/S0038-0717(00)00244-3.
- Casida LE Jr., Klein DA, Santoro T. Soil dehydrogenase activity. Soil Sci. 1964;98:371–376.
- Tabatabai MA, Bremner JM. Use of p-nitrophenyl phosphate for assay of soil phosphatase activity. Soil Biol Biochem. 1969;1(4):301–307. doi:https://doi.org/10.1016/0038-0717(69)90012-1.
- Guo Y, Bustin RM. FTIR spectroscopy and reflectance of modern charcoals and fungal decayed woods: implications for studies of inertinite in coals. Int J Coal Geol. 1998;37(1-2):29–53. doi:https://doi.org/10.1016/S0166-5162(98)00019-6.
- Chen B, Zhou D, Zhu L. Transitional adsorption and partition of nonpolar and polar aromatic contaminants by biochars of pine needles with different pyrolytic temperatures. Environ Sci Technol. 2008;42(14):5137–5143. − doi:https://doi.org/10.1021/es8002684.
- Özçimen D, Ersoy-Meriçboyu A. Characterization of biochar and bio-oil samples obtained from carbonization of various biomass materials. Renew Energy. 2010;35(6):1319–1324. doi:https://doi.org/10.1016/j.renene.2009.11.042.
- Benbi DK, Richter J. A critical review of some approaches to modelling nitrogen mineralization. Biol Fertil Soils. 2002;35(3):168–183. doi:https://doi.org/10.1007/s00374-002-0456-6.
- Manzoni S, Taylor P, Richter A, et al. Environmental and stoichiometric controls on microbial carbon-use efficiency in soils. New Phytol. 2012;196(1):79–91.,. doi:https://doi.org/10.1111/j.1469-8137.2012.04225.x.
- Benbi DK, Brar K, Toor AS, et al. Sensitivity of labile soil organic carbon fractions to long-term fertilizer, straw and manure management in rice-wheat system. Pedosphere. 2015;25(4):534–545. doi:https://doi.org/10.1016/S1002-0160(15)30034-5.
- Jindo K, Mizumoto H, Sawada Y, et al. Physical and chemical characterization of biochars derived from different agricultural residues. Biogeosciences. 2014;11(23):6613–6621. doi:https://doi.org/10.5194/bg-11-6613-2014.
- Lee JW, Kidder M, Evans BR, et al. Characterization of biochars produced from cornstovers for soil amendment. Environ Sci Technol. 2010;44(20):7970–7974. doi:https://doi.org/10.1021/es101337x.
- Yin YF, He XH, Gao R, et al. Effects of rice straw and its biochar addition on soil labile carbon and soil organic carbon. J Integrative Agric. 2014;13(3):491–498. doi:https://doi.org/10.1016/S2095-3119(13)60704-2.
- Guo J, Chen B. Insights on the molecular mechanism for the recalcitrance of biochars: interactive effects of carbon and silicon components. Environ Sci Technol. 2014;48(16):9103–9112. doi:https://doi.org/10.1021/es405647e.
- Stuart B. Modern infrared spectroscopy. 1996. Willy, New York
- Spokas KA. Review of the stability of biochar in soils: predictability of O: C molar ratios. Carbon Manage. 2010;1(2):289–303. doi:https://doi.org/10.4155/cmt.10.32.
- Joseph S, Graber ER, Chia C, et al. Shifting paradigms: development of high-efficiency biochar fertilizers based on nano-structures and soluble components. Carbon Manage. 2013;4(3):323–343. doi:https://doi.org/10.4155/cmt.13.23.
- Lü J, Li J, Li Y, et al. Use of rice straw biochar simultaneously as the sustained release carrier of herbicides and soil amendment for their reduced leaching. J Agric Food Chem. 2012;60(26):6463–6470. − doi:https://doi.org/10.1021/jf3009734.
- Knoblauch C, Maarifat A-A, Pfeiffer E-M, et al. Degradability of black carbon and its impact on trace gas fluxes and carbon turnover in paddy soils. Soil Biol Biochem. 2011; 43:1768-1778 doi:https://doi.org/10.1016/j.soilbio.2010.07.012.
- Bruun S, El-Zehery T. Biochar effect on the mineralization of soil organic matter. Pesq Agropec Bras. 2012;47(5):665–671. doi:https://doi.org/10.1590/S0100-204X2012000500005.
- Benbi DK, Yadav SK. Decomposition and carbon sequestration potential of different rice residue-derived by-products and farmyard manure in a sandy loam soil. Comm Soil Sci Plant Anal. 2015;46(17):2201–2211. doi:https://doi.org/10.1080/00103624.2015.1069322.
- Skjemstad JO, Reicosky DC, Wilts AR, et al. Charcoal carbon in US agricultural soils. Soil Sci Soc Am J. 2002;66(4):1249–1255. doi:https://doi.org/10.2136/sssaj2002.1249.
- Wiedemeier DB, Abiven S, Hockaday WC, et al. Aromaticity and degree of aromatic condensation of char. Org Geochem. 2015;78:135–143. doi:https://doi.org/10.1016/j.orggeochem.2014.10.002.
- Smith JL, Collins HP, Bailey VL. The effect of young biochar on soil respiration. Soil Biol Biochem. 2010;42(12):2345–2347. doi:https://doi.org/10.1016/j.soilbio.2010.09.013.
- Zimmerman A. Abiotic and microbial oxidation of laboratory-produced black carbon (biochar). Environ Sci Technol. 2010;44(4):1295–1301. doi:https://doi.org/10.1021/es903140c.
- Abiven S, Andreoli R. Charcoal does not change the decomposition rate of mixed litters in a mineral cambisol: a controlled conditions study. Biol Fertil Soils. 2011;47(1):111–114. doi:https://doi.org/10.1007/s00374-010-0489-1.
- Gartner TB, Cardon ZG. Decomposition dynamics in mixed species leaf litter. Oikos. 2004;104(2):230–246. doi:https://doi.org/10.1111/j.0030-1299.2004.12738.x.
- Benbi DK, Khosa MK. Effect of temperature, moisture and chemical composition of organic substrates on C mineralization in soils. Comm Soil Sci Plant Anal. 2014;45(21):2734–2753. doi:https://doi.org/10.1080/00103624.2014.950423.
- Fabbri D, Torri C, Spokas KA. Analytical pyrolysis of synthetic chars derived from biomass with potential agronomic application (biochar). relationships with impacts on microbial carbon dioxide production. J Anal Appl Pyrolysis. 2012;93:77–84. doi:https://doi.org/10.1016/j.jaap.2011.09.012.
- Nelissen V, Rütting T, Huygens D, et al. Maize biochars accelerate short-term soil nitrogen dynamics in a loamy sand soil. Soil Biol Biochem. 2012;55:20–27. doi:https://doi.org/10.1016/j.soilbio.2012.05.019.
- Nieder R, Benbi DK, Scherer W. Fixation and defixation of ammonium in soils: a review. Biol Fertil Soils. 2011;47(1):1–14. doi:https://doi.org/10.1007/s00374-010-0506-4.
- Fiorentino N, Sánchez-Monedero MA, Lehmann J, et al. Interactive priming of soil N transformations from combining biochar and urea inputs: a 15N isotope tracer study. Soil Biol Biochem. 2019;131:166–175. doi:https://doi.org/10.1016/j.soilbio.2019.01.005.
- Wang J, Zhang M, Xiong Z, et al. Effects of biochar addition on N2O and CO2 emissions from two paddy soils. Biol Fertil Soils. 2011;47(8):887–896. doi:https://doi.org/10.1007/s00374-011-0595-8.
- Brookes P. The soil microbial biomass: concept, measurement and applications in soil ecosystem research. Microb Environ. 2001;16(3):131–140. doi:https://doi.org/10.1264/jsme2.2001.131.
- Kolb SE, Fermanich KJ, Dornbush ME. Effect of charcoal quantity on microbial biomass and activity in temperate soils. Soil Sci Soc Am J. 2009;73(4):1173–1181. doi:https://doi.org/10.2136/sssaj2008.0232.
- Liang B, Lehmann J, Sohi SP, et al. Black carbon affects the cycling of non-black carbon in soil. Org Geochem. 2010;41(2):206–213. doi:https://doi.org/10.1016/j.orggeochem.2009.09.007.
- Zhang Q-Z, Dijkstra FA, Liu X-R, et al. Effects of biochar on soil microbial biomass after four years of consecutive application in the North China plain. PLoS ONE. 2014;9(7):e102062. doi:https://doi.org/10.1371/journal.pone.0102062.
- Lehmann J, Rillig MC, Thies J, et al. Biochar effects on soil biota–a review. Soil Biol. Biochem. 2011;43(9):1812–1836. doi:https://doi.org/10.1016/j.soilbio.2011.04.022.
- Zhou H, Zhang D, Wang P, et al. Changes in microbial biomass and the metabolic quotient with biochar addition to agricultural soils: a meta-analysis. Agric Ecosyst Environ. 2017; 239:80–89. doi:https://doi.org/10.1016/j.agee.2017.01.006.
- Castaldi S, Riondino M, Baronti S, et al. Impact of biochar application to a mediterranean wheat crop on soil microbial activity and greenhouse gas fluxes. Chemosphere. 2011;85(9):1464–1471. doi:https://doi.org/10.1016/j.chemosphere.2011.08.031.
- Zavalloni C, Alberti G, Biasiol S, et al. Microbial mineralization of biochar and wheat straw mixture in soil: a short term study. Appl Soil Ecol. 2011;50:45–51. doi:https://doi.org/10.1016/j.apsoil.2011.07.012.
- Dempster DN, Gleeson DB, Solaiman Z, et al. Decreased soil microbial biomass and nitrogen mineralisation with eucalyptus biochar addition to a coarse textured soil. Plant Soil. 2012;354(1–2):311–324. doi:https://doi.org/10.1007/s11104-011-1067-5.
- Nieder R, Harden T, Martens R, et al. Microbial biomass in arable soils of Germany during the growth period of annual crops. J Plant Nutr Soil Sci. 2008;171(6):878–885. doi:https://doi.org/10.1002/jpln.200700024.
- Lou Y, Joseph S, Li L, et al. Water extract from straw biochar used for plant growth promotion: an initial test. BioResources. 2015;11(1):249–266. doi:https://doi.org/10.15376/biores.11.1.249-266.
- Pietikäinen J, Kiikkilä O, Fritze H. Charcoal as a habitat for microbes and its effect on the microbial community of the underlying humus. Oikos. 2000;89(2):231–242. doi:https://doi.org/10.1034/j.1600-0706.2000.890203.x.
- Miltner A, Bombach P, Schmidt ‐BB, et al. SOM genesis: microbial biomass as a significant source. Biogeochem. 2012;111(1–3):41–55. doi:https://doi.org/10.1007/s10533-011-9658-z.
- Kindler R, Miltner A, Richnow HH, et al. Fate of gram-negative bacterial biomass in soil– mineralization and contribution to SOM. Soil Biol Biochem. 2006;38(9):2860–2870. doi:https://doi.org/10.1016/j.soilbio.2006.04.047.
- Liang C, Balser TC. Microbial production of recalcitrant organic matter in global soils: Implications for productivity and climate policy. Nat Rev Microbiol. 2011; 9(1):75–75. https://doi.org/10.1038/nrmicro2386-c1. doi:https://doi.org/10.1038/nrmicro2386-c1.
- Zheng JF, Chen JH, Pan GX, et al. Biochar decreased microbial metabolic quotient and shifted community composition four years after a single incorporation in a slightly acid rice paddy from southwest China. Sci Total Environ. 2016;571:206–217. doi:https://doi.org/10.1016/j.scitotenv.2016.07.135.
- Liu Z, Zhu M, Wang J, et al. The responses of soil organic carbon mineralization and microbial communities to fresh and aged biochar soil amendments. GCB Bioenergy. 2019;11(12):1408–1420. doi:https://doi.org/10.1111/gcbb.12644.
- Sinsabaugh RL, Manzoni S, Moorhead DL, et al. Carbon use efficiency of microbial communities: stoichiometry, methodology and modelling. Ecol Lett. 2013;16(7):930–939. doi:https://doi.org/10.1111/ele.12113.
- Gommers PJF, van Schie BJ, van Dijken JP, et al. Biochemical limits to microbial growth yields: An analysis of mixed substrate utilization. Biotechnol Bioeng. 1988;32(1):86–94. doi:https://doi.org/10.1002/bit.260320112.
- Manzoni S, Čapek P, Porada P, et al. Reviews and syntheses: Carbon use efficiency from organisms to ecosystems – definitions, theories, and empirical evidence. Biogeosciences. 2018;15(19):5929–5949. doi:https://doi.org/10.5194/bg-15-5929-2018.
- Van Bodegom P. Microbial maintenance: a critical review on its quantification. Microb Ecol. 2007;53(4):513–523. doi:https://doi.org/10.1007/s00248-006-9049-5.
- Bailey VL, Fansler SJ, Smith JL, et al. Reconciling apparent variability in effects of biochar amendment on soil enzyme activities by assay optimization. Soil Biol Biochem. 2011;43(2):296–301. doi:https://doi.org/10.1016/j.soilbio.2010.10.014.
- Chen J, Liu X, Zheng J, et al. Biochar soil amendment increased bacterial but decreased fungal gene abundance with shifts in community structure in a slightly acid rice paddy from southwest China. Appl Soil Ecol. 2013;71:33–44. doi:https://doi.org/10.1016/j.apsoil.2013.05.003.
- Shahzad SM, Khalid A, Arif MS, et al. Co-inoculation integrated with P-enriched compost improved nodulation and growth of chickpea (Cicer arietinum L.) under irrigated and rainfed farming systems. Biol Fertil Soils. 2014;50(1):1–12. doi:https://doi.org/10.1007/s00374-013-0826-2.
- Wu FP, Jia ZK, Wang SG, et al. Contrasting effects of wheat straw and its biochar on greenhouse gas emissions and enzyme activities in a chernozemic soil. Biol Fertil Soils. 2013;49(5):555–565. doi:https://doi.org/10.1007/s00374-012-0745-7.
- Oleszczuk P, Jośko I, Futa B, et al. Effect of pesticides on microorganisms, enzymatic activity and plant in biochar-amended soil. Geoderma. 2014;214–215:10–18. doi:https://doi.org/10.1016/j.geoderma.2013.10.010.
- Foster EJ, Fogle EJ, Cotrufo MF. Sorption to biochar impacts ß-glucosidase and phosphatase enzyme activities. Agriculture. 2018;8(10):158. doi:https://doi.org/10.3390/agriculture8100158.