
 ?Mathematical formulae have been encoded as MathML and are displayed in this HTML version using MathJax in order to improve their display. Uncheck the box to turn MathJax off. This feature requires Javascript. Click on a formula to zoom.
Abstract
Here we describe a pilot wetland carbon project located 30 km west of New Orleans where measurements were taken in 2013 and 2018, and applied to a carbon offset methodology published by the American Carbon Registry (ACR). Baseline emissions were modeled using values derived from scientific literature, which resulted in a net sequestration rate of 16,527 t CO2-e (tons carbon dioxide equivalents) per year if wetland greenhouse gases (CH4 & N2O) were included (619,727 over the 40-year project duration), and 5,003 t CO2-e/yr if wetland greenhouse gases were conservatively omitted (200,143 t CO2e over 40 years). Alternatively, a kriging exercise was carried out that modeled the tree and soil pools, resulting in higher net sequestration of 18,084 t CO2-e/yr with greenhouse gases (723,375 t CO2-e over 40 years), and 6,560 t CO2-e/yr if greenhouse gases were omitted (262,472 t CO2-e over 40 years). Unfortunately, the project was withdrawn, prohibiting the issuance and eventual transaction of carbon credits, due to very large uncertainty estimates mostly associated with methane and nitrous oxide emissions as well as the kriging approach since in situ sampling could not be carried out as required by the methodology. Next steps to increase the commercial viability of wetland carbon offsets include: closing knowledge gaps in wetland emissions of methane and nitrous oxide; developing means to reduce costs of monitoring, reporting and verification; fully accounting for prevented loss; developing remote sensing methods for monitoring and verification; and development of biogeochemical models to predict methane and nitrous oxide fluxes and sequestration pools. Though the project did not generate carbon credits, the results and lessons learned are intended to inform managers, and blue carbon project developers on how to develop wetland carbon credits that are high quality, economically competitive, and scientifically defensible.
Introduction
Recognition that recent global climate change and severe weather events have been exacerbated by human activities [Citation1–3] has facilitated significant growth in emissions trading programs, collectively referred to as carbon markets, in order to stem emissions [Citation4]. Projects that sequester carbon and reduce greenhouse gas emissions generate ‘carbon offsets’ that can be used to compensate for greenhouse gases emitted elsewhere [Citation5]. The carbon sequestered in vegetated coastal and marine ecosystems, specifically mangrove forests, seagrass beds, and salt marshes, has been termed ‘blue carbon’ [Citation6, Citation7]. In coastal Louisiana, blue carbon includes the carbon sequestered in soils and trees of bald cypress (Taxodium distichum) and water tupelo (Nyssa aquatica) forested wetlands, as well as freshwater emergent, brackish and saltwater wetlands. Although their global area is one to two orders of magnitude smaller than that of terrestrial forests, the contribution of vegetated coastal habitats per unit area to long-term carbon sequestration is much greater, with an estimated 50% of the carbon sequestered being stored in coastal areas and ocean bottom sediments [Citation7, Citation8].
Carbon markets provide an important and innovative approach to supplement environmental restoration and conservation. For a variety of financial, environmental, and political reasons, substantial interest exists for carbon offsets derived from nature-based solutions. For the last two decades, evolving and maturing carbon markets have supported agriculture, forestry and other land use (AFOLU) projects. Governments, environmental organizations, private companies, and carbon funds, appear to be driven by the potential that carbon offsets may both reduce the costs of achieving carbon goals and deliver new revenues. This energy for innovative and scalable solutions, combined with trends in voluntary markets that favor high-quality AFOLU projects, and the continued progress of the Paris Agreement and the emerging Carbon Offsetting and Reduction Scheme for International Aviation (CORSIA) compliance market, provide strong potential for demand of high-quality, scientifically rigorous offset credits from wetland restoration and conservation projects.
Recent developments are paving the path for carbon markets to support wetland restoration. Methods to develop a carbon offset align with the international standard for carbon offset project development, ISO 14064-2: Greenhouse gases — Part 2: Specification with guidance at the project level for quantification, monitoring and reporting of greenhouse gas emission reductions or removal enhancements (ISO 14064-2) and are detailed in what is referred to as a carbon protocol or methodology depending on the offset registry [Citation9]. In 2012, the American Carbon Registry (ACR), a leading voluntary carbon offset registry, approved the first blue carbon offset methodology that transcended forestry protocols to be specific to wetland restoration. This methodology, “Restoration of Degraded Deltaic Wetlands of the Mississippi Delta,” created the first route-to-market, opening the potential for carbon market investment into wetland restoration projects [Citation10]. To ensure quality and credit validity, protocols and methodologies typically undergo some combination of public consultation, peer review and stakeholder input to provide a transparent, rigorous scientific framework and accounting procedure for the development, verification, and monitoring of offset projects [Citation4].
Deltaic wetlands are unique among coastal wetlands in that they provide relatively permanent geologic storage of carbon, due to subsidence caused by the compaction of deltaic sediments combined with sea level rise, with burial rates as high as 17 mm/y in the Mississippi River Delta [Citation11, Citation12]. This subsidence is compensated for by soil organic matter accumulation that results from in situ production by marsh plants (autochthonous source), as well as transported into the marsh from other areas (allochthonous source). Belowground carbon accumulation is a balance between above- and belowground production and organic matter decomposition that are in turn dependent on a variety of factors such as nutrient availability, flooding status, elevation, and soil redox as well as biotic interactions [Citation13, Citation14]. Projects that increase vegetative productivity result in enhanced organic soil deposition, and geological subsidence of this organic soil as well as increasing sea level rise results in permanent carbon burial [Citation15, Citation16]. Peat soils of wetland environments have the highest C content of all the soil orders [Citation15] due to very slow organic matter decomposition [Citation13, Citation17]. This makes wetland soils an important sink for atmospheric CO2, especially in areas with high rates of subsidence [Citation15, Citation16].
However, the majority of wetlands in Louisiana are degrading, mostly from the lack of seasonal inputs of freshwater, nutrients, and sediments from the Mississippi River [Citation18–20]. Flood control levees built during the last two centuries have separated the Mississippi River from its floodplain, preventing seasonal flooding that would naturally occur [Citation21–24]. This has caused saltwater intrusion, accretion deficits, and prolonged flooding of most of the remaining wetlands [Citation18, Citation20, Citation21, Citation25]. As a consequence, approximately 30% of the Mississippi River delta plain has been lost since 1956 [Citation26, Citation27]. Other factors exacerbating wetland loss include decreased sediment supply [Citation21, Citation22, Citation28], logging [Citation20, Citation29, Citation30], deep-well fluid withdrawal associated with the oil and gas industry [Citation31–34], intentional impoundment for waterfowl management [Citation35], and herbivory by nutria [Citation36, Citation37].
Successful wetland restoration creates conditions for healthy, thriving wetland systems that are optimal for the sequestration of carbon and burial of that carbon in the soil, preventing the release of carbon to the atmosphere. Thus, the most effective method to maintain wetland carbon pools and prevent emissions to the atmosphere is to avoid conversion to open water through wetland restoration and conservation measures and sustainable management. Meanwhile, wetland ecosystems are one of the most expensive ecosystems to restore. Unfortunately, Louisiana could be more than $70 billion short of the funding needed to implement the state’s 50-year coastal protection and restoration plan [Citation38]. Because wetlands sequester large amounts of carbon in soils and plants, the growing carbon market provides a potential funding source to support restoration and conservation of these valuable ecosystems [Citation5].
The use of natural forested wetlands to process and assimilate nutrients from treated municipal effluent has been used in Louisiana for over 50 years as a cost-effective means to improve overall regional water quality while providing freshwater and nutrients to hydrologically isolated and degrading wetlands [Citation39–42]. The nutrient component of municipal effluent increases wetland vegetative productivity [Citation40–44], which leads to increased autochthonous organic matter deposition and enhanced carbon sequestration [Citation39, Citation45]. The freshwater component of treated effluent provides a buffer against saltwater intrusion events, especially during periods of drought, which are predicted to increase in frequency in the future due to global climate change [Citation3].
In 2012, funding was secured to apply the ACR Methodology to the Luling Oxidation Pond Wetlands Assimilation System. This site was the first parcel listed with ACR as part of the Forested Wetland Assimilation in the Mississippi Delta carbon offset project. This parcel served as the first wetland offset proof of concept in the nation in order to reduce risks and determine the true costs and benefits of commercial wetland offset projects. To date, there were no commercial wetland restoration offset projects globally that were developed according to a carbon methodology specific to wetlands restoration. Other wetland type projects, such as mangrove planting projects that did not impact GHG emissions were developed according to forestry methodologies leaving questions as to viability, costs, and benefits of fully accounting for dynamic wetland restoration projects that could impact GHG emissions [Citation46]. The objectives of this project were to deliver a first-of-its-kind carbon offset project for the Luling assimilation wetlands to address science gaps; “road test” the developed methodology; determine costs, benefits, and barriers to implementation; identify cost-saving measures; and produce commercially viable offsets. The goal of this project was to quantify additional carbon sequestered due to the introduction of treated municipal effluent.
Study area
This study was originally introduced by Lane et al. [Citation47] where additional information regarding the study site and methods can be found. The project area, consisting of the Luling wastewater treatment facility and receiving assimilation wetlands are located in St. Charles Parish 30 km west of New Orleans (). The facility consists of a facultative oxidation pond with a chlorination and dechlorination disinfection system with an average discharge of 6,000 m3/day (1.6 million gallons per day (MGD)). Before 2006, the treatment plant discharged into Cousin Canal, which drains into Lake Cataouatche via the Louisiana Cypress Lumber Canal (). As part of necessary upgrades, due in-part to population growth, St. Charles Parish considered various expansion options. The Parish decided the most environmentally beneficial option, with the most co-benefits to the community, was to convert the plant to a wetland assimilation system and discharge the treated effluent into the adjacent wetland property for restoration purposes.
Figure 1. Map of the Luling assimilation wetland that receive treated effluent (delineated by white arrows; map source Google Earth). White circles indicate where tree biomass and soil accretion were monitored. Red dots indicate where greenhouse gas sampling was carried out. Note project area was decreased over time hence the monitoring plots located outside of the project area.
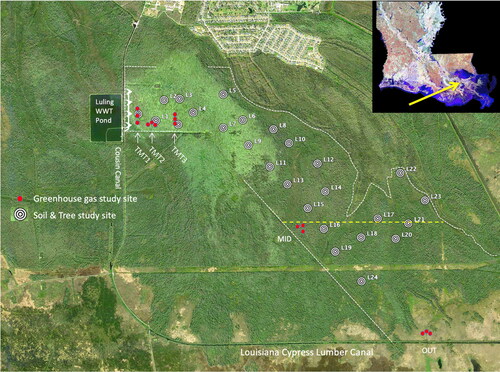
Starting in 2006, discharge from the wastewater treatment plant was rerouted from Cousin Canal to a 582.3 ha bald cypress-water tupelo dominated forested. Effluent is retained within the project boundaries by low-lying levees running along the northern, eastern, and western boundaries that prevent hydrological exchange with the surrounding landscape, except at the southernmost extent of the project area where water freely flows out of the project area into the Louisiana Cypress Lumber Canal (). The 582.3 ha project area described by Lane et al. [Citation47] was decreased to the northern 317.4 ha later in the study to try and reduce the uncertainty associated with modeling during later stages of the project development process.
St. Charles Parish began to pursue wetland assimilation for the city of Luling as a less expensive alternative to traditional tertiary treatment that also provides the multiple co-benefits of restored wetlands to the citizens of the parish, such as reduced storm surge and enhanced biodiversity of wildlife and fisheries. St. Charles Parish wished to discharge the treated effluent into an adjacent privately owned wetland property but did not have the additional funding to pay for the servitude. To allow the facility to operate the parties agreed that St. Charles Parish would use its best efforts to obtain carbon offsets on the landowner’s behalf arising out of the discharge of treated effluent from the project that results in preserved and enhanced wetlands. The public-private partnership intended to allow the Parish to pursue wetlands assimilation as a more sustainable form wastewater infrastructure than conventional treatment, while compensating the landowner for the use of their land without requiring the Parish to increase the rates that citizens pay for sanitation services.
The Luling site was the ideal proof of concept due to its size, established carbon rights, and the ability to begin monitoring net carbon impacts immediately as a retroactive project. Furthermore, a considerable amount of monitoring had been established at the projects onset and was ongoing to comply with wastewater permit regulations. It was anticipated that the site would sequester a high rate of carbon because the addition of treated effluent would provide optimal ecological conditions for the wetland whose sustainability was threatened by subsidence and saltwater intrusion.
Methods
A foundational principle underpinning high-quality offset projects is called additionality. Additionality maintains that an offset credit is granted only to the extent that the associated amount of emissions reduced or sequestered within the project boundary is additional to that which would occur without the project, or under business-as-usual conditions [Citation5, Citation46, Citation48]. This requires estimation of the carbon sequestered and greenhouse gas emissions under the “baseline scenario” (i.e. business-as-usual) and the “project scenario” (i.e. the restoration activity), with the net difference being counted towards carbon offsets [Citation15]. For this study, the project scenario was the discharge of treated municipal effluent into the receiving wetland, and the baseline scenario was the continued degradation of the wetland due to subsidence and saltwater intrusion that was projected based on peer-reviewed literature (see Baseline section below). The reporting period of this study was from 2006 to 2018 with a projected crediting period of 40 years.
Application of the methodology
The Luling Project applied methods and equations detailed in the ACR Methodology [Citation10]. This methodology applies to a wide range of restoration techniques including hydrologic management techniques that introduce freshwater, nutrients, and/or sediments to increase wetland productivity. The methodology is unique in that it employs a modular approach to customize the requirements for local conditions and different restoration techniques. The modular methodology addresses each aspect of the project from establishing a baseline, monitoring of eligible carbon pools, and estimating project emission reductions, as a discrete and independent module. The individual modules that are applicable to a specific wetland restoration project can then be selected and applied under a framework module which results in a project-specific methodology.
The baseline modules, carbon pool modules, emissions modules, and project scenario modules were applied under the umbrella framework module to create a methodology that was specific to the Luling assimilation wetlands. These modules, when used together ensure the environmental integrity and robustness of the proof-of-concept project to develop offsets that are compliance eligible and scientifically defensible. All of the applied formulas were derived from the methodology modules BL-WR-HM-WL, Estimation of baseline carbon stock changes from WR where the project activity includes hydrologic management as well as projected wetland loss for the baseline scenario; PS-WR-HM, Estimation of project scenario carbon stock changes and greenhouse gas emissions from WR with hydrologic management; CP-S, Estimation of carbon stocks in the soil organic carbon pool; CP-TB, Estimation of carbon stocks in above- and belowground tree biomass; E-E, Estimation of greenhouse gas emissions; and X-UNC-WR, Estimation of uncertainty in WR activities. For all subsequent analyses, positive carbon fluxes indicate net emission removals into the wetland, whereas negative carbon fluxes indicate net emissions to the atmosphere [Citation15].
In order to be eligible to quantify the emissions reductions and removals, the Luling Project was required to meet the applicability requirements of the ACR Methodology which included:”:
All applicable policies and legislation relevant to wetland restoration have been complied with.
Project activities were not required as part of Section 404 of the Clean Water Act to mitigate onsite or offsite impacts to wetlands.
The project activity has been implemented on degraded wetlands that are expected to remain degraded or to continue to degrade in the absence of the project.
Project lands were not cleared of trees during the 10 years preceding the project Start Date.
No drainage has occurred as part of the project activity & none of the project area has been disturbed by planting.
The ACR Methodology has an approved performance standard within the methodology, meaning that because wetland restoration is not common practice by landowners, wetland restoration projects using this methodology are deemed “beyond business as usual” and therefore additional if they pass a regulatory additionality test. There are no laws that require assimilation wetlands and thus the project passed the regulatory surplus test. Therefore, additionality for this project was satisfied according to the ACR Methodology performance standard and a regulatory additionality test [Citation49].
Carbon pools
There are five general carbon storage pools in wetlands: aboveground trees; aboveground herbaceous vegetation; surface litter; dead wood; and belowground organic soil that includes all organic matter from belowground productivity and also some organic matter produced aboveground that is buried as detritus. The carbon pools included for the Luling Project include aboveground biomass of trees and soil organic carbon, as well as methane (CH4) and nitrous oxide (N2O) emissions (). Nitrous oxide emissions have been included because they are naturally produced in wetlands and are potent greenhouse gases, 298 times as powerful as CO2, and measurement is required by all carbon accounting methods. Herbaceous vegetation, surface litter and dead wood were conservatively omitted since they were not expected to either increase nor to change due to the project activity and also were expected to be incorporated into the soil organic carbon pool over the long-term (i.e. decadal) and thus be accounted for.
Table 1. Potential carbon pools and wetland emission sources.
As stated in the WR-MF module exclusion of pools or sources may always be excluded if conservative, i.e. exclusion will tend to underestimate net greenhouse gas emissions reductions/removal enhancements. Tracts will be evaluated on an individual basis. Most wetland assimilation systems are gravity fed including at the Luling project site. Therefore, the optional greenhouse gas source of fossil fuel combustion (CO2) was deemed de minimis and was excluded.
Field monitoring analysis
The original inventory was established in 2013-2014 [Citation47]. A total of twenty-four round 0.03 ha plots (9.78 m diameter) were established where accretion and tree growth measurements were taken from 2013-2018 (). An additional six 0.33 ha plots were included that were measured regularly since project inception in 2006 as part of mandated wastewater permit monitoring required by the Louisiana Department of Environmental Quality (LDEQ). An effort was made to incorporate the long-term LDEQ monitoring plots with the newly established carbon monitoring plots in a grid fashion according to accepted wetland monitoring techniques, with the goal to integrate the long-term monitoring data with the newly established plots. Feldspar markers established in 2013 could not be found at some of the monitoring plots in 2018 either because hunters had removed the marker poles or the feldspar had sunk and dissipated into the fluid mud that was present at many of the sites. Tree biomass, soil carbon, and greenhouse gas sampling were monitored as described by Lane et al. [Citation47].
Baseline
The baseline scenario is required to be the most likely wetland management scenario in the absence of the project. In this case, the baseline scenario was the continued degradation of the wetland due to subsidence and saltwater intrusion. The BL-WR-HM-WL module was applied that quantifies a reduction in baseline sequestration over time as wetlands degrade and convert into open water and also accounts for any increase in greenhouse gas emissions that may result due to the introduction of treated municipal effluent.
Accelerating eustatic sea level rise combined with regional subsidence has led to increasing surface water levels, and most forested wetlands in coastal Louisiana are now unable to regenerate (i.e. produce new trees) due to water levels being consistently higher than the tolerance of seedlings [Citation18, Citation50]. Accelerating sea level rise is one of the greatest threats to restoration and sustainability of coastal wetlands worldwide [Citation51]. Current eustatic sea-level rise (ESLR) is between 3 and 4 mm yr−1, and there is a strong scientific consensus that the rate of ESLR will accelerate in association with global warming [Citation52]. Blum and Roberts [Citation53] predict severe wetland loss in coastal Louisiana by 2100 due to the combined effects of subsidence and sea level rise ().
Figure 2. The predicted coastline in 2100 given 1 m relative sea-level rise, no mineral sediment input and no catastrophic events (modified from [Citation53]). The yellow box indicates the location of the Luling wetland assimilation project site, which is completely submerged. It should also be noted that projected sea-level rise rates have increased.
![Figure 2. The predicted coastline in 2100 given 1 m relative sea-level rise, no mineral sediment input and no catastrophic events (modified from [Citation53]). The yellow box indicates the location of the Luling wetland assimilation project site, which is completely submerged. It should also be noted that projected sea-level rise rates have increased.](/cms/asset/40884b95-6570-4718-8ef0-cd326472d400/tcmt_a_2112292_f0002_c.jpg)
Given the above information, over the next 40-100 years the assumption was made that the Luling project area will further degrade due to subsidence, saltwater intrusion and nutrient deprivation. Over the 40-year crediting period of this project, the baseline scenario applied to this analysis assumes that without the project activity (redirecting treated municipal effluent to inhibit saltwater intrusion and enhance cypress growth) all trees will die or stop any significant growth and that half of the wetlands will be converted to open water and the remaining half transition to emergent wetlands.
Project activities at the Luling project site began in 2006 and Tierra Resources began developing the project in late 2012. Since this is a retroactive project site, a conservative approach was taken using peer-reviewed literature to determine the baseline values for carbon sequestration, as described below. These sequestration rates were then applied to the amounts of area of specific habitat types in the Luling project site area to determine baseline net carbon sequestration rates as detailed in the ACR Methodology.
Peer-reviewed literature was compiled to determine baseline values for carbon sequestration from various wetland types found across the Mississippi River delta plain, with the most recent effort to acquire additional relevant peer-reviewed literature carried out in December 2020. Google Scholar was used with a plethora of keywords to find relevant publications. Every effort was made to apply data from ecologically similar wetland systems and geographically relevant studies to our study area. However, in some cases it was not possible to use studies from the same hydrological basin or even from ecologically similar wetland systems in other regions because the studies were nonexistent. This was the case for baseline estimates of N2O, where the only study that was found [Citation54] provided two estimates of annual N2O emissions from a coastal freshwater emergent wetland located in the same watershed. No other studies were available in the scientific literature that provided N20 emission data from coastal freshwater emergent wetlands not receiving external inputs of nutrients or some other treatment that potentially impacted N2O emissions. All values were converted to tons CO2-e/ha/year. Summary statistics were carried out using JMP statistical software produced by SAS Institute, Inc. (; [Citation55]).
Table 2. Baseline carbon sequestration values derived from the scientific literature (units in tons CO2-e/ha/yr). s.e.= standard error, s.d.=standard deviation.
Project
The Luling Project site project scenario was the discharge of nutrient rich secondarily-treated wastewater effluent to degraded forested wetlands to increase tree growth and soil accretion. The project scenario module ‘PS-WR-HM: estimation of project scenario carbon stock changes and greenhouse gas emissions from wetland restoration with hydrologic management’ was applied.
The Luling Project site enhances removals of CO2 from the atmosphere by stimulating productivity and accretion. Responding to the nutrient addition of treated municipal effluent with enhanced growth, wetland plants and trees use the natural process of photosynthesis to capture atmospheric CO2 and convert it to organic tissues. Increases in above- and belowground biomass and organic soil formation lead to greater carbon sequestration than would have occurred under baseline conditions [Citation39, Citation56]. In addition, project activities prevent the area of wetlands from being lost as would occur in the baseline scenario, the ‘prevented loss’ of the carbon sequestration capacity from project wetlands was included in the carbon accounting. In the case of the Luling Project, based upon baseline data from peer-reviewed literature (i.e. ) and field data for the project scenario, wetlands receiving municipal effluent have lower greenhouse gas emissions than degraded wetlands in the baseline scenario.
Kriging analysis
In early 2018, during the validation/verification process, the verifier observed that although the plots established in 2013 were delineated in a grid fashion according to accepted wetland monitoring techniques, the monitoring plot design did not meet the statistical sampling design requirements of the carbon standards, which require randomization. Randomization in plot selection is a design-based approach to infer an unbiased estimate of carbon stock change [Citation57]; a sample of plots is randomly selected from a larger population of plots.
Another unbiased approach to inference is a model-based approach. In this approach, carbon stock change is predicted using a model of its observed relationship to certain covariates [Citation58]. The model is estimated by observing carbon stock change on a portion of plots and relating these observations to other covariate measurements made on the same plots. The estimated model is then applied to all plots from the larger population of plots. Unlike the design-based approach, the model-based approach requires covariate measurements on all plots in the population.
Dividing the project site into a population of plots, carbon stock change on neighboring plots may not be independent of each other; latent factors such as local salinity, depth of organic material and hydrology affect carbon stock change. Generally, to estimate unbiased carbon stock change, and more specifically the uncertainty in estimated carbon stock change, model-based inference requires independent measurements. Where plots have spatial dependencies and carbon stock change is not otherwise independent, models must be conditioned on latent factors to achieve conditional independence. This simply means accounting for the spatial dependence in the model.
The best unbiased linear estimator for a spatially dependent population is the kriging model [Citation59, Citation60]. The kriging model accounts for spatial dependency using a variogram. The model parameters of the variogram are estimated from observed plots and provide the conditional independence required to infer an unbiased estimate of carbon stock change. The kriging model estimates carbon stock change for unmeasured plots in the population, and not total carbon stock change across the entire population of plots comprising the project site. To estimate the total carbon stock change across the entire projects, a variation of the kriging model called block kriging is unbiased.
Where covariates are specified in the kriging model, the model is called co-kriging which generally performs better than ordinary kriging alone given a strong relationship between carbon stock change and covariates. For the Luling project site, features derived from LiDAR data were considered as covariates in a co-kriging model. These data cover the entire project site and derived features related to biomass height exhibited a moderate relationship to observed carbon stock change on measured plots.
The co-kriging model was parameterized using field monitored data collected in 2013-2014 at plots within the project area along with biomass height derived from ATLAS point data collected by the State of Louisiana between 1999 at 5 m resolution (https://atlas.ga.lsu.edu/datasets/lidar2000/). Biomass height was measured by resampling the LiDAR data to create a digital height model (DHM). The exploratory analysis inferred a quadratic relationship between accretion and DHM with a goodness of fit at 0.82 adjusted R-squared. The estimates of the preliminary model indicated the uncertainty relative to the estimated mean to be approximately 40%. It was then decided to remeasure carbon accretion in soil and biomass on existing plots inside the Luling project area and to acquire more recent lidar data to reduce uncertainty.
The refined kriging applied field data acquired in late 2018 and 2017 LiDAR data of the area provided by USGS at 1 m resolution. The size of the project was then reduced to decrease the uncertainty of the kriging model. Only the plots within the new project boundary and the one rectangular plot established in 2006 with a feldspar marker were included in the kriging analysis. Some plots within the new project boundary were excluded from the kriging because the feldspar marker at some plots either couldn’t be found within the soil cores or hunters had removed the poles marking the feldspar plots. A total of 16 plots were used for the final results (15 plots that were established in 2013 and the one LDEQ plot that was established in 2006). The plot level carbon accrual rates from trees and soils were combined into an overall plot accretion rate. This overall plot accretion rate was used to model a relationship with tree height. This model run also had an R-squared of 0.84.
From the block kriging model, the final accretion estimate across all pools was found to be 30.05 t CO2e/ha/yr, with a standard error of 12.53 tCO2e/ha/yr. To show that this estimate was unbaised, the model was cross validated. This cross validation gave a root squared mean error of 5.39 t CO2e/ha/yr. Given the estimated standard error, the RMSE is not statically significant at the 90% confidence level.
Results
The carbon sequestration and emission rates in were multiplied by the area of respective carbon pools in the study area to model the carbon sequestered and emissions in the baseline scenario (). This analysis took into account the loss of sequestration ability as half the wetland area was predicted to be lost and the other half converted from forested to emergent wetlands over the 40-year project duration. The baseline tree pool (ΔCTREE_BSL_loss) was estimated to sequester 36,450 t CO2-e over 40 years, with 1,822 t CO2-e/yr sequestered at the start of the project and dropping to zero by the end, and a mean sequestration rate of 911 t CO2-e/yr (). The baseline soil pool (ΔCSOC_BSL_loss) was estimated to sequester 82,699 t CO2-e over 40 years, with 2,899 t CO2-e/yr sequestered at the start of the project and decreasing to 1,134 t CO2-e/yr by the end, and a mean sequestration rate of 2,067 t CO2-e/yr. Emissions of greenhouse gases were an order of magnitude greater than the tree and soil pools combined, with 999,947 t CO2-e over 40 years, with 31,136 t CO2-e/yr emitted at the start of the project and 17,641 t CO2-e/yr by the end, and a mean emission rate of 24,998 t CO2-e/yr. Cumulative total carbon stock changes (ΔCbsl-WR-HM-WL) was −880,798 t CO2-e over 40 years, which equates to a mean of −22,020 t CO2-e/yr ().
Table 3. Baseline project emissions with wetland loss.
The baseline greenhouse gas emissions at the Luling project site were significantly greater than the project scenario ( and ). According to the methodology being applied, exclusion of carbon pools and emission sources is allowed subject to considerations of conservativeness and significance testing meaning that pools or sources may always be excluded if conservative, i.e. exclusion will tend to underestimate net greenhouse gas emission reductions/removal enhancements. Therefore, we report results with and without greenhouse gas emissions.
Table 4. Baseline, Project and Net emissions estimated using field data for the project activity.
Table 5. Baseline, Project and Net emissions estimated using kriging data for the project activity.
Table 6. Overall project uncertainty with and without greenhouse gases.
The project tree pool (ΔCTREE) was estimated to sequester 170,919 t CO2-e over 40 years, with an annual sequestration rate of 4,273 t CO2-e/yr (). The project soil pool (ΔCSOC) was estimated to sequester 148,373 t CO2-e over 40 years, with an annual sequestration rate of 3,709 t CO2-e/yr. Emissions of greenhouse gases for the project scenario 580,363 t CO2-e over 40 years, with an annual emission rate of 13,475 t CO2-e/yr. Cumulative total carbon stock changes with greenhouse gases (ΔCACTUAL w/GHGs) was −261,070 t CO2-e over 40 years, which equates to an annual mean rate of −5,492 t CO2-e/yr (). Cumulative total carbon stock changes without greenhouse gases (ΔCACTUAL no GHGs) was −261,070 t CO2-e over 40 years, equating to an annual mean rate of −5,492 t CO2-e/yr (). Net sequestration (i.e. project minus baseline emissions) with greenhouse gases was 619,727 t CO2-e over 40 years, with an annual mean of 16,527 t CO2-e/yr (). Net sequestration without greenhouse gases was 200,143 t CO2-e over 40 years, equating to an annual mean rate of 5,003 t CO2-e/yr.
The kriging analysis resulted in 381,577 t CO2-e over 40 years, with an annual rate of 9,539 t CO2-e/yr (). Cumulative total carbon stock changes with greenhouse gases (ΔCACTUAL w/GHGs) was −157,423 t CO2-e over 40 years, which equates to an annual mean rate of −3,935 t CO2-e/yr (). Cumulative total carbon stock changes without greenhouse gases (ΔCACTUAL no GHGs) was 381,577 t CO2-e over 40 years, equating to an annual mean rate of 9,539 t CO2-e/yr (). Net sequestration with greenhouse gases was 723,375 t CO2-e over 40 years, which equates to an annual mean of 18,084 t CO2-e/yr. Net sequestration without greenhouse gases was 262,472 t CO2-e over 40 years, equating to an annual mean rate of 6,560 t CO2-e/yr ().
Uncertainty
The module X-UNC-WR was applied to combine uncertainty information and determine an overall project uncertainty estimate of the total net greenhouse gas emissions reductions. If the calculated total project uncertainty exceeds 10% at the 90% confidence level, then the emission reductions must be adjusted to account for uncertainty as follows:
Uncertainty values differed greatly between the field collected data and the kriging uncertainty.
Leakage
Leakage was not allowed in the ACR Methodology that was being applied [Citation10]. There are no activities that are being displaced due to this project and therefore, leakage is assumed to be zero.
Buffer pool contribution
Carbon market standards require that a percentage of carbon offsets from sequestration-based projects not be sold on the carbon market and, instead, are kept in a reserve buffer pool as an insurance mechanism to guard against risk of reversal. The required buffer is based on assessed risk of reversal of carbon sequestration for each project and may decrease the volume of offsets available for sale by a minimum of 10%, the lowest buffer requirement under ACR rules, to more than 50%. This analysis applied the ACR Tool for Risk Analysis and Buffer Determination, v1.0 to determine that 17% of the contributing emission reductions must be deducted from the project’s offsets and contributed to the ACR buffer pool to guard against the risk of reversal.
Emission reduction tons (ERT)
The final amount of emission reductions that would have been generated as offsets represent the accumulated net sequestration from 2006 through 2018 adjusted for an associated uncertainty of 76.41% and buffer pool contribution of 17%. The final amount of emission reduction tons that could have been transacted was 17,935 for years 2006-2018 ().
Table 7. Number of emission reduction tons.
Table 8. Uncertainty of the baseline, project and kriging values.
Water quality & stacking Co-benefits
Most wetland restoration co-benefits, such as storm surge reduction and habitat enhancement, are difficult to quantify. However, water quality improvements are quantifiable and allowed to be “stacked” with carbon offsets to increase the dollar value of the ecosystem services that these projects provide.
Discrete water samples were taken seasonally at the discharge pipe, a treatment site located directly in the path of the effluent approximately 100 m from the discharge pipe, a mid site located directly in the path of effluent approximately 640 m from the discharge pipe, an out site where water exits the wetlands and enters the Louisiana Cypress Lumber Canal, and a reference site located to the west of the treatment pond. Mean annual surface water total nitrogen (TN) and total phosphorus (TP) concentrations (mg/L) were calculated using data from these sites from 2006 to 2018. Percent removal was multiplied by the quantity of nutrients input (kg) to calculate the quantity of nutrients removed by the wetland as follows:
It was determined that approximately 219,085 kg of TN and 55,338 kg of TP were removed between 2006 and 2018 due to implementing the restoration activity.
Discussion
Unfortunately, after approximately six rounds of verification findings the decision was made to withdraw the project. The cash value of the remaining ERTs after the large uncertainty and buffer deductions did not justify ACR’s long-term monitoring and verification requirements. According to the ACR rules, projects with a risk of reversal, such as wetlands, require monitoring and verification every 5 years over a minimum project term of 40 years [Citation49]. Although wetland carbon science continues to evolve, ACR had no mechanism to recoup the uncertainty deduction through implementing advanced monitoring and future verifications. It should be further noted that typically a project will continue to verify and register offsets throughout the crediting period which helps to defer the ongoing monitoring and verification costs. However, for this proof-of-concept project a one-time transaction was all that project partners could guarantee, and given the costs associated with monitoring and verification the long-term financial feasibility of the project was too large of a risk to bear.
While model goodness-of-fit statistics inferred a relationship between observed accretion rates and LiDAR covariates, the relatively small sample size (n = 16) and the limited spatial dispersion of sample plots contributed to uncertainty in the block kriging estimate. Incorporating higher resolution LiDAR had no effect on reducing uncertainty in the total estimated accretion rate. The first kriging model was parameterized using 5 m resolution LiDAR acquired by the State of Louisiana, while parameterization of second kriging model used 1 m resolution LiDAR acquired by USGS. The discrepancy in the date between when LiDAR was acquired and when field monitoring occurred may have also contributed to the higher uncertainty in kriging results.
The relatively high uncertainty of the baseline estimates was due to a combination of low replication and high natural variability. For example, the ex-post baseline emergent wetland N2O emission rate only had one reference [Citation54] with two values, resulting in an uncertainty of 152.5% (). Likewise, the baseline forested wetland N2O emission rate had an uncertainty of 166.2%, and baseline CH4 uncertainty was 72.7% and 109.9% for emergent and forested wetlands, respectively. In contrast, baseline soil sequestration uncertainty was 27.4% and 53.4% for emergent and forested wetlands, respectively, and baseline tree sequestration uncertainty was 33.2%. The uncertainty found in the original field monitored sample data was mostly driven by greenhouse gases that had a combined uncertainty value of 79.2% while sequestration by trees and soils had uncertainties of 25.9% and 20.6%, respectively.
Table 9. Uncertainty associated with the baseline values derived from the scientific literature.
Several changes to the project design could have led to a better outcome. One such change would have been the application of a suitable reference site for the baseline rather than using peer-reviewed literature, which would have increased monitoring costs but may have decreased uncertainty. The project developers initially considered this option but struggled finding an ideal reference site that was not influenced by nutrient rich stormwater runoff. An increased number of plots could have been installed for the initial inventory. Later analysis of the field data indicated that approximately 65 plots would have been needed to have uncertainty of <10% for sequestration by trees. Kriging could have been avoided entirely had the field monitoring plots been randomized from the project onset rather than using historical plots. Project developers learned later that site-specific historical in-situ monitoring data can only be applied to a blue carbon projects to calibrate a model or as a reference. Lastly, the fact that the project was retroactive with a large gap from the project’s start date to the actual project development process created additional challenges since ACR rules had changed requiring projects to successfully undergo validation within 3 years of the project start date.
Wetland carbon research needs
There are several recommended next steps to increase the commercial viability of wetland carbon offsets and realize the significant potential of wetlands to sequester carbon. A major goal to ensure commercial viability is to reduce project development costs and simplify monitoring, reporting and verification. Advocacy is required with the various carbon standards to make wetland carbon projects more attainable and not confined by rules that are designed for forestry projects. This includes developing rules and processes for project aggregation that are specific to wetland projects. Also, the complexities of leveraging carbon finance with government restoration funding programs needs to be addressed.
A critical component for many projects is the ability to fully account for the prevention of wetland loss [Citation9]. Wetland loss results in the loss of sequestration capacity in the future as well as the release of carbon sequestered and stored over past decades or centuries. This project was only able to account for the predicted loss of sequestration capacity and was unable to account for the release of stored carbon due to gaps in the science. Addressing this set of science gaps and incorporating results into current wetland carbon accounting protocols could optimize the quantity of offsets that can be achieved from a single restoration project. This research would also facilitate carbon offsets for wetland conservation activities that prevent wetland loss but do not significantly enhance carbon sequestration rates [Citation5]. Ultimately, providing carbon offsets for the prevented loss of wetlands is essential to providing a strong business case for carbon investment into wetlands.
Monitoring wetland carbon projects presents a unique set of significant challenges and costs. Simplifying monitoring, and the development of reliable and accurate monitoring that is less laborious particularly at remote locations is one of the biggest opportunities to reduce project development costs. Meanwhile, to date, there are no known remote sensing techniques that can quantify changes in the soil carbon pool in densely covered wetland ecosystems. Many wetland ecosystems are largely inaccessible, and even when a wetland can be accessed, monitoring techniques to quantify soil carbon are not ideal [Citation61]. For example, the feldspar marker technique does not perform well in wetland systems that do not have a dry period, as the feldspar does not consolidate and can drift vertically in the soil profile, and becomes more difficult to find over time [Citation62]. Soil carbon default factors would be very useful alternatives to the feldspar method. Developing methods to remotely monitor the carbon sequestered in wetlands would alleviate access issues and the associated safety risks for field technicians.
The variability of greenhouse gas emissions may make the monitoring of greenhouse gases to reach confidence intervals required by carbon offset markets cost prohibitive. Wetland greenhouse gas emissions vary greatly depending on a number of factors unrelated to the restoration activity, such as temperature, precipitation and barometric pressure [Citation63–65]. In general, more research is needed on CH4 and N2O emissions to reduce the uncertainty and justify the exclusion of emissions monitoring for management activities that do not increase emissions beyond the baseline scenario. The development of emission factors by restoration project type (e.g. [Citation66]), including emission factors for various baseline scenarios, would streamline wetland carbon accounting and decrease costs associated with monitoring greenhouse gases.
Adequate models that have been sufficiently validated for use in carbon markets do not exist for many wetland project types and regions. This may be partially due to a lack of reliable field data to calibrate and validate models. The use of such models could substantially reduce monitoring costs and alleviate many of the challenges observed to date. Revising government monitoring programs may address some of the issues but in general, a technology tracking database needs to be created that allows for the management of large volumes of information associated with wetlands to be accessed in a systematic fashion.
Both ACR and the California Air Resources Board (ARB) cap and trade program currently only accept projects with overall (baseline and project) uncertainty of <20% [Citation49]. The monitoring that is required to reach this level of certainty in dynamic wetland ecosystems may be unattainable, or if so, cost-prohibitive. Due to the high variability and thus high uncertainty of wetland carbon data, carbon market standards need to provide mechanisms to recoup uncertainty deductions as the science and advanced monitoring techniques continue to evolve. This would encourage project developers to begin to develop projects in light of evolving science. In general, carbon standards need to recognize that wetlands are far more dynamic ecosystems than forests and will require more flexibility to increase project adoption rates.
Furthermore, many wetland systems have long-term historical monitoring data that can be invaluable. Mechanisms need to be developed to apply historical monitoring data. This can likely be addressed at the onset of a project by proper monitoring plot design or by using this data to validate/calibrate models.
Conclusions
The potential for a wetland restoration project to benefit from the carbon market depends not only on the potential of the project to maintain and increase sequestered carbon, but also on the carbon standard rules for inclusion of projects in carbon market participation, such as eligible start date, easement type, standardized emissions factors, and the use of federal funding in project implementation. Many factors can influence the amount of funding that a wetland carbon project receives including the costs of monitoring, documenting, and selling verified carbon offsets to market. Other major factors include the market price of the carbon offset, whether prevented wetland loss can be included in carbon accounting, and finally the total area of wetlands that can be successfully restored for the project life.
Global pressure remains to reduce greenhouse gases as recognition of the role that wetlands can have in climate change mitigation continues to grow. Wetlands can reduce greenhouse gas emissions while providing multiple climate adaptation benefits, such as storm surge protection, water quality improvement, and floodwater retention, that increase the resiliency of the built environment and hence the economy. The momentum for innovative solutions, together with trends in voluntary markets favoring high-quality land use and forestry projects and the continued progress of emission trading markets, provides strong potential for support of high-quality, scientifically rigorous offsets from wetland restoration carbon projects. Carbon finance has substantial potential to provide important revenue to support wetland restoration that will likely lead to new public-private paradigms that leverage carbon finance with government restoration dollars.
Acknowledgements
The field component of this study was funded by Entergy Corporation through its Environmental Initiatives Fund.
Disclosure statement
No potential conflict of interest was reported by the author(s).
Data availability statement
The data that support the findings of this study have been deposited to the Dyrad depository (doi:10.5061/dryad.k6djh9w7k).
Refernces
- Emanuel K. Increasing destructiveness of tropical cyclones over the past 30 years. Nature. 2005;436(7051):686–688. doi:10.1038/nature03906.
- Oreskes N. The scientific consensus on climate change. Science. 2004;306(5702):1686–1686. doi:10.1126/science.1103618.
- IPCC (Intergovernmental Panel on Climate Change). Climate change 2013: the physical science basis. In: Contribution of working group 1 to the fifth assessment report of the intergovernmental panel on climate change. Cambridge, UK: Cambridge University Press; 2013. p. 1535. .
- Gillenwater M, Broekhoff D, Trexler M, et al. Policing the voluntary carbon market. Nature Clim Change. 2007;1(711):85–87. doi:10.1038/climate.2007.58.
- Murray BC, Pendleton L, Jenkins WA, et al. Green payments for blue carbon: economic incentives for protecting threatened coastal habitats. Nicholas Institute for Environmental Policy Solutions. Durham, NC: Duke University; 2011. (Report NI R 11-04).
- Sifleet S, Pendleton L, Murray BC. State of the science on coastal blue carbon: a summary for policy makers. Nicholas Institute for Environmental Policy Solutions. Durham, NC: Duke University; 2011. (Report NI R 11-06).
- Mcleod E, Chmura GL, Bouillon S, et al. A blueprint for blue carbon: toward an improved understanding of the role of vegetated coastal habitats in sequestering CO2. Front Ecol Environ. 2011;9(10):552–560. doi:10.1890/110004.
- Nellemann C, Corcoran E, Duarte CM, et al. (Eds). Blue carbon. A rapid response assessment. United Nations Environment Programme, GRID-Arendal; 2009, www.grida.no.
- Sapkota Y, White JR. Carbon offset market methodologies applicable for coastal wetland restoration and conservation in the United States: a review. Sci. Total Environ. 2020;701:134497. doi:10.1016/j.scitotenv.2019.134497.
- Mack SK, Lane RR, Day JW. Restoration of degraded deltaic wetlands of the Mississippi Delta v2.0. American Carbon Registry (ACR). Arlington, VA: Winrock International; 2012.
- Shinkle KD, Dokka RK. Rates of vertical displacement at benchmarks in the lower Mississippi valley and the northern Gulf coast. National oceanic and atmospheric administration (NOAA) technical report NOS/NGS 50; 2004. p. 135.
- Törnqvist TE, Wallace DJ, Storms JEA, et al. Mississippi Delta subsidence primarily caused by compaction of holocene strata. Nature Geosci. 2008;1(3):173–176. doi:10.1038/ngeo129.
- Mitsch WJ, Gosselink JG. Wetlands. Hoboken, NJ: John Wiley & Sons; 2015.
- Ren L, Jensen K, Porada P, et al. Biota-mediated carbon cycling - a synthesis of biotic-interaction controls on blue carbon. Ecol Lett. 2022;25(2):1–20.
- Bridgham SD, Megonigal JP, Keller JK, et al. The carbon balance of North American wetlands. Wetlands. 2006;26(4):889–916. doi:10.1672/0277-5212(2006)26[889:TCBONA.2.0.CO;2]
- Hansen VD, Nestlerode JA. Carbon sequestration in wetland soils of the Northern Gulf of Mexico coastal region. Wetlands Ecol Manage. 2014;22(3):289–303. doi:10.1007/s11273-013-9330-6.
- Reddy KR, DeLaune RD. Biogeochemistry of wetlands: Science and applications. Boca Raton, FL: CRC Press; 2008.
- Conner WH, Duberstein JA, Day JW, et al. Impacts of changing hydrology and hurricanes on Forest structure and growth along a flooding/elevation gradient in a South Louisiana forested wetland from 1986 to 2009. Wetlands. 2014;34(4):803–812. doi:10.1007/s13157-014-0543-0.
- Shaffer GP, Day JW, Mack S, et al. The MRGO navigation project: a massive human-induced environmental, economic, and storm disaster. J Coastal Res. 2009a;10054:206–224. doi:10.2112/SI54-004.1.
- Shaffer GP, Wood WB, Hoeppner SS, et al. Degradation of baldcypress-water tupelo swamp to marsh and open water in southeastern Louisiana, USA: an irreversible trajectory? J Coastal Res. 2009b;10054:152–165. doi:10.2112/SI54-006.1.
- Day JW, Gunn JD, Folan WJ, et al. Emergence of complex societies after sea level stabilized. Eos Trans AGU. 2007;88(15):169–170. doi:10.1029/2007EO150001.
- Kesel RH. The decline in the suspended load of the lower Mississippi river and its influence on adjacent wetlands. Environ Geol Water Sci. 1988;11(3):271–281. doi:10.1007/BF02574816.
- Kesel RH. The role of the lower Mississippi river in wetland loss in southeastern Louisiana. Environ Geol Water Sci. 1989;13(3):183–193. doi:10.1007/BF01665368.
- Mossa J. Sediment dynamics in the lowermost Mississippi river. Engin Geol. 1996;45(1–4):457–479. doi:10.1016/S0013-7952(96)00026-9.
- Roberts HH. Dynamic changes of the holocene Mississippi river Delta plain: the Delta cycle. J Coastal Res. 1997;13:605–627.
- Barras JA, Bernier JC, Morton RA. Land area change in coastal Louisiana - a multidecadal perspective (from 1956 to 2006). U.S. Geological Survey Scientific Investigations Map 3019, scale 1:250,000. Reston, VA: U.S. Geological Survey, pamphlet, 2008:14.
- Couvillion BR, Barras JA, Steyer GD, et al. Land area change in coastal Louisiana from 1932 to 2010: U.S. Geological Survey Scientific Investigations Map 3164, scale 1:265,000, 12 p. Reston, VA: U.S. Geological Survey, pamphlet; 2011.
- Meade RH, Moody JA. Causes for the decline of suspended-sediment discharge in the Mississippi river system, 1940–2007. Hydrol Processes. 2010;24:35–49.
- Burns AC. Frank B Williams, Cypress Lumber King. J Forest History. 1980;24(3):127–133. doi:10.2307/4004517.
- Mancil E. Pullboat logging. J Forest History. 1980;24(3):135–141. doi:10.2307/4004518.
- Turner RE, Swenson EM, Lee JM. A rationale for coastal wetland restoration through spoil bank management in Louisiana, USA. Environ Manage. 1994;18(2):271–282. doi:10.1007/BF02393768.
- Day JW, Britsch LD, Hawes S, et al. Pattern and process of land loss in the Mississippi Delta: a spatial and temporal analysis of wetland habitat change. Estuaries. 2000;23(4):425–438. doi:10.2307/1353136.
- Morton RA, Buster NA, Krohn DM. Subsurface controls on historical subsidence rates and associated wetland loss in southcentral Louisiana. Gulf Coast Assoc Geol Soc Transact. 2002;52:767–778.
- Chan AW, Zoback MD. The role of hydrocarbon production on land subsidence and fault reactivation in the Louisiana coastal zone. J Coastal Res. 2007;23:771–786.
- Boumans RM, Day JW. Effects of two Louisiana marsh management plans on water and materials flux and short-term sedimentation. Wetlands. 1994;14(4):247–261. doi:10.1007/BF03160631.
- Shaffer GP, Sasser CE, Gosselink JG, et al. Vegetation dynamics in the emerging Atchafalaya Delta, Louisiana, USA. J Ecol. 1992;80(4):677–687. doi:10.2307/2260859.
- Evers DE, Sasser CE, Gosselink JG, et al. The impact of vertebrate herbivores on wetland vegetation in Atchafalaya Bay, Louisiana. Estuaries. 1998;21(1):1–13. doi:10.2307/1352543.
- Davis JL, Currin CA, O’Brien C, et al. Living shorelines: coastal resilience with a blue carbon benefit. PLoS ONE. 2015;10(11):e0142595. doi:10.1371/journal.pone.0142595.
- Day J, Ko J-Y, Rybczyk J, et al. The use of wetlands in the Mississippi Delta for wastewater assimilation: a review. Ocean & Coastal Manage. 2004;47(11–12):671–691. doi:10.1016/j.ocecoaman.2004.12.007.
- Hunter RG, Day JW, Lane RR, et al. Impacts of secondarily treated municipal effluent on a freshwater forested wetland after 60 years of discharge. Wetlands. 2009a;29(1):363–371. doi:10.1672/08-184.1.
- Hunter RG, Lane RR, Day JW, et al. Nutrient removal and loading rate analysis of Louisiana forested wetlands assimilating treated municipal effluent. Environ Manage. 2009b;44(5):865–873. doi:10.1007/s00267-009-9348-y.
- Shaffer GP, Day JW, Hunter RG, et al. System response, nutria herbivory, and vegetation recovery of a wetland receiving secondarily-treated effluent in coastal Louisiana. Ecol Engin. 2015;79:120–131. doi:10.1016/j.ecoleng.2015.04.001.
- Hesse ID, Day JW, Doyle TW. Long-term growth enhancement of baldcypress (Taxodium distichum) from municipal wastewater application. Environ Manage. 1998;22(1):119–127. doi:10.1007/s002679900089.
- Lundberg CJ. Using secondarily treated sewage effluent to restore the baldcypress-water tupelo swamps of the Lake Pontchartrain Basin: a demonstration study [MS thesis]. Hammond: Southeastern Louisiana University; 2008. p. 85.
- Rybczyk JM, Cahoon DR. Estimating the potential for submergence for two wetlands in the Mississippi River Delta. Estuaries. 2002;25(5):985–998. doi:10.1007/BF02691346.
- Mack SK, Yankel C, Lane RR, et al. Carbon market opportunities for Louisiana’s coastal wetlands. New Orleans, LA: Entergy; 2015.
- Lane RR, Mack SK, Day JW, et al. Carbon sequestration at a forested wetland receiving treated municipal effluent. Wetlands. 2017;37(5):861–873. doi:10.1007/s13157-017-0920-6.
- Murray BC, Sohngen B, Ross MT. Economic consequences of consideration of permanence, leakage and additionality for soil carbon sequestration projects. Climatic Change. 2007;80(1–2):127–143. doi:10.1007/s10584-006-9169-4.
- American Carbon Registry (ACR). Validation and Verification Standard Version 1.1. Arlington, VA: Winrock International; 2018.
- Conner WH, Toliver JR. Observations on the regeneration of Baldcypress (Taxodium distichum [L.] rich.) in Louisiana swamp. Southern J Appl Forestry. 1990;14(3):115–118. doi:10.1093/sjaf/14.3.115.
- Blum MD, Roberts HH. The Mississippi Delta region: past, present, and future. Annu Rev Earth Planet Sci. 2012;40(1):655–683. doi:10.1146/annurev-earth-042711-105248.
- FitzGerald DM, Fenster MS, Argow BA, et al. Coastal impacts due to sea-level rise. Annu Rev Earth Planet Sci. 2008;36(1):601–647. doi:10.1146/annurev.earth.35.031306.140139.
- Blum MD, Roberts HH. Drowning of the Mississippi Delta due to insufficient sediment supply and global sea-level rise. Nature Geosci. 2009;2(7):488–491. doi:10.1038/ngeo553.
- Smith CJ, DeLaune RD, Patrick WH. Nitrous oxide emission from Gulf Coast wetlands. Geochimica et Cosmochimica Acta. 1983;47(10):1805–1814. doi:10.1016/0016-7037(83)90028-5.
- Sall J, Stephens M, Lehman A, et al. JMP start statistics: a guide to statistical and data analysis using JMP. 6th ed. Cary, NC: SAS Institute Inc; 2017. p. 660.
- Morris JT, Sundberg K, Hopkinson CS. Salt marsh primary production and its responses to relative sea level and nutrients in estuaries at Plum Island, Massachusetts, and North inlet, South Carolina, USA. oceanog. 2013;26(3):78–84. doi:10.5670/oceanog.2013.48.
- Cornfield J. On samples from finite populations. J Am Stat Assoc. 1944;39(226):236–239. doi:10.1080/01621459.1944.10500680.
- Casella G, Berger RL. Statistical inference. 2nd ed. Pacific Grove, CA: Duxbury Press; 2002.
- Burgess TM, Webster R. Optimal interpolation and isarithmic mapping of soil properties. J Soil Sci. 1980;31(2):333–341. doi:10.1111/j.1365-2389.1980.tb02085.x.
- Bailey TC, Gatrell AC. Interactive spatial data analysis. Longman Group Limited. 1995;413(8):176–195.
- Chatterjee A, Lal R, Wielopolski L, et al. Evaluation of different soil carbon determination methods. Crit Rev Plant Sci. 2009;28(3):164–178. doi:10.1080/07352680902776556.
- Lynch JC, Hensel PF, Cahoon DR. The surface elevation table and marker horizon technique: A protocol for monitoring wetland elevation dynamics. Natural Resource Report NPS/NCBN/NRR—2015/1078. National Park Service, Fort Collins, Colorado; 2015.
- Leventhal JS, Guntenspergen GR. Seasonal methane emissions by diffusion and ebullition from oligohaline marsh environments in coastal Louisiana. Geochem Soc Special Publications. 2004;9:389–408.
- Davidson EA, Janssens IA. Temperature sensitivity of soil carbon decomposition and feedbacks to climate change. Nature. 2006;440(7081):165–173. doi:10.1038/nature04514.
- Kayranli B, Scholz M, Mustafa A, et al. Carbon storage and fluxes within freshwater wetlands: a critical review. Wetlands. 2010;30(1):111–124. doi:10.1007/s13157-009-0003-4.
- Suir GM, Sasser CE, DeLaune RD, et al. Comparing carbon accumulation in restored and natural wetland soils of coastal Louisiana. Int J Sediment Res. 2019;34(6):600–607. doi:10.1016/j.ijsrc.2019.05.001.