
Abstract
As the threat of irreversible climate change has increased over time, the UK has continued to set increasingly ambitious policies to reduce its carbon emission. An assessment of mitigation progress to date at the local authority level clarifies the factors that have affected greenhouse gas (GHG) emissions on the path to carbon neutrality. This research uses regression analyses between local authorities’ GHG emission redcutions and selected explanatory variables (including population density, household income, and manufacturing employment) identified from the literature to explore mitigation performance over time, focusing on GHG emissions changes between 2005 and 2016. Substantial and relatively consistent GHG emissions reductions were achieved in this time frame, with average total reductions across UK local authorities of 31.2%. Population density was moderately-to-strongly correlated with the success of transportation GHG emissions mitigation, though this sector has seen the smallest percentage declines over this period. Local authorities with densities below 25 inhabitants per hectare were generally among the poorest performers in transportation GHG mitigation. This underscores the need to support remote working and electrification of personal transportation in areas where public/active transportation options are not viable alternatives. Furthermore, consideration of population density in conjunction with domestic and urban planning will allow for future emissions reductions to occur across the UK. Fundamentally, GHG emissions reductions to date are largely driven by historic factors (density), shifting economic structures (deindustrialisation), and centralised initiatives (decarbonisation of electricity generation).
Introduction
The UK parliament has declared a climate emergency in response to increasing calls for action to mitigate the worst impacts of climate change, and increased its greenhouse gas (GHG) emissions reduction ambition to achieve carbon neutrality by 2050 [Citation1,Citation2]. Correspondingly, Local Authorities (LAs) have also begun declaring “climate emergencies” in recognition of their role as the drivers of national GHG emissions, with more than 300 LAs having done so by February 2021 [Citation3]. As a result, many have an accelerated timeline to achieve net zero emissions at the local level, such as by 2030. To meet the net zero target, an understanding of what has driven reductions in UK GHGs to date is vital.
To achieve deep reductions in emission levels towards the national 2050 target, the vast breadth of UK LAs must achieve dramatic reductions in GHGs, further to what has already been achieved. The UK has been lauded for its substantial achievements to date in GHG emissions mitigation, achieving a 38% reduction in since 1990 [Citation4]. Most UK LA direct carbon emissions (scope 1 & 2) can be attributed to the domestic, transport, and industrial/commercial sectors, with agriculture playing a smaller role overall. As well, each LA has unique characteristics that influence their GHG emissions reductions. Moreover, different strategies are being employed regionally and locally throughout the UK to mitigate GHGs [Citation5]. An exploration of the degree to which UK LAs have been successful over the past decade will aid in developing an understanding of the options and challenges for deeper emissions reductions.
Myriad factors influence the GHG emissions of an urban area. Some of the key drivers of urban GHG emissions include income [Citation6,Citation7], population change [Citation7,Citation8], population density [Citation9,Citation10]; however, whilst drivers of emissions have been well-explored, there has not yet been a nation-wide urban-level analysis of GHG emissions reductions; this would enable an understanding of how emissions reductions have varied geographically. Looking at UK LAs over the past decade, greater clarity can be gained on the conditions within urban areas that affect their relative degrees of success in GHG mitigation. This study is the first that we have identified that has looked at country-wide drivers of urban GHG emissions mitigation, exploring whether the factors that are currently understood to drive urban emissions are the same as those that affect mitigation.
This study investigates changes in domestic, commercial/industrial, and transportation sector emission levels in UK LAs between 2005 and 2016, by examining LAs according to their success in GHG reductions and the factors that underpin these changes. These factors are assessed against emissions mitigation (per capita) and include population density, manufacturing employment, gross disposable household income, and climate change preparedness scores. This examination follows from established relationships between emitting sectors and their associated drivers (discussed in further detail in the literature review - see below). Conclusions will be drawn from this about the contributions made and challenges faced by different LAs in meeting their net-zero targets. We expect this work to be relevant to municipal decision makers, urban planners, engineers, and other stakeholders interested in understanding the factors affecting UK LA GHG emissions mitigation. Readers will also find some UK-specific lessons are transferable to other jurisdictions with similar urban attributes.
Literature review
The transition to a resilient, sustainable, and low-carbon future requires the active participation of actors at every level of governance [Citation11,Citation12]. In order to meet international climate targets, local government and community groups need to take leading roles in influencing and encouraging the efficient use of energy, creation of relevant new jobs, skills enhancement, and access to renewable energy [Citation13]. Since Local Authorities (LAs) in the UK have been dependent on fossil fuels to support most tertiary energy demand, the energy sector poses a great challenge to carbon reductions. Promisingly, carbon emissionsFootnote1 in 370 out of 391 LAs in the UK have steadily decreased since 2005 [Citation4]. The UK Cities Outlook shows that cities tend to emit less CO2 per capita than other urban areas of the country; although citiesFootnote2 accounted for 54% of the UK’s population in 2015, they only accounted for 45.5% of total CO2 emissions [Citation14]. This is mostly due the lower share of industrial and commercial activities and transport in more urbanized areas.
There have been many initiatives and funding schemes made available by the UK Government in the last few years to support independent community schemes such as the Community Renewable Initiative, the Energy Saving Trust’s Community Action for Energy and Green Communities programmes, Green Streets initiative, as well as the national Green Deal and Green Homes Grant [Citation13, Citation15]. Initiatives led by the community afford LAs the opportunity to increase awareness by engaging and educating community members on the importance of a combined effort in achieving GHG emission reductions [Citation16]. However, these local initiatives have also relied heavily on volunteers due to a lack of skilled workers in GHG mitigation. There is also a lack of an established infrastructure for assistance, so community-led programs have the potential to fail due to lack of institutional support and long-term funding [Citation17]. It should be noted that substantial reductions can and have been achieved though centralized measures at higher levels of government (e.g., electricity grid or natural gas decarbonization). It is valuable to understand the drivers of activities that release GHG emissions towards mitigating these with such policies and programmes.
Drivers of urban GHG emissions
In order to understand current levels of GHG emissions and their mitigation, it is important to identify the key sources of emissions and what drives them. A number of global analyses have demonstrated how urbanisation is linked to emissions growth [Citation7, Citation18,Citation19]. There are numerous CO2 emissions sources from urban areas associated with fossil energy combustion, and in the UK these can be broadly classified into the domestic, transport, and industrial & commercial sectors, as they have been categorised in LA GHG inventories [Citation4]. What follows is a review of the drivers of these emissions sources within urban areas, towards understanding the implications of these drivers in emissions mitigation.
Transportation demand
Transport is a significant contributor to GHGs in the UK. In 2017, transport accounted for 34% of carbon dioxide emissions [Citation20]. The number of vehicles on UK roads is increasing; however, the efficiency of passenger vehicles is also improving, with the net result of decreased GHG emissions [Citation4]. Furthermore, air transport also contributes significantly to total transport emissions. In 2004, aviation produced a total of 35 million tonnes of CO2 in 2011, 6% of the UK total [Citation21]. Aviation is not considered under the scope 1 & 2 emissions of the LA inventories examined here.
Commercial & industrial activitiy
Commercial & industrial activity are generally concentrated within certain areas, specifically within Northern Ireland, Wales, and Yorkshire and the Humber [Citation4]. Levels of GHG emissions can primarily be attributed to industrial & commercial electricity consumption. However, due to the transition away from coal as a source for electricity production towards gas and renewable energy, related emissions have been reduced. Furthermore, between 2005 and 2016 CO2, these emissions declined dramatically in regions such as the North East of the UK due to industry closures. Despite this, in 2016, a total of 38% of end user emissions assigned to LAs were attributed to commercial & industrial activity.
Income
The affluence of an area is a further element for consideration when exploring emission levels; being able to afford to consume both essential and luxury energy end-use technologies (e.g., more/larger houses/cars, as well as lower cost constraints on their operation) tends to drive the consumption of these. Research from global cities suggested that those with higher per capita gross domestic product (GDP) would generally have higher per capita emissions [Citation6,Citation7]. Kennedy et al, however, show significant variation as their study explored a range of cities at varying stages of economic development [Citation6]. Jones and Kammen also found this relationship within US households; households in urban areas were generally wealthier and therefore produced higher emission levels [Citation10]. Goldstein et al found similar trends using US household level data [Citation22]. UK studies from Baiocchi et al, Dixon and Minx et al, demonstrated this relationship as well [Citation9, Citation23,Citation24]; higher income households were shown to have higher CO2 emission levels. Similar results are found in the developing world, with national level data from Ghana and Uganda [Citation19, Citation25,Citation26]. Minx et al also highlighted the impact of income on the carbon footprint of municipalities (i.e., emissions associated with consumption activities) [Citation24]; however, their study emphasised that income was not more important than other socio-economic factors such as education and household size. A study by O’Neill et al. suggested that current UN projections for urbanisation to 2100 would lead to substantial increases in absolute emissions, including by more than 25% in the case of China [Citation8]; in their model, the availability of labour to support economic activity was identified as the primary driver.
As shown within this literature, income is positively correlated with (consumption-related) GHG emission levels, with urbanisation serving as an important driver of income generation. However, further clarity is needed on how income influences GHG mitigation; for example, many studies have found that income plays a role in the adoption of energy efficiency measures [Citation27]. The analysis of economic indicators, such as gross disposable household income (GDHI) and its relationship with GHG mitigation over time, would indicate whether income can enable reductions as well as emissions.
Population change / urbanisation
In addition to the absolute population of an urban area [Citation23], population change also influences GHG emission levels [Citation7,Citation8]. Increased population growth globally will lead to increased energy and resource demands and consequently higher emissions levels. Further, to facilitate the economic and resource flows of an increasing population, development of infrastructure will be required, leading to further emissions. The UK is a mature economy and is therefore unlikely to undergo significant economic growth in the near term; however, the population is continuing to rise. The UK population is expected to grow to 70 million people by 2029, with the current total at around 66 million [Citation28]. Further, for England, 2001–2015 population growth within predominantly urban areas was nearly 250% greater than in more rural areas [Citation29]. For example, the population of Liverpool (a major UK city) grew by 181% from 2002 to 2015 [Citation30]. As a result of this trend, urban density is expected to increase as well, and has already been observed in recent years.
Population density
Population density is a further key factor which influences carbon emission levels. This was outlined by Baiocchi et al and Dixon, higher density areas in England and the UK, respectively, tend to have lower household carbon emission levels [Citation9, Citation23]. Furthermore, the former study shows that emission levels are lower when population density are above a certain threshold at a district scale. Jones and Kammen’s examination into urban density and household emissions within the United States produced similar results [Citation10]; cities were found to have lower carbon footprints in comparison to suburban areas. However, they emphasise that other factors, such as land area, location, and distribution of housing emissions, also need to be recognised when considering carbon emissions and mitigation strategies [Citation10].
Electricity grid intensity
The electricity grid has an important role in supporting the energy needs of residential, commercial, and industrial consumers within the UK. It also significantly influences future emissions levels, as highlighted by Sithole et al., who suggested the reduction of grid intensity is vital towards meeting the previous 80% emissions target by 2050, let alone the current net-zero target [Citation31]. Demand on electricity grid will increase over time due to the push for electrification of energy end uses (i.e., heating and transport) globally [Citation32,Citation33]. With primary energy demand for electricity projected to reach 377 TWh, in 2050 in comparison to 2010 levels at 345 TWh, decarbonisation of the grid will be essential [Citation31]. As mentioned above, the UK grid has seen the prevalence of coal decrease due to concerns over its environmental impacts, leading to lower average carbon intensity levels [Citation34].
The significance of the electricity grid is further explained by Hawkins et al. in relation to electric vehicles (EVs) [Citation35]. EVs are commonly understood to be a crucial technology for decarbonising the national vehicle fleet [Citation33]. However Hawkins et al. show that electric vehicles can produce life cycle GHG emissions that are on the same order as diesel vehicles if coupled with a high carbon-intensity of the electricity supply [Citation35]. Further, emissions may even grow if annual vehicle miles travelled increases; this is a risk highlighted in the Department for Transport’s strategy [Citation33]. In order to reach the 2050 targets, the Committee on Climate Change stated that GHG intensity of electricity generation would have to fall to 50-100 kg CO2 per megawatt hour by 2030 [Citation36].
Deindustrialisation
While growth in industrial activity has been demonstrated to increase national GHG emissions in a number of studies [Citation18, Citation26, Citation37], deindustrialisation within the UK is a further factor that has influenced GHG emissions reductions. In the fallout of the 2007–2008 global credit crises, many industrial facilities were closed and consequently lead to a reduction in industrial emissions [Citation4]. This follows a persistent shift in the UK economy over the past several decades from manufacturing towards commercial activities.
Target setting and mitigation/adaptation strategies
Target setting and mitigation strategies can also guide carbon emission reductions [Citation12]. As highlighted by Quéré et al. in their study of 18 countries, there was a clear relationship between the presence of climate policy frameworks and decreases in total emission levels [Citation38]. Strong political will driving mitigation policies and strategies increased the likelihood of their success. Other stakeholders, such as international environmental non-governmental organisations and other civil society organisations, can also promote strategies to reduce carbon emissions [Citation39]. At an international level, the UK stands out from other European countries due to the quantity of mitigation and adaptation strategies it produces; following a study from Heidrich et al. that rated 30 UK urban areas on the quality of their climate change preparedness [Citation40], a survey of European cities found that the UK had the highest proportion (93%) of cities with mitigation strategies in the continent [Citation41].
Other drivers
The geography of an urban area is another factor that will impact upon carbon emissions [Citation5]. For example, ocal climate will drive energy demand and emissions associated with space heating and cooling in buildings; correspondingly, energy demand of buildings is significant, contributing around 33% of global energy-related emissions [Citation42]. By 2030, it is expected that the UK’s office cooling requirements will increase while heating requirements will decrease in southern regions due to a warmer climate [Citation43]. This suggests net changes in energy requirements could balance to a relatively low figure, when considering the shift of space conditioning energy demand from natural gas-based heating to electricity-based cooling. This supports the previously mentioned study from Isaac and Vuuren regarding the net changes in emissions [Citation44].
Consumer habits are a further source of GHG emissions as shown within recent studies. Barrett et al suggest 20-25% of UKCO2 emissions are embedded within imports [Citation45]. Increases in globalised trade and consumer demands could widen this share. Minx et al highlight how household consumption amounts to 70% of the UK’s carbon footprint [Citation24]. A large quantity of LAs in the UK has become net importers of emissions as the country has developed towards a service-based economy. Hence, there is an increased the share of emissions embedded within global supply chains [Citation46].
The UK’s aged building stock also contributes to overall carbon emission levels. Approximately 45% of the UK’s total carbon emissions are attributable to the heating of spaces, movement of air and water, and appliance use in buildings [Citation47]. The age and quality of the building stock can heavily influence the demands for these energy services and their associated emissions levels. For example, UK historic dwellings account for 20% of the total housing stock [Citation48]. Meanwhile, research suggests that historic buildings are the segment of the building stock in the worst state of repair, leading to an outsized contribution to GHG emissions [Citation49].
Application to this study
In this study, selected drivers identified in the above sections will be examined as they pertain to domestic, commercial/industrial, and transportation emissions across LAs in the UK. From these, it can be better understood where they have influenced GHG reductions and what this suggests for efforts to achieve carbon neutrality.
Materials and methods
Analyses of success in LA GHG emissions mitigation is conducted across various sectors, using the relationships with emissions sources identified in the literature review above. The sources of data used for this study were primarily from government reports and data sets that are outlined in . The principle data source used for GHG analysis was the “UK local authority and regional carbon dioxide emissions statistics; 2005-2016”; this annual report is provided by the Department for Business, Energy and Industrial Strategy (BEIS) and includes GHG emissions estimates across the Domestic, Transport, and Industrial & Commercial sectors from 2005-2016 (BEIS, 2018a). The data provided in the report is based upon four main sources: BEIS subnational electricity and gas consumption statistics, emissions distribution maps and land use, land use change, and forestry regional data [Citation4]. This report allows for spatially disaggregated (by local authority) trend analyses to be completed across more than a decade’s worth of emissions inventories. All GHG inventory data follow a consistent quantification method, which is described in the BEIS technical report of the emissions inventory [Citation4].
Table 1. Sources of data used on the analysis of domestic GHG emissions.
Analysis of performance
This research primarily focuses on carbon dioxide emissions from LAs to determine if trends were evident with the identified explanatory variables. In the first stage of analysis, descriptive statistics were used to provide a summary of emissions reductions across LAs; averages, standard deviations, and medians are used to make comparisons between LAs across the UK, between nations, and between regions. Collectively, this analysis provides an overall understanding of the emission trends across the UK.
For the next stage of analysis, linear regression was completed using Microsoft Excel version 16.16.6. This was applied to CO2 emission reductions and potential emissions drivers (explanatory variables) using the p-value to describe the statistical significance of these. A 95% confidence interval was applied (p < 0.05) when determining statistical significance (i.e. rejecting the null hypothesis). These were analysed using MS Excel’s regression tool under the Analysis Toolpak. The degree of variation (i.e. coefficient of determination; r2) that could be explained by each of the selected independent variables under each emitting subsector, along with the p-value are used, with full regression results provided in the supplementary materials Tables S.1-3.
Table 2. Emission levels and reductions across major UK region Local Authorities (LA), Population (Pop), Average (avg), Standard Deviation (Std Dev).
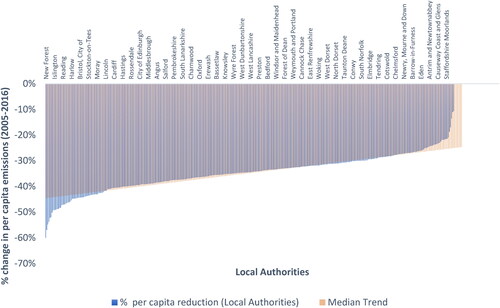
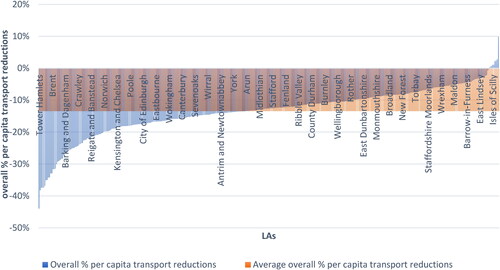
All LAs were analysed together in the first instance for each of the major emissions sectors, using explanatory variables identified in the literature review that have impacts on GHG emissions; these were limited due to the availability of LA-level data (applications described in ). However, when the LA GHG reductions are presented in a rank order plot of total percentage per capita reduction between 2005 and 2016 (), a nonlinear trend of emissions reductions is evident. To explore this further, the trend of emissions reductions of the LAs adjacent to the median is plotted (+/- 50 LAs; in orange on ). The LAs that deviate away from this trend are identifiable at the upper and lower extremes of the data; the 60 LAs from the maximum and minimum reductions are approximately where LA reductions noticeably deviate from the median trend. As a result, in addition to analysing relationships across the entire dataset of LAs, samples of the top 60 and the bottom 60 in each emission reductions category were also evaluated to determine whether relationships become stronger/weaker within these value ranges.
Figure 1. Rank-order plot of absolute GHG emissions in UK Local Authorities, with the median trend.
Finally, an analysis was completed on the quality of climate change preparedness plans as assessed by Heidrich et al. [Citation40]. In their study based on the European Urban Audit project, LAs were selected based on having varied geographic locations and population size, while also covering national capitals and at least 20% of the UK’s population.
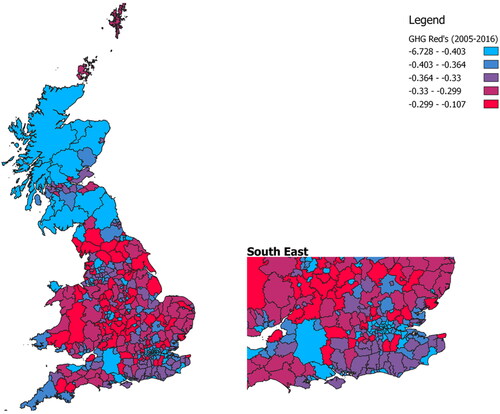
Figure 2. Choropleth map displaying GHG emissions reductions in Great Britain local authorities in 2016 relative to 2005, categorized by quintile in fractions of emissions reductions (i.e. −0.403 = −40.3% reduction relative to 2005). Inset focuses on the southeast of England, including the regions of the East of England, Greater London, and the South East).
Results
Mitigation trends in UK local authorities
Emissions reductions achieved across UK LAs between 2005 − 2016 are presented in . Examining emissions reductions in UK LAs, collectively these have seen a decline of 31%. Of the nine regions of England, the North East region showed the greatest emissions reductions (51%), whereas the band around the middle of England (the Midlands and the East of England) saw the lowest reductions (∼27%). As alluded to in the discussion on deindustrialization, industrial and commercial emissions saw the greatest decline, while transportation has seen the slowest reductions. A map of the emissions reductions realised is presented by quintile in .
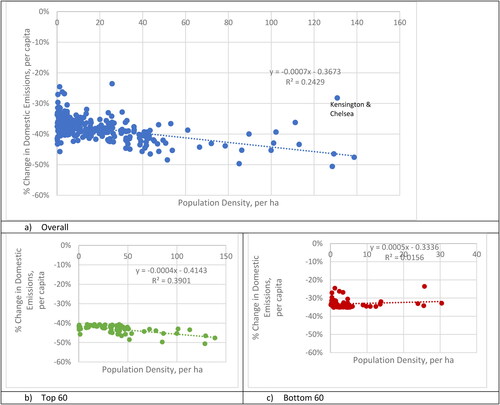
Figure 3. Scatter plots showing the relationship between % per capita reductions 2005-2016 in UK local authority domestic GHG emissions and 2011 population density a) Overall, b) top 60 reducers, c) bottom 60 reducers (Kensington & Chelsea removed as an outlier).
Standard deviations (SDs) across emissions reductions across the UK were assessed, with transport (6.0%) and domestic (3.2%) sectors demonstrating a relatively small variation in emissions reduction levels between LAs; this may be due to developments in both sectors which has influenced the entirety of the UK emissions-producing technology stock, such as advancements in modern vehicles and increased efficiency of the electricity grid, respectively. Conversely, a SD value of 11.5% was observed in the Industrial and Commercial sector, which suggests a higher level of variation in emissions reduction across UK LAs.
Domestic emissions
On average, per capita domestic emissions were reduced by 32.5% across all LAs; several of the most successful authorities were in Greater London, though substantial decreases in emissions were observed across the vast majority of LAs, as suggested by the mean and SD () and the plots below. The impact of density and income on domestic sector emissions mitigation are explored below.
Best vs worst performing LAs
Population & population density
The scatter plot in shows a positive relationship between per capita % reductions in domestic emissions and population density of LAs. Overall, a relatively strong negative relationship is observed between per capita domestic emission reductions and increasing population density (p-value = 3.86 × 10⁻²⁵; see Supplementary Material Table S.1 for full details). For example, Islington, with a population density of 138.7 inhabitants/ha saw a 47.6% reduction in per capita domestic emissions whilst Allerdale (0.8/ha) saw a 33% reduction. Some densely populated Boroughs in London are also notable outliers; Tower Hamlets (4th densest LA in the UK) and Newham achieved higher than average per capita domestic GHG reductions (51% and 50%, respectively). However, exceptions exist, such as Corby’s overperformance relative to this trend, with a population density of 7.6 and a 42% reduction in per capita emissions. While the negative relationship is significant, the R2 value derived for this relationship (0.24) is not as high as was observed between population density and per capita transport reductions ( below) but the model explains a substantial share of variability of the response data around the mean. This relationship is more pronounced with LAs achieving higher reductions (i.e. the top 60) rather than those at lower emissions reductions levels (the bottom 60; see R2 in ).
Figure 4. a) Absolute domestic emissions vs population, 2016, along with the regression line; b) Absolute domestic emissions vs Gross Disposable Household Income, 2016, along with the regression line.
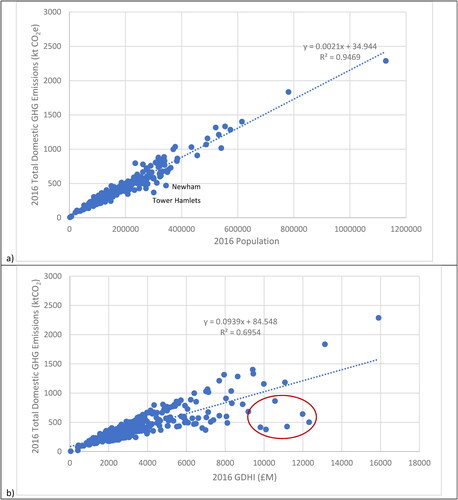
Figure 5. Transportation emissions reduction per capita, 2005-2016, with average reductions across all LAs highlighted.
Another prominent outlier is Kensington and Chelsea, which showed one of the lowest levels of domestic emissions reduction across the UK. There is a higher level of unoccupied housing within the borough which may impact the emission levels per capita (i.e. more houses per resident); a larger quantity of the most expensive housing in the borough is identified as “second homes” for affluent homeowners who are therefore not likely to be counted in censes or associated population estimates [Citation54]. According to 2016 statistics, 1.6% of houses are vacant in Kensington and Chelsea, nearly double the national average of 0.9% [Citation55].
Shifting away from reductions and examining domestic emissions on an absolute basis, it is seen that 2016 emissions are strongly explained by total population in an LA (R2 = 0.9469; ). This suggests that there is limited variation in the overall performance of domestic emissions across UK local authorities, regardless of population (i.e. the data do not seem to plateau at higher populations, like is seen for GDHI below).
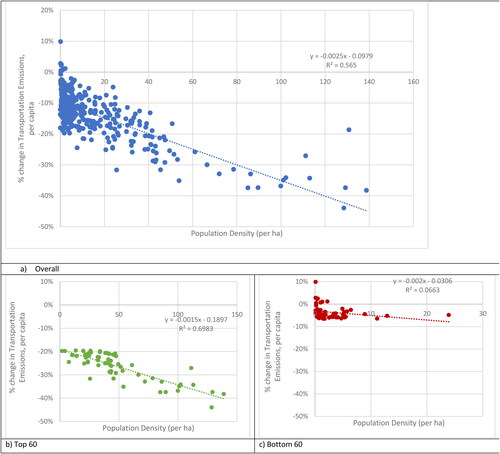
Figure 6. Relationships of reductions in per capita transportation GHG emissions vs population density per hectare for a) all LAs, b) the top 60 reducing LAs and c) the bottom 60 reducing LAs. Regression lines are included for each.
Gross disposable household income (GDHI)
As income is commonly observed to be positively correlated with GHG emissions (per literature discussed above), this was tested in the context of domestic GHG emissions mitigation more specifically. First, the relationship between aggregate income (GDHI in this instance) of an LA and total 2016 domestic GHG emissions is examined here (). The relationship holds in this instance, with total LA GDHI correlating positively with total local domestic GHG emissions (R2 = 0.6954; see Table S.2). This trend is demonstrated more strongly with LAs that have a total GDHI less than £6B (R2 = 0.7482) than those greater than that total (R2 = 0.2535); emissions increase more rapidly in the former than in the latter, plateauing somewhat as the relationship weakens afterwards. Some interesting outliers highlighted in include Kensington & Chelsea, Hammersmith & Fulham, Camden, Wandsworth, and Westminster; all of which have relatively high population densities and are located in affluent central London (all with GDHI/cap > £35,000; national average of all LAs is £20,000). However, it should be noted that this relationship does not hold when comparing success of reductions with per capita income; regression analyses of GDHI per capita and domestic emissions reductions per capita provided no significant relationship for the entire set of LAs, nor the top or bottom 60 reducers (Table S.3). This is similar to findings from Dixon, who, when exploring other metrics of economic activity (per capital GVA) and found no relationship with total per capita emissions for the largest UK local authorities [Citation23].
Transportation emissions
Of the sectors assessed, transportation has proven consistently challenging to achieve deep absolute reductions (as presented in ). Reductions averaged 12% in per capita terms () but typically did not exceed 10% on an absolute basis (average −6.5%). This demonstrates the difficulty of transportation energy demand mitigation in the short term, with the interim result being persistent, relatively high emissions. It is yet to be seen how post-COVID19 commuting activity will affect this trend, though as of July 2022, weekend car, commercial vehicle, cycling and heavy goods vehicle use have all risen relative to pre-pandemic levels, while rail and bus trips remain lower than before [Citation56]. The presumption is that in the medium-to-long-term battery electric vehicle adoption will gradually reduce associated emissions [Citation33].
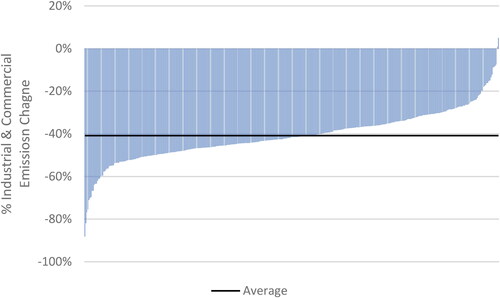
Figure 7. Rank-order plot of Industrial & Commercial Sector Emissions Change, 2005-2016; the black line (bold) represents the average Industrial & Commercial reduction across all local authorities.
Population density
shows a clear relationship between population density and transport emissions reductions per capita from 2005-2016. As the population density (independent variable) increases, the level of transport emissions (dependent variable) decreases. A large proportion of data points that are closer to the y-axis are found to have similar population densities and reduction levels from 2005-2016. However, as population density rises a clear pattern emerges as emissions reductions increase. The R2 value indicates that 57% of the data is explained by the model accounting for a large quantity of the variation between LAs success in these reductions. The p-value (4.79 × 10−72; see Table S.4) further suggests that the relationship between the variables is significant.
Exploring specific cases, Tower Hamlets (population density = 128.5/ha) and Islington (138.7/ha), with relatively high population densities, saw the highest per capita transportation emissions reductions (43.9% and 38.2%, respectively) in this period. Kensington and Chelsea (130.8/ha), located in London, is shown to be an outlier (18.7% per capita reductions) given its relatively high population density. This could be partially attributable to recent population decline within the authority; Kensington and Chelsea was the only LA to not show population growth in Greater London in this time period. As a result of the method of data collection used to estimate transport emissions (traffic activity data), transport emissions are therefore distributed across fewer residents.
Best and worst performing LAs
The second panel () exhibits the relationship between population density and the top 60 reducers of transportation emissions, showing a stronger positive relationship. The R2 value indicates that the model explains 69.2% of the variability of the dependent data and a low p-value (1.74 × 10⁻¹⁶), which also confirms the significance of the positive relationship between these two variables.
examines the relationship between the bottom 60 lowest per capita reducers and population density, showing a weak relationship between the two variables. The model only explains 6.8% of the variability (i.e. R2 = 0.068; Table S.4), with a p-value of 0.044 affirming that a (relatively weaker) relationship between these variables is observed. It is worth noting that while high reducers covered the full spectrum of the range of population densities, the bottom 60 low reducers did not exceed population densities of 25 inhabitants/ha, suggesting a particular challenge in reducing transport emissions below this population density threshold. For example, only one local authority with a population density of less than 40/ha reduced transportation emissions by greater than 30% per capita in the study period; this was this City of London, where resident populations are relatively low in this predominantly commercial centre (and is governed by a congestion charge that has been gradually increased over this period).
Industrial & commercial emissions
Industrial & Commercial sector emissions tend to demonstrate greater variability depending on the economic composition of local areas (see ); some LAs have relatively limited industrial activity (e.g. Kensington & Chelsea), limited commercial activity (e.g. Orkney Islands; observing both job and emissions growth) or both (e.g. Isles of Scilly). As highlighted above, the average reduction in the Industrial and Commercial sector (including “Industrial and Commercial Electricity”, “Industrial and Commercial Gas”, “Industrial and Commercial Other Fuels”, “Large Industrial Installations” (LII), and “Agriculture”) from 2005-2016 was 40.9%. This is from a 2005 average of 613 ktCO2e per LA. The North East region saw the largest emissions reduction across the industrial and commercial sector (-51%) while Northern Ireland saw the lowest reduction (-34%). Examining the aggregate annual emissions reductions in the sector from all LAs when comparing 2016 to 2005, 56% are associated with electricity emissions, 26% are from LII activities, 11% are from natural gas, 6% from other fuels, and less than 1% are from agriculture. The reductions in electricity-related emissions are again largely attributable to improvements in grid carbon intensity (see Discussion section below), with some energy efficiency gains in operations (e.g. HVAC, lighting) [Citation57].
Figure 8. Change in emissions and manufacturing jobs for selected LAs, 2005-2016; numbers of LAs per quadrant are listed in each corner, with number on axes excluded from the count [Citation4,Citation79].
![Figure 8. Change in emissions and manufacturing jobs for selected LAs, 2005-2016; numbers of LAs per quadrant are listed in each corner, with number on axes excluded from the count [Citation4,Citation79].](/cms/asset/6d96e55d-9329-4c3e-a6c4-576da40519bd/tcmt_a_2120418_f0008_c.jpg)
Whilst this sector has seen the highest percentage emissions reductions, it also had demonstrated the highest standard deviation, suggesting a broader spread of the emissions reductions success in this sector relative to domestic and transport. Again, much of this can be explained by LAs that have shown significant reductions in industrial and commercial emissions due to closures of LIIs, which would lead to dramatic stepwise reductions in GHG emissions, relative to other LAs where reductions are due to modest efficiency measures or the improvements in electricity grid carbon intensity. However, even if LIIs were removed from the dataset, a 37.4% reduction in industrial emissions is still observed, owed in large part to improvements in grid emissions intensity.
Best and worst performing LAs
Many of the deepest reductions can be attributable to declines from LIIs; looking at the 10 LAs with the greatest absolute reductions in Industrial & Commercial sector emissions, on average 65% of their emissions were attributable to dramatic declines in LIIs. For example, when SSI’s Redcar steelworks closed in 2015 [Citation58], LII emissions dropped from 6000 in 2015 to 1900 ktCO2 in 2016. The sole exceptions to this were the LA of Westminster and Birmingham, which saw dramatic reductions in absolute Industrial & Commercial electricity emissions (55% and 61%). It can be observed from that there is a tendency for manufacturing job losses to coincide with reductions in emissions, with 129 of 168 LAs observing coincident declines (note that manufacturing employment data are not available for the entire set of LAs). However, no statistically significant relationship is observed amongst this subset.
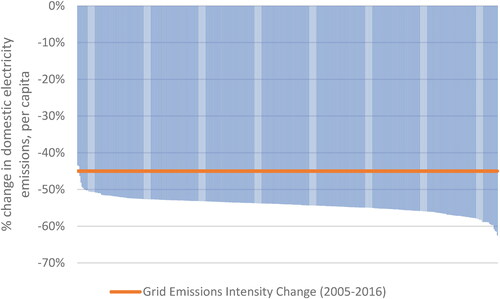
Figure 9. Rank-order plot of percent change in LAs domestic electricity emissions per capita, compared with change in electricity grid emissions intensity (2005-2016).
Looking at the remaining quadrants, the lower levels of reductions seen amongst LAs could be attributable to greater economic activity or increased employment. In the positive employment and emissions change quadrant (top-right), the Orkney Islands is distorted by growth in a low baseline level of commercial and industrial activity, while Moray observed growth in service (e.g. tourism) and local manufacturing (predominantly food industry, which is not as strongly linked with offshoring as, for example, heavy manufacturing). The top-left quadrant, with increased emissions along with the decreased employment, contains predominantly Scottish and smaller LAs; these are generally LAs with decreasing manufacturing activity but growing service sector activity, resulting in net positive employment across these sectors (e.g. Highland, Bedford, Falkirk, Angus, Aberdeenshire, Swindon, Carmarthenshire). The bottom-right (growth in manufacturing employment along with declines in industrial/commercial emissions) contains examples of LAs with industrial (and services) job growth, though with more robust employment growth in service-based sectors (i.e. those with lower energy/emissions intensity) relative to their increase in manufacturing activity (e.g. Merton, Ealing, Reading, Liverpool, Wandsworth). The decreases in electricity grid GHG intensity likely offset increased demand attributable to (predominantly service sector) employment increases.
The role of target setting
As mentioned in the literature review, a thorough review of the climate change preparedness strategies of 30 UK LAs from the urban audit was done by Heidrich et al [Citation40]. No clear trend between per capita GHG reductions and mitigation plan preparedness (see Table S.5, S.11; Figure 10), as scored by Heidrich and others [Citation40]. It should be noted that the average emissions reductions per capita from these selected local authorities was −39.9% (compared with the UK average of 31.2%; see ). A one-sided t-test conducted to compare the selected LAs with the remainder of the UK (average of per capita) suggests that the means of the two samples were not significantly different, even with the remainder of the UK achieving a lesser degree of mitigation success (see Table S.6 in Supplementary Materials). This suggests that the performance of the sample may be representative of LAs more broadly.
Discussion & conclusion
The UK is frequently held up as a developed-world model for GHG emissions mitigation, with a 39% reduction by 2016 from a 1990 baseline (excluding LULUCF) [Citation59]. It is important to understand this success at a local level, as well as within the major emitting sectors in which they have been realised. Certainly, central government policy and planning have had a role (e.g. the shift away from coal in electricity generation) though the results above have explored the local-authority specific attributes that may have contributed to emissions mitigation. Looking at the three main sectors assessed above (industrial & commercial, transport, and domestic; ), the trends in these sectors are discussed in further detailed below.
Transportation emissions
According to BEIS, the transport sector had the highest share of end-user emissions in 49% of the LAs [Citation4]. However, when looking at the entire list of 391 LAs, the North East and London regions were the only two where average transportation emissions were reduced by more than 10%. Additionally, LAs in London such as Islington (-38.2%), Hackney (-37.3%), Wandsworth (-37.3%) were found to have the highest reductions in per capita transport emissions and achieving a 34% reduction in total emissions. London’s effectiveness in reducing transport emissions could be a result of its comprehensive urban transportation strategy, including congestion relief pricing that was implemented in February 2003 [Citation60]. The strategy requires motorists driving in central London on weekdays between the 7am and 6:30pm to pay a £15 charge [Citation61], with motorcycles, licensed taxis, vehicles used by disabled people, vehicles running on alternative fuels, buses and emergency fuels are exempted from this charge.
Gudipudi et al highlighted the benefits of a densely populated city, with increasing population densities of US cities along with introducing effective policies allows for reductions in building and road emissions, reflected in the findings here that LAs with higher population densities were more successful in reducing transport emissions [Citation62]. However, Minx et al. have found conflicting results to those presented here, in that population density was not a significant factor in UK emissions [Citation24]. In the present study, benefits of density are certainly present for transportation, with a clear relationship between the success of transportation GHG reductions and population density. This points to the fact that transportation emissions mitigation measures (i.e. increased public/active transport investment, higher parking charges, road pricing [Citation63]) are more readily deployable at higher densities and that there is a need to focus efforts on the electrification of transport in low density areas [Citation6].
Domestic emissions
The analysis of domestic emission reductions and population density highlighted a clear relationship between the variables. Generally, LAs with higher population densities achieved larger reductions in domestic emissions. As highlighted, there are potential benefits of increased population density as shown in the literature [Citation9, Citation62]. This may be attributable to the quantity and integration of mitigation strategies. For example, a large majority of LAs in London have their own plans and policies to reduce GHG emissions. Further, “The London Plan” has been implemented, which outlines the strategy for all new domestic structures to be zero carbon from 2016 onwards [Citation64]. Large urban areas such as London are able to report on climate change and produce strategic reports and documents, due to their substantial administrative capacity (including both their constituent jurisdictions and at the regional level, such as the Greater London Authority). As a result, large urban areas may be more likely to plan and fund emissions reductions in comparison to more rural authorities which have lower population densities. Further, the weakening of the relationship between household income and absolute domestic emissions in LAs with higher levels of total gross domestic household income is worthy of discussion. It has been highlighted in numerous studies that a strong link is evident between household income and carbon footprint (emissions embedded in all consumption at the household level) ([Citation65]; p. 186). In Jones and Kammen’s study of households in the United States, housing-related emissions (i.e. direct scope 1 and 2 emission, such as heating, cooling, hot water) contributed an important share of emissions (roughly 25%). As income rises, it is expected that house floor area and associated emissions would rise as well [Citation22]. The limits to this relationship and associated household energy use are reflected in this weakening. However, if carbon footprint of consumption activities are considered (recreation, food, transport), it is expected that the rise in emissions associated with income will continue further (until again reaching a plateau due to less impactful consumption [Citation66,Citation67]).
The UK has seen substantial reductions in the carbon intensity of the electricity grid (-45% between 2005 and 2016) [Citation68] and one conclusion may be that much of the success in country-wide GHG mitigation can be largely attributable to this, as previously observed [Citation69]. This may seem especially likely in the domestic sector, where fossil energy demand reductions require the action of many discrete actors on energy efficiency retrofits, who have traditionally been reluctant to act [Citation70]. As domestic electricity demand is generally seen to scale linearly with population [Citation71], it can be normalised on a per capita basis to explore reduction trends. From , domestic electricity emissions reductions from LAs generally only slightly exceeded the average grid value of decarbonization. The remaining difference across LAs can be attributed to other factors such as the retrofitting of housing, change of fuel use, improved efficiency of electric end-uses (e.g. lighting, electronics, etc.) and changes in consumption, however the sum of their impacts appear to be relatively minor; between 2005-2016, total domestic electricity demand is estimated to have dropped by around 14% [Citation72]. This suggests that the substantial progress in domestic electricity related GHG emissions is overwhelmingly due to centralized actions around grid decarbonization and not through local or household level activities. That being said, household electricity consumption in the UK is estimated to be approximately 3,800 kWh/annum [Citation73], comparing favorably with other mature economies that also predominantly use natural gas for space heating (e.g. Alberta, Canada − 6,400 kWh; [Citation74]Footnote3).
Figure 10. Greenhouse Gas Emissions Reductions from Selected LAs versus Score of Mitigation Plan as Evaluated by Heidrich et al. [Citation40].
![Figure 10. Greenhouse Gas Emissions Reductions from Selected LAs versus Score of Mitigation Plan as Evaluated by Heidrich et al. [Citation40].](/cms/asset/39d97340-2c9d-46df-a6df-eabcbcde496e/tcmt_a_2120418_f0010_c.jpg)
Industrial & commercial
As demonstrated by the results, deindustrialisation has played a dramatic role in emissions mitigation across the UK, given that many of the greatest success in emissions reductions in this sector were observed in LAs that have seen closures of large industrial installations. Indeed, authors have pointed out that GHG emissions reductions are now embodied in trade of manufactured goods and commodities that have been off-shored from the UK [Citation45, Citation75]. Further, while energy efficiency has also played a role in the carbon performance of industrial sectors, this has been offset by increases in demand from non-industrial demand (almost exclusively from the commercial sector) [Citation75]. The recent UK government strategy for industrial decarbonisation proposes a mixture of measures including resource/energy efficiency improvements, carbon capture, utilisation & storage, hydrogen fuel-switching (i.e. in iron & steel) [Citation76].
Local level planning & target setting
The importance of advanced planning and associated target setting are not borne out in the results here. There are several factors that limit the building of evidence here; the relatively small sample size [Citation40], the limitations of the assessment method, or even the implications of austerity on LAs capacity to act [Citation77]. However, several studies and groups promote the value in target setting and these cannot be disregarded [Citation78]. Further, the administrative capacity of larger cities to manage environmental challenges ([Citation79]; p 75) and the networks available to support/inform their mitigation strategies (e.g. C40 cities, Global Covenant for Mayors) may provide an advantage for larger LAs.
Summary
The UK has seen significant success in reducing GHG emissions from all sectors, including the domestic sector where a 30% decline has been observed on average across all LAs. To date, LAs have demonstrated substantial GHG reductions within their borders, though these are largely attributable to policy measures at higher levels of government. It is important to highlight the substantial contribution that the decarbonisation of electricity grid GHG emissions intensity has made, with a 45% reduction observed between 2005 and 2016.
Several existing relationships between emissions and their identified drivers were tested here to determine if these held for emissions mitigation. A negative relationship was observed between density and reductions in per capita domestic emissions, as well as per capita transport emissions; as density increases, the depth of reductions also increases, though this relationship is weaker for domestic emissions. This demonstrates the success that denser urban areas have had in reducing emissions, and the challenge that less dense urban areas have faced in mitigation. This is particularly important for the decarbonisation of transport, where emissions reductions will need to be mostly met by reductions in transportation demand (e.g. remote work) or low-carbon transport (e.g. electric vehicles). Meanwhile, no clear relationship was observed between income of LAs and success in domestic GHG mitigation, leaving an inconclusive result as to whether LAs with higher incomes are more able to pay for domestic mitigation measures (i.e. retrofits). This relationship may become more evident during the scaling up of battery-based transportation. Also, LAs that had seen larger declines in manufacturing did not necessarily observe larger declines in commercial & industrial emission, with no statistically significant relationship evident. Finally, no clear link was observed between the degree of climate change planning and success in emissions reduction.
This work emphasizes the role of pre-existing urban characteristics and the limitations on local government in mobilising deep emissions mitigation at the LA level. Ultimately, LAs do not have clear autonomy in GHG emissions reductions, with many relationships observed here attributable to the benefits of density (largely attributable to historic development), impacts of deindustrialisation (linked to longer-term globalisation trends), and initiatives from the central government (i.ge., decarbonisation of electricity supplies).
Limitations & further research
Data limitations restricted further analysis of the reductions in success. For example, indicative time series data for a number of the variables identified in the literature review were not available at the LA level, including climate (e.g. heating degree days), consumption activities, and housing stock ages. Further, the use of gross disposable household income may not properly represent a LA’s capacity for emissions-intensive consumption (e.g. high levels of domestic energy demand or transportation energy); capacity to consume may be better represented by a wealth metric, which is not available at the local authority level. Finally, further research using multidimensional panel data analysis could provide further insights on the drivers of GHG emissions reductions over time, if coupled with both the data used in this study and those suggested above.
Supplemental Material
Download MS Word (34.1 KB)Acknowledgements
We thank Prof Tim Dixon for his comments on the paper.
Disclosure statement
No potential conflict of interest was reported by the author(s).
Data availability
All data used in this analysis will be posted in supplementary materials (on Figshare Project “UK Local Authority GHG Emission Reductions (2005-2016), DOI: 10.6084/m9.figshare.16802617).
Notes
1 only CO2 is quantified in local authority inventories
2 cities are bequeathed “City” status by the monarch
3 This is in spite of both having relative low levels of electricity use for household space-heating, 8% in England/Wales vs 4% in Alberta
References
- BEIS. Law for net zero emissions begins passage through Parliament [Internet]. UK Gov; 2019. Available from: https://www.gov.uk/government/speeches/law-for-net-zero-emissions-begins-passage-through-parliament.
- UK House of Commons. Business for Wednesday 01 May 2019 [Internet]. Summ. Agenda Order Bus; 2019. Available from: https://publications.parliament.uk/pa/cm201719/cmagenda/ob190501.htm.
- Climate Emergency UK. List of councils who have declared a climate emergency [Internet]; 2020. Available from: https://www.climateemergency.uk/blog/list-of-councils/.
- BEIS. UK local authority carbon dioxide emissions estimates 2005 - 2016 [Internet]. London. Available from: https://www.gov.uk/government/statistics/uk-local-authority-and-regional-carbon-dioxide-emissions-national-statistics-2005-2016.
- Dawson R, Wyckmans A, Heidrich O, et al. Understanding cities: Advances in integrated assessment of urban sustainability Final Report of COST Action TU0902. [Internet]. Newcastle, UK. Available from: http://www.ncl.ac.uk/ceser/researchprogramme/costactiontu0902/.
- Kennedy CA, Ibrahim N, Hoornweg D. Low-carbon infrastructure strategies for cities. Nature Clim Change. [Internet]. 2014;4(5):343–346. Available from: http://www.nature.com/10.1038/nclimate2160.
- Marcotullio PJ, Sarzynski A, Albrecht J, et al. The geography of global urban greenhouse gas emissions: an exploratory analysis. Clim Change. 2013;121(4):621–634. http://link.springer.com/10.1007/s10584-013-0977-z.
- O'Neill BC, Dalton M, Fuchs R, et al. Global demographic trends and future carbon emissions. Proc Natl Acad Sci U S A. 2010;107(41):17521–17526. doi:10.1073/pnas.1004581107.
- Baiocchi G, Creutzig F, Minx J, et al. A spatial typology of human settlements and their CO2 emissions in England. Glob Environ Chang. 2015;34:13–21. doi:http://dx.doi.org/10.1016/j.gloenvcha.2015.06.001.
- Jones C, Kammen DM. Spatial distribution of U.S. household carbon footprints reveals suburbanization undermines greenhouse gas benefits of urban population density. Environ Sci Technol. 2014;48(2):895–902. http://pubs.acs.org/http://www.ncbi.nlm.nih.gov/pubmed/24328208. doi:10.1021/es4034364/5Cn.
- Measham TG, Preston BL, Smith TF, et al. Adapting to climate change through local municipal planning: Barriers and challenges. Mitig Adapt Strateg Glob Change. 2011;16(8):889–909. doi:10.1007/s11027-011-9301-2.
- Mendizabal M, Feliu E, Tapia C, et al. Triggers of change to achieve sustainable, resilient, and adaptive cities. City Environ Interact. 2021;12:100071. doi:10.1016/j.cacint.2021.100071.
- Peters M, Fudge S, Hoffman SM, et al. Carbon management, local governance and community engagement. Carbon Manag. 2012;3(4):357–368. doi:10.4155/cmt.12.41.
- Centre for Cities. Outlook 2018 [Internet]. London, UK; 2018. Available from: https://www.centreforcities.org/wp-content/uploads/2018/01/18-01-12-Final-Full-Cities-Outlook-2018.pdf.
- Basingstoke & Deane. Energy Efficiency Loans [Internet]. Available from: https://www.basingstoke.gov.uk/energy-efficiency-loans-and-grants.
- Fudge S, Peters M. Motivating carbon reduction in the UK: the role of local government as an agent of social change. J Integr Environ Sci. 2009;6(2):103–120. doi:10.1080/19438150902732101.
- Hoppe T, Graf A, Warbroek B, et al. Local governments supporting local energy initiatives: Lessons from the best practices of Saerbeck (Germany) and Lochem (The Netherlands). Sustain. 2015;7(2):1900–1931. doi:10.3390/su7021900.
- Wang Q, Su M. The effects of urbanization and industrialization on decoupling economic growth from carbon emission – a case study of China. Sustain Cities Soc. 2019;51(January):101758. doi:10.1016/j.scs.2019.101758.
- Adom PK, Kwakwa PA, Amankwaa A. The long-run effects of economic, demographic, and political indices on actual and potential CO2 emissions. J Environ Manage. 2018;218:516–526. doi:10.1016/j.jenvman.2018.04.090.
- BEIS. 2017 UK Greenhouse gas emissions, provisional figures [Internet]; 2017. Available from: https://www.gov.uk/government/statistics/provisional-uk-greenhouse-gas-emissions-national-statistics-2017.
- Committee on Climate Change. Factsheet: Aviation [Internet]. Available from: https://www.gov.uk/government/publications/aviation-policy-framework%0Ahttps://www.theccc.org.uk/wp-content/uploads/2013/04/Aviation-factsheet.pdf.
- Goldstein B, Gounaridis D, Newell JP. The carbon footprint of household energy use in the United States. Proc Natl Acad Sci U S A. 2020;117(32):19122–19130. doi:10.1073/pnas.1922205117.
- Dixon T. Hotting up? An analysis of low carbon plans and strategies for UK Cities - Volume 1: Main findings. London, UK. Available from: https://khub.net/c/document_library/get_file?uuid=344bfb1a-fc32-41de-9958-140e9d1499d6&groupId=6926152.
- Minx J, Baiocchi G, Wiedmann T, et al. Carbon footprints of cities and other human settlements in the UK. Environ Res Lett. 2013;8(3):035039. http://stacks.iop.org/1748-9326/8/i=3/a=035039?key=crossref.32c84bcdbabd115e117d24e9c54b71a1. doi:10.1088/1748-9326/8/3/035039.
- Aboagye S, Appiah-Konadu P, Acheampong V. Economic expansion and environmental degradation in Ghana: a sector decomposition analysis. African J Econ Rev. 2020;VIII(I):106–124.
- Appiah K, Du J, Yeboah M, et al. Causal relationship between industrialization, energy intensity, economic growth and carbon dioxide emissions: Recent evidence from Uganda. Int J Energy Econ Policy. 2019;9(2):237–245.
- Mohareb E, Gillich A, Bristow D. Participation in domestic energy retrofit programmes: key spatio-temporal drivers. Build Cities. 2022;3(1):356. doi:10.5334/bc.202.
- ONS. Overview of the UK Population; 2018.
- Department for Environment F& RA. Rural population and migration statistics [Internet]; 2021. Available from: https://www.gov.uk/government/statistics/rural-population-and-migration.
- Swinney P, Carter A. The UK’s rapid return to city Centre living. BBC News; 2018.
- Sithole H, Cockerill TT, Hughes KJ, et al. Developing an optimal electricity generation mix for the UK 2050 future. Energy. 2016;100:363–373. doi:10.1016/j.energy.2016.01.077.
- HM Government. Heat and Buildings Strategy [Internet]; 2021. Available from: https://www.gov.uk/government/publications/heat-and-buildings-strategy.
- Department for Transport. Decarbonising transport; for a better, greener Britain [Internet]; 2021. Available from: https://www.gov.uk/government/publications/transport-decarbonisation-plan
- Grubb M, Butler L, Twomey P. Diversity and security in UK electricity generation: the influence of low-carbon objectives. Energy Policy. 2006;34(18):4050–4062. doi:10.1016/j.enpol.2005.09.004.
- Hawkins TR, Singh B, Majeau-Bettez G, et al. Comparative environmental life cycle assessment of conventional and electric vehicles. J Ind Ecol. 2013;17(1):53–64. doi:10.1111/j.1530-9290.2012.00532.x.
- Turk JK, Reay DS, Haszeldine RS. UK grid electricity carbon intensity can be reduced by enhanced oil recovery with CO2 sequestration. Carbon Manag. 2018;9(2):115–126. doi:10.1080/17583004.2018.1435959.
- Mentel U, Wolanin E, Eshov M, et al. Industrialization and CO2 emissions in Sub‐Saharan Africa: the mitigating role of renewable electricity. Energies. 2022;15(3):946. doi:10.3390/en15030946.
- Quéré CL, Korsbakken JI, Wilson C, et al. Drivers of declining CO 2 emissions in 18 developed economies. Nat Clim Chang. 2019;9(3):213–217. doi:http://dx.doi.org/10.1038/s41558-019-0419-7.
- Dhakal S. GHG emissions from urbanization and opportunities for urban carbon mitigation. Curr Opin Environ Sustain. 2010;2(4):277–283. doi:http://dx.doi.org/10.1016/j.cosust.2010.05.007.
- Heidrich O, Dawson RJ, Reckien D, et al. Assessment of the climate preparedness of 30 urban areas in the UK. Clim Change. 2013;120(4):771–784. doi:10.1007/s10584-013-0846-9.
- Heidrich O, Reckien D, Olazabal M, et al. National climate policies across Europe and their impacts on cities strategies. J Environ Manage. 2016;168:36–45.
- Ürge-Vorsatz D, Harvey LDD, Mirasgedis S, et al. Mitigating CO2 emissions from energy use in the world’s buildings. Build Res Inf. 2007;35(4):379–398. doi:10.1080/09613210701325883.
- Jenkins D, Liu Y, Peacock AD. Climatic and internal factors affecting future UK office heating and cooling energy consumptions. Energy Build. 2008;40(5):874–881. doi:10.1016/j.enbuild.2007.06.006.
- Isaac M, Vuuren Dv. Modeling global residential sector energy demand for heating and air conditioning in the context of climate change. Energy Policy. 2009;37(2):507–521. doi:http://dx.doi.org/10.1016/j.enpol.2008.09.051.
- Barrett J, Peters G, Wiedmann T, et al. Consumption-based GHG emission accounting: a UK case study. Clim Policy. 2013;13(4):451–470. doi:10.1080/14693062.2013.788858.
- Baumert N, Kander A, Jiborn M, et al. Global outsourcing of carbon emissions 1995–2009: a reassessment. Environ Sci Policy. 2019;92:228–236. doi:10.1016/j.envsci.2018.10.010.
- Kelly MJ. Retrofitting the existing UK building stock forum retrofitting the existing UK building stock. Build Res Inf. 2009;37(2):196–200. doi:10.1080/09613210802645924.
- Moran F, Nikolopoulou M, Natarajan S. Developing a database of energy use of historic dwellings in bath, UK. Energy Build. 2012;55:218–226. doi:10.1016/j.enbuild.2012.09.016.
- Historic England. There’s no place like old homes: Re-use and recycle to reduce carbon. London. Available from: https://historicengland.org.uk/content/heritage-counts/pub/2019/hc2019-re-use-recycle-to-reduce-carbon/.
- BEIS. Government emission conversion factors for greenhouse gas company reporting - GOV.UK [Internet]. Available from: https://www.gov.uk/government/collections/government-conversion-factors-for-company-reporting.
- ONS. Population estimates - Office for National Statistics [Internet]. Estim. Popul. UK, Engl. Wales, Scotland, North. Irel; 2019. Available from: https://www.ons.gov.uk/peoplepopulationandcommunity/populationandmigration/populationestimates.
- Office for National Statistics. Nomis labour market statistics - Regional employment by occupation [Internet]; 2020. Available from: https://www.nomisweb.co.uk/query/construct/summary.asp?mode=construct&version=0&dataset=168.
- Office for National Statistics. Regional gross disposable household income: local authorities by NUTS1 region - Office for National Statistics [Internet]. Available from: https://www.ons.gov.uk/economy/regionalaccounts/grossdisposablehouseholdincome/datasets/regionalgrossdisposablehouseholdincomebylocalauthoritiesbynuts1region.
- Inman P. Housing crisis: More than 200,000 homes in England lie empty. The Guardian [Internet]. 2017. Housing: [about 3 screens]. Available from: https://www.theguardian.com/society/2017/apr/20/over-200000-homes-in-england-still-lying-empty-despite-housing-shortages
- Ministry of Housing C and LG. Live tables on dwelling stock (including vacants); 2019. Available from: https://www.gov.uk/government/statistical-data-sets/live-tables-on-dwelling-stock-including-vacants.
- Department for Transport. Transport use during the coronavirus (COVID-19) pandemic [Internet]; 2022. Available from: https://www.gov.uk/government/statistics/transport-use-during-the-coronavirus-covid-19-pandemic.
- Mallaburn P, Oreszczyn T, Elwell C, et al. Reducing energy demand from buildings. In: Eyre N, Killip G, editors. Shifting the focus: energy demand in a net-zero carbon UK. Oxford, UK: Centre for Research into Energy Demand Solutions; 2019. p. 108.
- BBC News. SSI Redcar steel plant mothballed, with the loss of 1,700 jobs - BBC News [Internet]. BBC News; 2015. Available from: https://www.bbc.co.uk/news/uk-england-34377756.
- Brown P, Broomfield M, Cardenas L, et al. UK greenhouse gas inventory, 1990 to 2016. London: BEIS; 2018.
- Litman T. Smart congestion reductions II [Internet]. Victoria. Available from: http://citeseerx.ist.psu.edu/viewdoc/download;jsessionid=91AF6D312A03D7EBF25364FCF7E35FDD?doi=10.1.1.192.538&rep=rep1&type=pdf.
- Transport for London. Congestion charge [Internet]; 2022. Available from: https://tfl.gov.uk/modes/driving/congestion-charge.
- Gudipudi R, Fluschnik T, Ros AGC, et al. City density and CO2 efficiency. Energy Policy. 2016;91:352–361. doi:10.1016/j.enpol.2016.01.015.
- Mohareb E, Bristow D, Derrible S. Climate change mitigation in high-income cities. In: Seto KC, Solecki WD, Griffith, CA, editors. The routledge handbook of urbanization and global environmental change. Routledge international handbooks. London: Routledge; 2016. p. 377–405.
- GLA. The London Plan: Consolidated with alterations since 2011 [Internet]. Available from: https://www.london.gov.uk/sites/default/files/london_plan_march_2016_malp_-_frontispiece_and_ch1_context_and_strategy.pdf.
- Druckman A, Chitnis M, Sorrell S, et al. Corrigendum to “missing carbon reductions? Exploring rebound and backfire effects in UK households” [energy policy 39 (2011) 3572-3581]. Energy Policy. 2012;49(6):778. doi:http://dx.doi.org/10.1016/j.enpol.2011.03.058.
- Chitnis M, Sorrell S, Druckman A, et al. Who rebounds most? Estimating direct and indirect rebound effects for different UK socioeconomic groups. Ecol. Econ. 2014;106:12–32. doi:http://dx.doi.org/10.1016/j.ecolecon.2014.07.003.
- Druckman A, Jackson T. Understanding houesholds as drivers of carbon emissions. In: Taking stock of industrial ecology. London: Springer Open; 2016; p. 181–203. Available from: https://library.oapen.org/bitstream/handle/20.500.12657/27948/1002051.pdf.
- Ricardo Energy & Environment. Local and regional carbon dioxide emissions estimates for 2005 – 2013 for the UK. Didcot, Oxfordshire: BEIS; 2015.
- Kennedy C, Demoullin S, Mohareb E. Cities reducing their greenhouse gas emissions. Energy Policy. 2012;49:774–777. doi:10.1016/j.enpol.2012.07.030.
- Dowson M, Poole A, Harrison D, et al. Domestic UK retrofit challenge: Barriers, incentives and current performance leading into the green deal. Energy Policy. 2012;50:294–305. doi:http://dx.doi.org/10.1016/j.enpol.2012.07.019.
- Bettencourt LMA, Lobo J, Helbing D, et al. Growth, innovation, scaling, and the pace of life in cities. Proc Natl Acad Sci USA. 2007;104(17):7301–7306. http://www.pnas.org/cgi/10.1073/pnas.0610172104.
- Department for Business E& IS. Digest of UK Energy Statistics (DUKES) - Energy consumption by final end user, 1970-2020. Dig. UK Energy Stat; 2020. Available from: https://www.gov.uk/government/statistics/energy-chapter-1-digest-of-united-kingdom-energy-statistics-dukes.
- Waters L. Energy Consumption in the UK (ECUK) 1970 to 2018 [Internet]. London, UK. Available from: https://assets.publishing.service.gov.uk/government/uploads/system/uploads/attachment_data/file/820843/Energy_Consumption_in_the_UK__ECUK__MASTER_COPY.pdf%0Ahttps://www.gov.uk/government/statistics/energy-consumption-in-the-uk%0D.
- NRCan. Comprehensive energy use database [Internet]. Ottawa. Available from: https://oee.nrcan.gc.ca/corporate/statistics/neud/dpa/menus/trends/comprehensive_tables/.
- Hardt L, Owen A, Brockway P, et al. Untangling the drivers of energy reduction in the UK productive sectors: Efficiency or offshoring? Appl Energy. 2018;223(March):124–133. doi:10.1016/j.apenergy.2018.03.127.
- HM Government. Industrial decarbonisation strategy [Internet]. London, UK. Available from: https://www.gov.uk/government/publications/industrial-decarbonisation-strategy
- Centre for Cities. Cities Outlook 2019 [Internet]. London: Centre for Cities; 2019. Available from: https://www.centreforcities.org/reader/cities-outlook-2019/a-decade-of-austerity/.
- Fuller S. Creating a low carbon zone in Brixton, London, UK. In: Bulkeley H, Broto V, Edwards G, editors. An urban politics of climate change. Routledge; 2014. p. 211–230. [cited 2022 May 16]. Available from: https://www.taylorfrancis.com/chapters/edit/10.4324/9781315763040-18/creating-low-carbon-zone-brixton-london-uk-sara-fuller.
- Haughton G, Hunter C. Sustainable cities. London: Regional Studies Association.