
 ?Mathematical formulae have been encoded as MathML and are displayed in this HTML version using MathJax in order to improve their display. Uncheck the box to turn MathJax off. This feature requires Javascript. Click on a formula to zoom.
Abstract
As China’s outwards foreign direct investment (OFDI) has grown dramatically, the environmental impact of the production activities of Chinese multinational enterprises (MNEs) has received substantial attention. Using a multiregional input-output model reflecting firm heterogeneity, this study measures the carbon footprint (CF) and value-added (VA) of Chinese MNEs’ foreign affiliates to quantify the trade-off between economic benefits and environmental damage. The results show that Chinese MNEs’ affiliates’ CF is not large but grows quickly, mainly driven by investment and scale effects. The CF of foreign affiliates is primarily distributed in resource-intensive countries. The economic-environmental effect of Chinese MNEs’ foreign affiliates is heterogeneous across countries and sectors. The best performance is found in the manufacturing sectors of most developing countries, with the worst performance in the service sectors of developed countries. Chinese MNEs’ affiliates can transfer clean technology from developed host countries to China through reverse technology spillovers.
Introduction
With the inception of the ‘“Go ’Out” policy in 1999, Chinese outwards foreign direct investment (OFDI) began to grow dramatically. This trend gained momentum when China launched its Belt and Road Initiative (BRI) in 2013. China became the second largest investor country in 2020, falling by 6% to USD 145 billion in 2021, but it is still the fourth largest source of investment [Citation1]. Compared with developed economies, China is faced with more criticism because some people argue that it has failed to specifically restrict or prohibit investment in carbon-intensive and fossil fuel industries in its overseas investments. This may increase its carbon emissions and will likely prevent many countries from meeting their carbon reduction commitments in the Paris Agreement [Citation2, Citation3]. Given these current trends, some people view the BRI as simply a means for China to ‘“’export” its polluting model of development to other countries [Citation4]. Faced with criticism, China announced it would step up its support for other developing countries in promoting green and low-carbon energy and not build new coal-fired power projects abroad. Therefore, measuring the environmental impact of China’s overseas investments and testing whether they transfer emissions to other countries is of great significance.
This study aimed to analyze the carbon footprint (CF) of foreign affiliates of Chinese multinational enterprises (MNEs) from the perspective of their trends, driving factors, and regional and sectoral distribution. It compares the CF per value-added (VA) of Chinese MNEs’ foreign affiliates in each sector with that of domestic enterprises (DOEs) in host countries to measure the environmental performance of affiliates in different regions. The analysis uses an environmentally extended multiregional input-output (MRIO) model reflecting firm heterogeneity. The model measures Chinese MNEs foreign affiliates’ CF, which includes all emissions incorporated in the finished goods produced by Chinese MNEs’ foreign affiliates.
This study makes three novel contributions to the existing literature. First, the CF of foreign affiliates of Chinese MNEs was calculated using data from 2005 to 2016 (the most recent available data). This study sheds light on the environmental impact of China’s overseas investments. Second, an environmentally extended MRIO model reflecting firm heterogeneity captures the linkages between industries and between MNEs’ foreign affiliates and non-MNEs in host countries. Finally, a new indicator of CF-VA intensity was introduced to assess the trade-off between the economic and environmental impacts of foreign affiliates of Chinese MNEs.
Literature review
The environmental impact of foreign direct investment (FDI) has received substantial attention for a long time and is mainly explained by two hypotheses: the pollution haven hypothesis and the halo pollution hypothesis [Citation5]. The pollution haven hypothesis argues that polluting industries often relocate production from countries with more stringent environmental policies to those with less stringent policies, leading to a positive relationship between FDI inflow and emissions [Citation6–14]. By contrast, the pollution halo hypothesis argues that developed countries transfer their greener technologies, such as pollution abatement, renewable energy-related technologies, and energy-conserving technologies, to host countries. As a result, FDI reduces emissions in host countries [Citation15–20].
Research on the environmental effects of Chinese OFDI is increasing, especially in the Belt and Road countries. Several studies show that China’s OFDI has a detrimental effect on environmental quality, validating the pollution haven hypothesis in the BRI region [Citation21,Citation22]. In contrast, numerous studies have confirmed the validity of the pollution halo hypothesis, finding that China’s OFDI is conducive to reducing CO2 emissions in host countries because it improves host countries’ green total factor productivity, leads to energy efficiency convergence, and generates an emissions-reduction effect in Belt and Road countries [Citation23–25].
As executors of OFDI, MNEs not only have environmental impacts on the firms themselves but also beyond the borders of their country of origin. Recently, MNEs and their foreign affiliates have been at the center of research because they are responsible for a significant share of the total CF in large economies. For instance, the activity of US MNEs’ foreign affiliates beyond their country’s borders accounted for 0.508 gigatonnes (Gt) of CO2, representing 9.8% of the CO2 emissions released within US borders and 1.5% of the world’s global emissions in 2009 [Citation26]. MNEs’ foreign affiliates operating within the European Union (EU) generate 17% of the total CF of the EU but only 12% of the total value added [Citation27]. The CF of MNEs’ foreign affiliates in China grew from 366.23 Mt in 2005 to 601.87 Mt in 2016, with an average annual growth rate of 5.85% [Citation28]. Globally, the share of carbon emissions embodied in the supply chains of foreign affiliates of MNEs accounted for 18.7% of global emissions in 2016. The CFs of MNEs hosted by advanced economies were higher than those hosted by emerging markets and developing economies [Citation29, Citation30]. The global supply chain-based emission intensities of MNEs are higher than those of non-MNEs, and MNEs in most countries contribute more to carbon emissions than value-addedalong their supply chains [Citation31, Citation32].
Existing studies mainly assess the CF of MNEs hosted by China [Citation28] but do not measure the CF of MNEs originating in China. The emissions embodied in the international supply chains of Chinese MNEs’ foreign affiliates are poorly understood. To fill this gap, we apply an environmentally extended MRIO model that reflects firm heterogeneity to estimate the CF and VA of Chinese MNEs’ affiliates from 2005 to 2016. Our study extends the literature by contributing to several fields. First, it attempts to provide a time series of the CF of Chinese MNEs’ foreign affiliates, which allows us to illuminate the changing trends in the CF of Chinese MNEs’ foreign affiliates and to pay more attention to the global investment carbon transfer from developing countries, such as China, whose impact is small but has huge potential. Second, this study applies an environmentally extended MRIO model to reflect firm heterogeneity. Most previous studies have used econometric models. An economy is a large and complex system in which a change in the production demand of one sector or economy affects the factor inputs and outputs of other sectors or economies. Econometric models cannot describe the impact of indirect economic correlations between industries, whereas MRIO models are effective at capturing such correlations. Third, the environmental impact of Chinese MNEs’ affiliates is based on the total volume and the CF/VA. A high CF of the firms is not necessarily harmful because its production also generates wealth and employment. Hence, it is worth assessing the tradeoff between the generation of CF and VA. We also introduce a new CF/VA intensity indicator to measure the economic-environmental trade-off between Chinese MNEs’ foreign affiliates and DOEs in host countries in the same country and sector.
Materials and methods
Environmentally extended MRIO theory and model
The detailed theoretical framework of MRIO models can be found in Miller and Blair [Citation33]. These models have been widely used to estimate the environmental impacts of international trade and investment [Citation26–32, Citation34]. The general equation for this estimate is as follows:
(1)
(1)
where E is the carbon emissions worldwide.
is the diagonalized vector of the emission coefficients in each sector in every region.
is the Leontief inverse matrix, in which A is the direct coefficient matrix and I is the identity matrix. Where Y is the total final demand matrix. The global carbon emissions matrix is represented as follows:
(2)
(2)
where Y is the final demand vector whose elements
represent the output produced by country r and consumed by the final demand of country s.
Thus, summing matrix E along the rows results in production-based emissions of producer country (r) and summing by columns results in consumption-based emissions of consumer country (s).
CF of MNEs’ foreign affiliates
Using the accounting approach to CF proposed by Lopez et al. [Citation26] and Ortiz et al. [Citation27], we calculated the CF of MNEs’ foreign affiliates. In this approach, we rewrite the structure of the final demand matrix and do not distinguish between domestic and foreign final demands; thus, all off-diagonal elements of the matrix are zero. Therefore, EquationEquation (1)(1)
(1) is adapted for CF accounting as follows:
(3)
(3)
where
is a diagonalized vector whose elements represent the total final demand, domestic and foreign, that is satisfied by country r. Therefore, the total sum of matrix
results in the same amount of emissions as matrix E in EquationEquation (2)
(2)
(2) , and summing by rows of
also results in the production-based emissions by producer country; however, summing the matrix
by columns results in the CF by producer country. It considers all the emissions emitted in country r that are incorporated into the finished goods produced within the boundaries of country s and allocates those emissions to country s, regardless of whether those goods are subsequently exported or domestically consumed.
The CF of MNEs’ foreign affiliates are estimated using this accounting approach. Such an estimate requires input-output data according to the heterogeneity of the companies’ size or the foreign/domestic nature of their owners. Therefore, we construct an environmental MRIO model that distinguishes the firm heterogeneity between DOE and foreign-owned enterprises (FOE).
Then, EquationEquation (3)(3)
(3) can be written as,
(4)
(4)
Suppose is a diagonalized vector whose elements for DOE are zero and the elements for FOE are
which captures the percentages of every production sector originating from the MNEs’ foreign affiliates of China operating in every country worldwide. Therefore, the emissions emitted worldwide and embodied in the finished goods produced by Chinese MNEs’ foreign affiliates, that is, the CF of Chinese MNEs’ foreign affiliates, can be written as:
(5)
(5)
Summing the columns results in the CF of Chinese MNEs’ foreign affiliates for their entire production (including exports) in the host country. For instance, the expression
captures the emissions induced by the final production of foreign affiliates of Chinese MNEs in Country 1.
Structural decomposition analysis
If we rewrite EquationEquation (5)(5)
(5) as
(6)
(6)
The change in CF of Chinese MNEs’ foreign affiliates can be expressed as
(7)
(7)
We adopted a structural decomposition analysis (SDA) to analyze the driving factors of the CF of Chinese MNEs’ foreign affiliates. SDA has been widely used to study the driving forces of changes in energy and emissions over time [Citation35–37]. There are different decomposition approaches. This study adopted a two-polar decomposition approach, which can be viewed as an approximation of the average of all equivalent decompositions [Citation38]. The change in the CF of Chinese MNEs’ foreign affiliates can be expressed as
(8)
(8)
According to the approach of SDA used by Zhang et al. [Citation29], the changes in EquationEquation (8)
(8)
(8) may be decomposing into four components: the effects of the changes
in the carbon emission per unit (carbon intensity effect); the effects of the changes in
in production structure (structure effect); the effects of the changes
in the investment (investment effect); the effects of the changes
in the final demand levels (scale effect).
Data sources
An inter-country input-output table and data on carbon emissions from fossil fuel combustion at the industrial level were used in this study.
Firstly, we use the world input-output table distinguishing firm ownership from the Analytical Activities of MNEs (AMNE) database. It is a newly published time series interregional input-output table constructed by the OECD and captures firm heterogeneity for 59 countries and the rest of the world (ROW). 34 unique industrial sectors are covered and integrated into 15 sectors (see Appendix A). Intercountry input (ICIO) tables split according to ownership (DOEs and FOEs) were used to construct the MRIO model in this study.
Second, the AMNE database includes a full matrix of the output of foreign affiliates in 60 countries (regions) in the host country, industry, and parent country dimensions, as well as matrices for value-added, exports, and imports of intermediate inputs (host country and industry) over the period 2005–2016. The elements of vector are obtained from the matrix, which captures the percentages of every production sector originating from foreign affiliates of Chinese MNEs operating in every host country.
Third, we calculate the carbon emissions coefficients for DOEs and FOEs by sector. Concerning carbon emissions by firm type, no data are available on carbon emissions or the use of intermediate energy by DOEs or FOEs within each industry and region. Referring to several studies [Citation28–30], we estimate the carbon emissions coefficient at the sectoral level by firm ownership. The aggregate numbers of the input-output table and the balance condition were adopted as strict constraints. Assuming that there is no difference in the energy price across firms, that is, all firms face the same market price for a specific type of energy [Citation39], we first collect CO2 emissions data from fuel combustion by country and industry provided by the IEA and then use the energy intermediate inputs (including mining and extraction of energy-producing products, coke, and refined petroleum products) in the tables to proportionally allocate the CO2 emissions by sector and firm ownership.
Results
The CF of Chinese MNEs’ affiliates and its driving factors
The CF of Chinese MNEs’ foreign affiliates increased quickly, although the increase was not significant. It grew from 12.78 million tonnes (Mt) in 2005 to 48.16 Mt in 2016, and its share in the CF of global foreign affiliates of MNEs has increased from 0.42% to 1.36% (). If foreign Chinese MNEs activity were to be cataloged as a country, it would be ranked the 58th top emitter in the world in 2016. The CF of Chinese MNEs’ foreign affiliates was similar to that of Peru (52.2Mt) and greater than those of Portugal (+3.66%), Singapore (+4.34%), Finland (+6.66%), Hungary (+10.01%), Bulgaria (+18.79%), Switzerland (+27.78%), Denmark (+41.23%), and New Zealand (+58.31%) in 2016. In this list, Chinese MNEs’ CF is closer to that of countries such as Belarus (−9.14%), Morocco (-12.91%), and Austria (−21.90%). In recent years, China has increased its investment in emerging economies after establishing the Asian Infrastructure Investment Bank and Silk Road Fund to strengthen investments in developing countries along the B&R. Although the CF of Chinese MNEs’ foreign affiliates is far from that of the top-emitting countries, the intermediate position they achieved placed polluting Chinese MNEs activity abroad among some of the most developed economies in the world. With the notable growth trend in China’s OFDI, the emissions impact of Chinese MNEs’ foreign activity should be a major focus for policymakers.
Figure 1. Trends of the CF of Chinese MNEs’ affiliates.
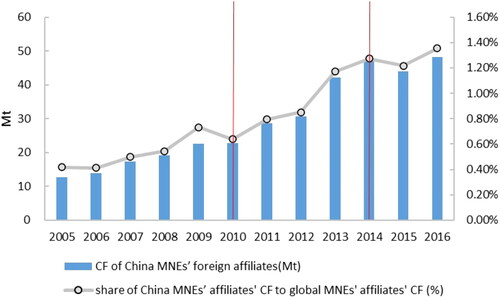
The changing of Chinese MNEs’ affiliates can be roughly divided into three stages. In the first stage (2005–2010): it increased slowly. The CF increased from 12.78 Mt to 22.82 Mt with an annual growth rate of 15.71%, and its share of the CF of global MNEs’ foreign affiliates increased from 0.42% to 0.64%. During the second stage (2010–2014): they rapidly increased. The CF increased from 22.82 Mt to 47.46 Mt with an annual growth rate of 27%, and its share of the CF of global MNEs’ foreign affiliates increased from 0.64% to 1.27%. In the third stage (2014–2016): It was almost stable, the CF increased from 47.46 Mt to 48.16 Mt with an annual growth rate of 0.47%, and its share to the CF of global MNEs’ foreign affiliates increased to 1.36%.
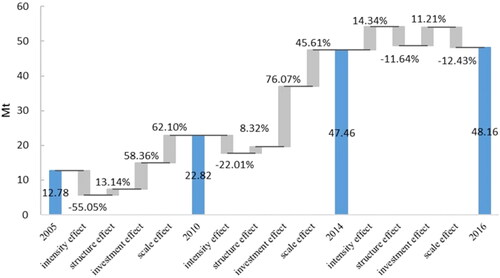
SDA helps understand the driving factors of the change in Chinese MNEs affiliates’ CF (). In the first stage (2005–2010), the CF of Chinese MNEs’ affiliates increased by 78.55%. The major driving factor for this increase was the growth in the output of MNEs (scale effect), which caused the CF of MNEs to increase by 62.10% in the absence of other factors. Growth in investment (investment effect) increases the CF of MNEs by 58.36%. The decrease in carbon intensity offsets the CF of MNEs by approximately 55.05% (intensity effect), and the change in production structure plays a relatively modest role (+13.14%, structure effect). In the second stage (2010–2014), the CF of Chinese MNEs’ affiliates increased by 107.99% because of the "Belt and Road" Initiative in 2013, which promoted an increase in China’s OFDI. The investment effect was the major contributor, increasing CF by 76.09%. Investments also drove an increase in output, which led to a scale effect that increased carbon emissions by 45.61%. The structure effect (+8.32%) was also a contributor, whereas the intensity effect decreased the CF of Chinese MNEs’ affiliates by −22.01%. After peaking in 2014, the CF of MNEs began to decline. In the third stage (2014–2016), the CF of Chinese MNEs’ affiliates decreased by +1.48%. Structural and scale effects decrease the carbon footprint of MNEs by −11.64% and −12.43%, respectively. However, both the intensity effect (+14.34%) and the investment effect (+11.21%) played important roles in driving the CF of MNEs. Generally, the intensity effect is the main offsetting factor for the growth of CF; however, the intensity effect is positive in the third stage. An important reason is that the carbon emissions coefficients of several high-emission sectors increased, which is a very prominent phenomenon in high-emission sectors, such as electricity, chemicals, and transport. Therefore, scale and investment effects are the main contributors to increasing the CF. Still, the intensity effect is the main offset factor, and the structure effect plays a relatively modest role.
Figure 2. Driving factors of the CF of Chinese MNEs’ affiliates.
’The regional distribution of Chinese MNEs’ foreign affiliates’ CF
Regarding the geographical distribution of Chinese MNEs’ foreign affiliates’ CF, it seems that the factor endowment of the host countries is an important driver for the localization of Chinese MNEs’ affiliates because most of their CF was generated in resource-intensive economies (). In 2005, 55.02% of the CF of Chinese MNEs’ foreign affiliates was concentrated in developing countries. Still, this number decreased to 44.89% in 2016, indicating that the CF of Chinese MNEs’ foreign affiliates in developed economies surpassed that in developing economies. India was the largest host region with 1.31 Mt of CF, which accounted for 10.25% of Chinese MNEs’ foreign affiliates’ CF in 2005, followed by Australia (1.00 Mt, 7.84%), South Africa (0.98Mt, 7.70%), Turkey (0.91 Mt, 7.11%), and Malaysia (0.80Mt, 6.25%). These five countries alone gathered 39.16% of the CF induced by Chinese MNEs’ foreign affiliates. In 2016, 56.44% of the CFs of foreign affiliates’ was from developed economies. Chinese Hong Kong was the largest host economy, accounting for 17.21% of China MNEs’ foreign affiliates’ CF because Chinese Hong Kong was the leading destination of FDI from the Chinese mainland, followed by the United States (6.63 Mt, 13.76%), India (5.69 Mt, 11.82%), South Africa (2.19 Mt, 4.55%), and Russia (2.15 Mt, 4.46%). Together, they account for 51.80%, indicating that the CF of Chinese MNEs’ foreign affiliates was more evenly concentrated in 2016 than in 2005. Compared with 2005, the CF of Chinese MNEs’ affiliates in developed economies (such as Hong Kong, the United States, and Canada) increased significantly in 2016 because of the change in the host country’s policies and China’s OFDI motivation. Due to American manufacturing reshoring and global trade protectionism, Chinese MNEs have increased their OFDI in the United States to bypass trade barriers.
Figure 3. Geographical distribution and decomposition of Chinese MNEs’ foreign affiliates’ CF.
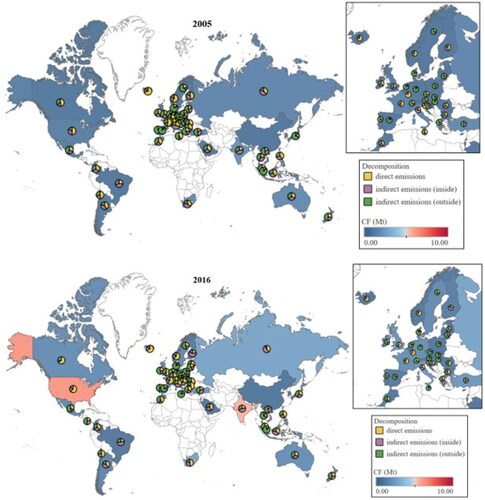
Because MNEs producing a specific final product may induce carbon emissions in all upstream countries and sectors, both directly and indirectly. The CF of Chinese MNEs’ foreign affiliates can be decomposed into three parts: direct emissions from the affiliates of Chinese multinationals, indirect emissions inside the host country, and indirect emissions outside the host country. The decomposing results in show several findings: In the US and several EU countries (Iceland, France, Norway), direct emissions account for more than 50% of the CF of Chinese MNEs’ affiliates. However, in emerging markets and developing economies, such as India, Russia, Brazil, and South Africa, indirect emissions inside the host country account for the largest share because firms in host countries are increasingly engaged in production-sharing activities with Chinese MNEs, particularly as upstream intermediate goods suppliers of MNEs. In addition, in most EU members (Germany, Hungary, Denmark) and most countries in South and Southeast Asia (Singapore, Japan), indirect emissions outside the host country account for the largest share because the production of Chinese MNEs’ affiliates highly depends on abroad; they import lots of intermediate goods from outside the host country.
’’The sectoral distribution of Chinese MNEs’ foreign affiliates’ CF
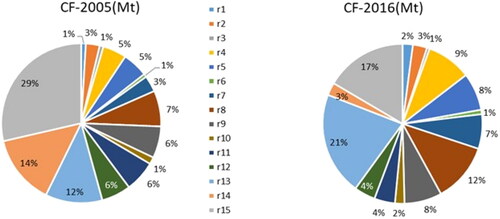
Chinese MNEs’ foreign affiliates’ CF is concentrated in the service sector (). This can be explained by China’s OFDI, which is mostly concentrated in services. In 2005, the service sector accounted for 61% of Chinese MNEs’ foreign affiliates’ CF: Wholesale trade (r12, 6%), Transport (r13,12%), Finance, insurance, real estate (r14, 14%), and Other services (r15, 29%). In 2016, the service sector’s CF share decreased to 44%: r12 (4%), r13 (21%), r14 (3%), and r15 (17%). The largest increase was observed in the CF share of r13, which increased from 12% to 21%. The largest decrease was observed in the CF shares of r14 and r15. As China’s OFDI in services declines, its share of CF decreases further. Among the manufacturing sectors, Machinery (r8, 7% in 2005; 12% in 2016), Vehicles (r9, 6% in 2005; 8% in 2016), Energy (r4, 5% in 2005; 9% in 2016), Chemicals (r5, 5% in 2005; 8% in 2016) are the four sectors with the largest CF, which can be explained by the high direct carbon intensity of several industrial sectors and high consumption of intensive energy inputs. According to data from the Ministry of Commerce of China, China’s OFDI in manufacturing rose by 22.4% to USD 26.87 billion in 2021, accounting for 10.8% of China’s OFDI, whereas it only accounted for 8% in 2016. This means that the CF of Chinese MNEs’ foreign manufacturing affiliates would increase in volume and share.
Figure 4. Sectoral distribution of Chinese MNEs’ foreign affiliates’ carbon footprint.
’’The CF/VA intensity of Chinese MNEs’ foreign affiliates and DOEs in host countries
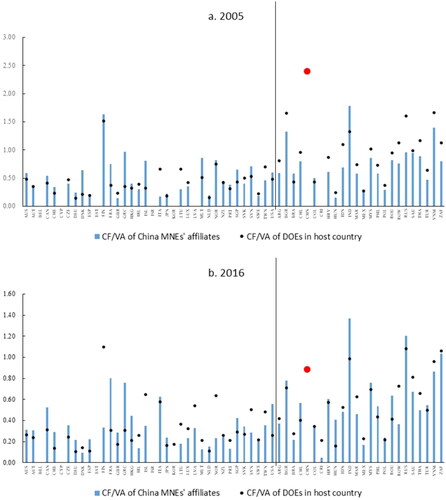
High CF related to Chinese MNEs’ foreign affiliates is not necessarily harmful because MNEs’ production generates wealth and employment in host countries. Hence, it is worth assessing the performance of Chinese MNEs’ affiliates in each host country to evaluate the tradeoff between CF and VA. This trade-off is calculated as the difference between the CF/VA of Chinese MNEs’ affiliates and the CF/VA of DOEs in host countries. Suppose the CF/VA of Chinese MNEs’ affiliates is less than that of DOEs. In that case, the net impact of Chinese MNEs’ affiliate operations in this country might contribute to global emission reduction because they are more carbon efficient and bring more value and less carbon than DOEs.
shows the CF/VA intensity of Chinese MNEs’ affiliates and DOEs in the host countries. The general picture indicates that firms in 2016 had lower intensities than those in 2005, regardless of whether they were Chinese MNEs’ affiliates or DOEs in host countries. Our findings show that the CF/VA intensity of Chinese MNEs’ affiliates is higher than that of DOEs in most developed countries (left of black line), and it was more obvious in Greece, Iceland, Denmark, and France in 2005 and in France, Greece, the US, and Canada in 2016. However, the CF/VA intensity of Chinese MNEs’ affiliates is much lower than that of DOEs in most developing countries (countries on the right of the black line), especially in Russia, Indonesia, the ROW, and South Africa in 2005, and the ROW, Costa Rica, Morocco, and Thailand in 2016. also shows that the CF/VA intensity of Chinese MNEs’ affiliates in most host countries is lower than that of DOEs in China (big red dots), which means that the production of Chinese MNEs’ affiliates in most host regions is lower than that in China.
Figure 5. CF/VA intensity of Chinese MNEs’ affiliates and DOEs in host countries.
compares the CF/VA intensity of Chinese MNEs’ affiliates and DOEs in 59 host countries for the six selected sectors in 2005 and 2016, helping to explain why Chinese MNEs’ foreign affiliates are less carbon-intensive than many DOEs in host countries. Although the comparisons between the CF/VA intensities of Chinese MNEs’ affiliates and DOEs are heterogeneous across sectors and countries, some general findings can be highlighted.
Figure 6. CF/VA intensity of Chinese MNEs’ affiliates and DOEs for six selected sectors.
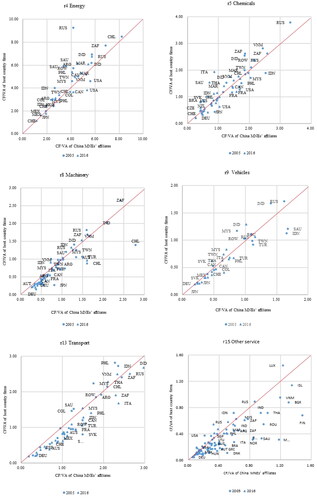
First, the two charts in the top row depict sectors (r4 Energy and r5 Chemicals) in which Chinese MNEs’ affiliates tend to produce with lower CF/VA intensities than DOEs in host countries in 2005 and 2016, respectively, yet exceptions are found in some countries. Chinese MNEs’ affiliates in the energy sector in the US and Canada and chemicals in Indonesia, Malaysia, and the US are remarkable exceptions, as their CF/VA intensity is significantly lower than that of DOEs in the corresponding sectors. These exceptions may be because Chinese MNEs’ affiliates and DOEs produce different products within the same sector or because they produce the same product but with low-carbon technologies in the case of Chinese MNEs’ affiliates.
Second, the CF/VA intensities in the middle two charts (r8 Machinery and r9 Vehicles) were completely heterogeneous, as the 59 countries were scattered along both sides of the 45°reference line. In the machinery sector, the performance of Chinese MNEs’ affiliates in South Africa, Russia, Indonesia, and India is cleaner than that of DOEs; however, they have a higher CF/VA intensity than DOEs in most countries (e.g. Chile, Australia, Turkey, and Japan). In contrast, in the vehicle sector, Chinese MNEs’ affiliates are significantly cleaner than DOEs in India, Russia, and Malaysia and more carbon-intensive than DOEs in Indonesia, Saudi Arabia, and Turkey.
Finally, the charts in the bottom row display sectors (r13 Transport and r15 Other service) where Chinese MNEs’ affiliates are generally more carbon-intensive than DOEs in host countries. We highlight the relatively high intensities of Chinese MNEs’ affiliates operating in several host countries, such as Italy, India, Russia, South Africa, and Slovakia in transport and Finland, Malta, Saudi Arabia, Bulgaria, and Romania in other services. Recalling that sectors with a higher share of Chinese MNEs’ affiliates’ CF are Transport and Other services, the higher carbon intensities of Chinese MNEs’ affiliates in those sectors (compared to DOEs) contribute to the adverse economic environmental trade-off derived from Chinese MNEs’ affiliates’ production in their respective host countries. Considering the results shown in , Chinese MNEs investing in the service sector have extensive room for action to reduce their CF, which should be a priority in contributing to reductions in global emissions.
Discussion
Enterprises are at the forefront of climate action, and Chinese MNEs engage in OFDI, allowing them to have substantial influence over the entire supply chain. Using an environmentally extended MRIO that reflects firm heterogeneity, this study traces the CF and VA of Chinese MNEs’ foreign affiliates to determine the environmental and economic impacts of China’s OFDI on host countries. The main conclusions are as follows:
The CF of Chinese MNEs’ foreign affiliates grew quickly, although by a small amount. Scale and investment effects are the main contributors to the increase in CF, whereas the technological effect is the main offset factor.
The factor endowments of host countries are an important driver for localizing Chinese MNEs’ affiliates because most of their CF was generated in resource-intensive economies. If we trace the CF of Chinese MNEs’ foreign affiliates to where they are produced and find that direct emissions account for more than 50% of Chinese MNEs’ affiliates’ CF in the US and several EU countries, indirect emissions inside the host country account for the largest share in emerging markets and developing countries, while indirect emissions outside the host country account for the largest share in most EU members and most countries in South and Southeast Asia.
The CF of Chinese MNEs’ foreign affiliates is concentrated in the service sector. Among the manufacturing sectors, Machinery, Vehicles, Energy, and Chemicals have the largest CF.
Generally, the CF/VA intensity of Chinese MNEs’ affiliates are lower than that of DOEs in most developing countries but higher than that of DOEs in most developed countries, which is verified by comparing the CF/VA intensity of Chinese MNEs’ affiliates and DOEs in host countries in six selected sectors.
Policy implications
Based on the results of this study, several policy implications were identified. First, increasing and intensifying market signals are necessary to encourage MNEs to adopt immediate strategies to pursue green supply chain management. There was notable growth in the CF trend of Chinese MNEs’ foreign affiliates, so the volume of carbon emissions in the supply chain of developing countries could increase in the future and should be a major focus of policymakers. Therefore, MNEs should adopt immediate strategies to reduce carbon emissions generated worldwide through their global supply chains and widen the scope of applied measures or standards for sustainable sourcing practices. Policymakers should create a regulatory framework to encourage all companies (DOEs and FOEs) to follow green supply chain management.
Second, policies aimed at reducing the CF of Chinese MNEs’ affiliates face different challenges in developing and developed countries. In developing countries, the offshoring of Chinese MNEs has a remarkable impact on some sectors regarding carbon emissions and value-added. Chinese MNEs have the power to exercise substantial influence over the entire supply chain and are key agents in the fight against climate change because of their environmental and economic influence. In the case of developed countries, there are some sectors in which Chinese MNEs’ affiliates are more carbon-intensive, which means that Chinese MNEs’ affiliates have extensive room for action to reduce their CF, which should be a priority in contributing to global emissions reduction. MNEs emerge as vehicles to transfer low-carbon technologies and practices across countries and industries, and Chinese MNEs’ affiliates can transfer clean technology from developed host countries to China through reverse technology spillovers. Considering the climate policy developments in recent years and the increasing implementation of environmental regulations in developed countries, Chinese MNEs operating in these countries should work to improve their economic and environmental performance before overreliance on carbon emissions affects their businesses from multiple perspectives.
Limitations
This study can be extended and improved in the future because of the eventual disclosure of input-output tables reflecting firm heterogeneity. However, the current lack of data causes some uncertainties and limitations in our approach.
First, due to the limitation of data sources, the data used in this study are only updated to 2016, which does not reflect new trends, especially the impact of the pandemic on the CF of Chinese MNEs’ foreign affiliates. To our knowledge, only the OECD AMNE database provides intercountry input-output tables reflecting firm heterogeneity between DOEs and FOEs. We update our study once the data in the ICIO tables distinguish between ownership updates.
Second, our estimation relies on the assumption that Chinese MNEs’ foreign affiliates use the same emission intensity as the foreign affiliates of other countries’ MNEs at the sector level in every host country, which implies that our results highly depend on the structure of China’s OFDI across sectors. Future estimations should consider the differences in emission intensity and energy efficiency between foreign affiliates of Chinese MNEs and MNEs of developed countries.
Supplemental Material
Download (51.5 KB)Data availability statement
The author confirms that the data supporting the findings of this study are available within the article and its supplementary materials.
Disclosure statement
No potential conflict of interest was reported by the author.
References
- UNCTAD. World Investment Report 2022: international tax reforms and sustainable investment. UNCTAD 2022.
- Gallagher KS, Qi Q. Chinese overseas investment policy: implications for climate change. Glob Policy. 2021;12(3):260–272. doi: 10.1111/1758-5899.12952.
- Voituriez T, Yao W, Larsen L. M. Revising the ‘host country standard’ principle: a step for China to align its overseas investment with the Paris agreement. Clim Policy. 2019;19:1–6.
- Tracy EF, Shvarts EA, Simonov E, et al. China’s new Eurasian ambitions: the environmental risks of the silk road economic belt. Eurasian Geogr Econ. 2017;58(1):56–88. doi: 10.1080/15387216.2017.1295876.
- Copeland BR, Taylor MS. North-South trade and the environment. Q J Econ. 1994;109(3):755–787. doi: 10.2307/2118421.
- He J. Pollution haven hypothesis and environmental impacts of foreign direct investment: the case of industrial emission of sulfur dioxide (SO2) in Chinese provinces. Ecol Econ. 2006;60(1):228–245. doi: 10.1016/j.ecolecon.2005.12.008.
- Levinson A, Taylor MS. Unmasking the pollution haven effect. Int Economic Rev. 2008;49(1):223–254. doi: 10.1111/j.1468-2354.2008.00478.x.
- Zeng D, Zhao L. Pollution havens and industrial agglomeration. J Environ Econ Manag. 2009;58(2):141–153. doi: 10.1016/j.jeem.2008.09.003.
- Chung S. Environmental regulation and foreign direct investment: evidence from South Korea. J Devel Econ. 2014;108:222–236. doi: 10.1016/j.jdeveco.2014.01.003.
- Shahbaz M, Nasir MA, Roubaud D. Environmental degradation in France: the effects of FDI, financial development, and energy innovations. Energy Econ. 2018;74:843–857. doi: 10.1016/j.eneco.2018.07.020.
- Cheng Z, Li L, Liu J. The impact of foreign direct investment on urban PM2.5 pollution in China. J Environ Manage. 2020;265:110532. doi: 10.1016/j.jenvman.2020.110532.
- Khurram S, Liu X, Sarfraz M. Envisaging the asymmetrical association among FDI, ICT, and climate change: a case from developing country. Carbon Manag. 2021;12:1–15.
- Singhania M, Saini N. Demystifying pollution haven hypothesis: role of FDI. J Bus Res. 2021;123:516–528. doi: 10.1016/j.jbusres.2020.10.007.
- Ahmad M, Jabeen G, Wu Y, et al. Heterogeneity of pollution haven/halo hypothesis and environmental kuznets curve hypothesis across development levels of Chinese provinces. J Clean Prod. 2021;285:124898. doi: 10.1016/j.jclepro.2020.124898.
- Cole MA, Elliott RJR, Strobl E. The environmental performance of firms: the role of foreign ownership, training, and experience. Ecol Econ. 2008;65(3):538–546. doi: 10.1016/j.ecolecon.2007.07.025.
- Al-Mulali U, Foon Tang C. Investigating the validity of pollution haven hypothesis in the Gulf cooperation council (GCC) countries. Energy Policy. 2013;60:813–819. doi: 10.1016/j.enpol.2013.05.055.
- Albornoz F, Cole MA, Elliott RJR, et al. The environmental actions of firms: examining the role of spillovers, networks and absorptive capacity. J Environ Manage. 2014;146:150–163. doi: 10.1016/j.jenvman.2014.07.011.
- Huang J, Chen X, Huang B, et al. Economic and environmental impacts of foreign direct investment in China: a spatial spillover analysis. China Econ Rev. 2017;45:289–309. doi: 10.1016/j.chieco.2016.03.006.
- Bu M, Li S, Jiang L. Foreign direct investment and energy intensity in China: firm-level evidence. Energy Econ. 2019;80:366–376. doi: 10.1016/j.eneco.2019.01.003.
- Tan R, Xu M, Qiao G, et al. FDI, financial market development and nonlinearities of energy and environmental efficiency in China: evidence from both parametric and nonparametric models. Energy Econ. 2023;119:106580. doi: 10.1016/j.eneco.2023.106580.
- Kamal M, Ullah A, Qureshi F, et al. China’s outward FDI and environmental sustainability in belt and road countries: does the quality of institutions matter? J Environ Planning Manag. 2023;66(5):1002–1036. doi: 10.1080/09640568.2021.2008883.
- Zhang Z-B, Dong W-Y, Tang Z-Y, et al. The carbon reduction effect of China’s outward foreign direct investment for carbon neutrality target. Environ Sci Pollut Res Int. 2022;29(55):83956–83968. doi: 10.1007/s11356-022-21712-x.
- Han L, Han B, Shi X, et al. Energy efficiency convergence across countries in the context of china’s belt and road initiative. Appl Energy. 2018;213:112–122. doi: 10.1016/j.apenergy.2018.01.030.
- Wu H, Ren S, Yan G, et al. Does China’s outward direct investment improve green total factor productivity in the “belt and road” countries? Evidence from dynamic threshold panel model analysis. J Environ Manage. 2020;275:111295. doi: 10.1016/j.jenvman.2020.111295.
- Jiang Q, Yang C, Wu J, et al. Examining the role of China’s outward direct investment in realizing carbon neutrality: empirical evidence from belt and road countries. Int J Emerg Mark. 2022;(3). doi: 10.1108/IJOEM-09-2021-1492.
- López L-A, Cadarso M-Á, Zafrilla J, et al. The carbon footprint of the U.S. multinationals’ foreign affiliates. Nat Comm. 2019;10(1):1672.
- Ortiz M, Cadarso MÁ, Lopez L. The carbon footprint of foreign multinationals within the European union. J Ind Ecol. 2020;24(6):1287–1299. doi: 10.1111/jiec.13017.
- Yan Y, Wang R, Chen S, et al. Mapping carbon footprint along global value chains: a study based on firm heterogeneity in China. Struct Change Econ Dyn. 2022;61:398–408. doi: 10.1016/j.strueco.2022.03.002.
- Zhang Z, Guan D, Wang R, et al. Embodied carbon emissions in the supply chains of multinational enterprises. Nat Clim Chang. 2020;10(12):1096–1101. doi: 10.1038/s41558-020-0895-9.
- Yan Y, Li X, Wang R, et al. Decomposing the carbon footprints of multinational enterprises along global value chains. Struct Change Econ Dyn. 2023;66:13–28. doi: 10.1016/j.strueco.2023.03.011.
- Duan Y, Jiang X. Pollution haven or pollution halo? A re-evaluation on the role of multinational enterprises in global CO2 emissions. Energy Econ. 2021;97:105181. doi: 10.1016/j.eneco.2021.105181.
- Ortiz M, Cadarso M-Á, López L-A, et al. The trade-off between the economic and environmental footprints of multinationals’ foreign affiliates. Struct Change Econ Dyn. 2022;62:85–97. doi: 10.1016/j.strueco.2022.05.005.
- Miller RE, Blair PD. Input-output analysis: foundations and extensions. 2nd ed. Cambridge: Cambridge University Press; 2009.
- Wiedmann T. A review of recent multi-region input–output models used for consumption-based emission and resource accounting. Ecol Econ. 2009;69(2):211–222. doi: 10.1016/j.ecolecon.2009.08.026.
- Xu Y, Dietzenbacher E. A structural decomposition analysis of the emissions embodied in trade. Ecol Econ. 2014;101:10–20. doi: 10.1016/j.ecolecon.2014.02.015.
- Su B, Ang BW. Structural decomposition analysis applied to energy and emissions: some methodological developments. Energy Econ. 2012;34(1):177–188. doi: 10.1016/j.eneco.2011.10.009.
- Lan J, Malik A, Lenzen M, et al. A structural decomposition analysis of global energy footprints. Appl Energy. 2016;163:436–451. doi: 10.1016/j.apenergy.2015.10.178.
- Dietzenbacher E, Los B. Structural decomposition techniques: sense and sensitivity. Econ Syst Res. 1998;10(4):307–324. doi: 10.1080/09535319800000023.
- Liu Y, Meng B, Hubacek K, et al. Made in china’: a reevaluation of embodied CO2 emissions in Chinese exports using firm heterogeneity information. Appl Energy. 2016;184:1106–1113. doi: 10.1016/j.apenergy.2016.06.088.