
 ?Mathematical formulae have been encoded as MathML and are displayed in this HTML version using MathJax in order to improve their display. Uncheck the box to turn MathJax off. This feature requires Javascript. Click on a formula to zoom.
Abstract
In the present study, it was explored how the volatility of the carbon neutrality concept index (CNCI) was affected by China economic policy uncertainty (CEPU) index, climate policy uncertainty (CPU) index, and geopolitical risk (GPR) index. According to the research of Amendola et al. the GARCH-MIDAS model was improved by introducing the realized kernel volatility of China stock market into the short-term volatility component. On this basis, the GARCH-RKV-MIDAS model was constructed. Meanwhile, both GARCH-MIDAS and GARCH-RKV-MIDAS models were applied to identify the influencing factors for CNCI volatility during the period between January 2018 and June 2022, with CNCI predicted. According to the research results, both the CPU index and the GPR index exert a significant effect on the long-term volatility of CNCI, despite no significant difference made by the CEPU index to the long-term volatility of CNCI. As for the prediction of CNCI volatility, the GARCH-RKV-MIDAS model clearly outperforms the GARCH-MIDAS model. Moreover, the CPU index outperforms the GPR index and the CEPU index in predicting the volatility of the CNCI.
Introduction
At present, climate change has become a global issue [Citation1–4]. Because of climate change, the global temperature is on the rise continuously. In order to restrict the rise of the global average temperature to less than 1.5 °C, the Paris Agreement was signed in April 2016 by many countries around the world. Held in November 2022, the 27th Conference of the Parties to the United Nations Framework Convention on Climate Change was themed with implementation, which particularly manifests the appeal of African and other developing countries to deliver on the promise of reducing carbon emissions and their request for funding and technical support from advanced nations. This illustrates the high priority given by COP27 to the transition of developing countries into low-carbon economies. As the world’s largest energy consumer as well as carbon emitter, China contributes one-third to global carbon dioxide emissions. Therefore, the rate of reduction in China plays an essential role in achieving the goals set out in the Paris Agreement. China has committed itself to increasing its own contribution, enforcing more effective policies and measures, striving to reach the peak of carbon dioxide emissions before 2030, and endeavoring to achieve carbon neutrality before 2060. This goal is aligned with the suggestion made by the Intergovernmental Panel on Climate Change (IPCC) to achieve carbon neutrality by the middle of this century. Carbon neutrality is closely associated with a range of different economic sectors such as agriculture, industry, productivity, and energy [Citation5–9]. Since carbon neutrality contributes to ecological sustainability, there have been many scholars exploring how to reduce carbon emissions for improved ecological sustainability from different perspectives [Citation10–14]. For the smooth transition from peak carbon to carbon neutrality, it would take 30 years for China to complete the 60-year journey that Western countries have experienced. Given no similar cases in the world as a reference, China must explore its own pathway to carbon neutrality.
Closely related to the achievement of carbon neutrality targets, the patterns of economic growth have an immediate impact on both energy efficiency and emissions reduction [Citation12]. The choice of economic growth mode cannot be made without the macroeconomic policies of the state government, and the changes in these policies increase not only the complexity of economic operations but also the uncertainty of economic policies. Naturally, economic policy uncertainty has effects on a country in terms of carbon emissions [Citation15–17], which further affects the fluctuations of carbon neutrality. In China, there has been an increase in the uncertainty of economic policy about macroeconomic operations and the corresponding economic policy operations. However, China as an emerging market is still not comparable to the EU, and there remains controversy surrounding the impact of China’s economic policy uncertainty on the carbon market. Therefore, it is necessary to further explore its impact on carbon-neutral volatility.
In recent years, an increasing number of scholars have paid attention to the fact that carbon emissions are affected not only by economic policy uncertainty but also by climate policy uncertainty. Prompted by global warming that has evolved into a global concern, many governments around the world have been adapting the formulation and implementation of climate policies to the practicalities in their own nation. By improving energy efficiency and increasing the utilization of renewable energy sources, climate policies promote the diffusion of low-carbon technologies and reduce carbon emissions [Citation18,Citation19]. As one of the policy tools of national macro-control, climate policy plays a similar role to economic policy, which also has an adverse effect on the stability of carbon emissions [Citation20–22].
So far, there have been plenty of studies showing that various geopolitical risks, such as the trade frictions between the US and China, Brexit, and the Russia-Ukraine conflict, can affect economic growth, financial development, and energy consumption as well [Citation23–29]. In general, geopolitical risks tend to exert influence on economic expectations and investment decisions, e.g. investments flow to those lower-yielding but relatively safe sectors in order to hedge against risk. Ultimately, business economic cycles are affected, which influences the financial market [Citation30–32]. In particular, extreme geopolitical risks increase the fear among investors and trigger abnormal market volatility, even causing an imbalance in global energy supply and demand [Citation33]. Given the recent rise in global geopolitical risks, it is absolutely necessary to pay more attention to the interrelationship between geopolitical risks, energy markets, and carbon emissions.
In summary, it is of much significance to improve the practice of policy design and top-level decision-making by exploring the impact of policy uncertainty (economic policy uncertainty, climate policy uncertainty) and geopolitical risk on carbon neutral change in the context of low carbon development. There are a number of reasons why China is taken as the research object in this paper. Firstly, the reform of China’s economic system is deepening at this stage and there is a high level of policy uncertainty, for which widespread attention has been attracted from countries around the world. Secondly, the geopolitical environment is complex and volatile in China, where geopolitical risks tend to have a more significant impact. Once again, China, as the world’s largest carbon emitter, attaches much significance to achieving energy transition. Obtained from the study of carbon neutral fluctuations in China, the empirical evidence shows substantial reference value and significance for other major carbon emitters, including developed and developing countries. Also, it is beneficial in enhancing the security of the energy market in other countries. In the existing studies, the impact of policy uncertainty and geopolitical risks on carbon emissions is commonly analyzed from the perspective of the real economy, with little attention paid to the capital markets. Apparently, the capital market shows a greater sensitivity to the changes in policy uncertainty and geopolitical risk, which necessitates a study on the volatility of carbon-neutral indices in the capital market.
The practical implication of exploring the volatility of the Carbon Neutral Concept Index is reflected in two aspects. On the one hand, carbon-neutral concept stocks are possibly worthy of long-term investment. On the other hand, the healthy development of carbon-neutral listed companies is essential for achieving the above-mentioned carbon neutrality goals. On this basis, this paper aims to further enrich the existing research findings by estimating the impact of policy uncertainty and geopolitical risk on carbon-neutral volatility in the capital market. As a continuation of the previous research, this study focuses on two aspects. On the one hand, according to [Citation34], the realized kernel volatility (RKV) of the Shanghai 180 Index (representing the stock market volatility) is factored into the GARCH-MIDAS model to construct the GARCH-RKV-MIDAS model. Unlike the traditional GARCH-MIDAS model, the RKV of the Shanghai 180 Index is introduced into the short-term volatility of the GARCH-MIDAS model, which takes into account the impact of stock market volatility on the short-term volatility of the carbon neutrality concept index. Meanwhile, it is examined how policy uncertainty and geopolitical risk affect the long-term volatility of the carbon neutrality concept index. On the other hand, the GARCH-RKV-MIDAS model and GARCH-MIDAS model are applied to predict the volatility of the carbon neutrality concept index, with sample-out and MCS as the criteria to evaluate the predictive performance of different models comparatively. Notably, there are two assumptions made in this paper. The first one is that the market is efficient. Since the real economy is interconnected with the capital market, policy uncertainty, and geopolitical risk have an impact on both carbon emissions and carbon neutrality. Besides, this impact is often first observed in the financial market. Therefore, the carbon neutrality volatility index in the financial market is taken in this paper as a proxy for the changes in carbon emissions. The second and last one is that the volatility of the stock market affects the short-term fluctuation of the carbon-neutral index. As capital markets tend to be interconnected with each other, it is highly likely that the volatility of the carbon neutral index is affected by the large amount of information spread in the market volatility covered by stock market fluctuations.
The remainder of this paper is structured as follows. In Section “Theoretical framework and literature review”, the theoretical framework is presented and a literature review is conducted. In Section “Methodology”, the research methods are introduced. In Sections “Empirical research” and “Robustness analysis”, empirical analysis and robustness tests are performed, respectively. Finally, the paper is concluded with conclusions and policy contributions.
For better understanding, the abbreviations used in this paper are listed in .
Table 1. Acronyms table.
Theoretical framework and literature review
Theoretical framework
The existing literature has provided ample evidence that economic policy uncertainty has an impact on both macroeconomic and financial variables [Citation35–40]. Apart from directly affecting an enterprise’s external business environment, economic policy uncertainty also exerts an indirect influence on its financial performance and investment decisions, which in turn affects its emission performance [Citation41]. Due to the increase in EPU, the attention of policymakers shifts from environmental quality to economic stability, thus increasing CO2 emissions. Additionally, EPU affects carbon emissions through investment and consumption effects. There are various ways in which CEPU affects carbon emissions and carbon performance, which influences carbon-neutral development in China [Citation42].
Implementing climate-related policies can not only reduce greenhouse gas emissions but also increase the utilization of renewable energy [Citation18]. The changes in climate policy make a difference to the energy mix as well [Citation20,Citation22], which drives the decarbonization of portfolios to reduce carbon emissions in the real economy. Moreover, climate policies promote the diffusion of low-carbon technologies and effectively reduce carbon emissions by improving energy efficiency and increasing the utilization of renewable energy [Citation18,Citation19]. The increase in climate policy uncertainty (CPU) tends to have a significant impact on the volatility of the carbon neutrality concept index [Citation9].
Geopolitical risk (GPR) is manifested mainly as political unrest, terrorist attack, and geopolitical tension. GPR tends to influence economic expectations and investment decision-making. In order to hedge against this risk, investments often flow to lower-yielding but relatively safe sectors. This ultimately influences the financial market by affecting business economic cycles [Citation30–32]. In particular, extreme GPR directly exacerbates the fear among investors and triggers an exceptionally high level of market volatility [Citation33]. Consequently, the volatility of carbon-neutral indices increases.
Literature review
Relevant literature on economic policy uncertainty
Given a volatile international situation and the increased uncertainty of economic policy, the uncertainty of economic policies can impede the development of the national economy if economic policies are not implemented as effectively as expected. This in turn affects the development and policy planning of various real economic sectors directly, such as manufacturing, transportation, and energy, which is adverse to achieving the zero carbon goal for China. Some scholars have identified economic policy uncertainty as one of the influences on carbon emissions [Citation42,Citation43]. Also, a causality test has been performed by some scholars to examine the correlation between economic policy uncertainty and carbon emissions [Citation15,Citation17]. However, there is another argument that economic policy uncertainty leads to a short-term reduction in CO2 emissions, despite no correlation from a long-term perspective [Citation16]. In addition to the above studies, more and more scholars have begun to investigate the relationship between EPU and financial markets, especially the stock market [Citation44–46]. As an emerging carbon market, China remains not comparable to the EU, and there remains controversy surrounding the impact of China’s economic policy uncertainty on the carbon market [Citation42]. Therefore, it is worthwhile to further explore the impact of CEPU on carbon-neutral volatility.
Related literature on climate policy uncertainty
Prompted by the uncertainty of climate-related changes, the governments of all countries have implemented the corresponding climate policies, of which the most typical example is the climate policy uncertainty (CPU) index proposed by Gavirilidis [Citation21] to measure the changes in US climate policy that can affect the energy structure [Citation20,Citation22]. By implementing climate-related policies, green investment and innovation in clean energy R&D (i.e. research and development) can be encouraged to reduce carbon emissions [Citation18]. As revealed by Wakiyama et al. [Citation19], the implementation of climate-related policies can not only reduce greenhouse gas emissions but also increase the utilization of renewable energy. According to Janicke [Citation18], the diffusion of low-carbon technology can be accelerated by an ambitious climate policy, which leads to clean investment and creates opportunities for sustainable development. Dunz et al. [Citation47] advocated the introduction of coordinated climate policy into green project investments, which is conducive to maintaining financial stability and improving the viability of climate goals. It is suggested in more literature that climate risk exerts a considerable influence on both investment and the financial market. Likewise, climate risk influences investment decisions as well [Citation48–50]. In the view of Bouri et al. [Citation51], climate risk can make a significant difference in investment returns and volatility. In the study of Zeng et al. [Citation9], it is indicated that the uncertainty in climate policy is closely related to the fluctuations in the carbon neutrality concept index. As revealed by Bartram et al. [Citation52], the changes in climate policies contribute mainly to the fluctuations in the price set by energy companies.
Relevant literature on geopolitical risk
As the global geopolitical risks and trade disputes have intensified recently, there is widespread attention turned to the correlation between geopolitics, energy, and carbon emissions. The main forms taken by geopolitical risk (GPR) include political turmoil, terrorist attack, and geopolitical tension. At present, there have been many scholars exploring the impact of GPR on energy and carbon emissions. Tiwari et al. [Citation53] studied the impact of GPR on artificial intelligence and carbon emissions. Anser et al. [Citation27] explored the impact of GPR on the ecological footprint in Brazil, Mexico, Colombia, and Russia. Zhao et al. [Citation26] discovered the asymmetric impact of GPR on carbon emissions in BRICS countries. Through augmented average group estimation, Husnain et al. [Citation29] investigated the impact of GPR on carbon emissions in E7 countries. In recent years, some scholars have also explored the impact of geopolitical risk on stock market dynamics. Some scholars have argued that GPR has an asymmetric effect on the stock market [Citation54,Citation55]. Differently, some other scholars indicate that GPR has a significant effect on green investment and green stock volatility [Citation56,Citation57].
Despite the above studies conducted to examine the impact of economic policy uncertainty, climate policy uncertainty, and geopolitical risk on carbon emissions and stock markets from different perspectives, there is little literature paying attention to the combined impact of all three factors on carbon-neutral index volatility. When investigating the impact of policy uncertainty on the volatility of the carbon neutral index, Zeng [Citation9] overlooked the fact that the volatility of the stock market. So has an impact on the short-term volatility of the carbon neutral index, which affects the accuracy of predicting the volatility of the carbon neutral index. In this paper, the shortcomings of the existing studies are addressed to construct a GARCH-RKV-MIDAS model [Citation58,Citation59], which takes into account economic policy uncertainty, climate policy uncertainty, and geopolitical risks. Meanwhile, the impact of stock market volatility on the short-term volatility of the carbon neutral index is further considered to improve predictive performance for the volatility of the carbon neutral index. This model also gives consideration to the effects of CEPU, CPU, and GPR on the long-term fluctuations of the carbon-neutral index, as well as the impact of stock market volatility on the short-term volatility of the index. This is effective in improving predictive performance for the volatility of the carbon-neutral index.
Methodology
GARCH-MIDAS model
Engle et al. [Citation58] suggested that unexpected returns may be obtained according to future cash flows or expected returns:
(1)
(1)
where
refers to the return of the stock, and
represents the expected value under the information set
The volatility of the return
can be decomposed into short-term fluctuations
and long-term fluctuations
Based on the assumption that
the total conditional variance of
can be expressed as follows:
(2)
(2)
Let EquationEquation (1)
(1)
(1) can be expressed as:
(3)
(3)
For the short-term volatility component of stock returns, it is assumed to follow the GARCH (1,1) process, which means:
(4)
(4)
where
and
The long-term fluctuation component is a function of the variable X, which is the MIDAS term of the GARCH-MIDAS model. It is expressed as follows:
(5)
(5)
where K is the lag order of the long-term fluctuation component, which depends on the model. X is the variable considered to affect the long-term fluctuations of the return, which is the uncertainty index of climate policy or the geopolitical risk index in this paper.
In EquationEquation (5)(5)
(5) ,
is obtained from the β weighting function proposed by Ghysels et al. [Citation60], the expression of which is as follows:
(6)
(6)
In order to ensure that the weights of the lagged variables decay in form, is usually set to 1, and
determines the decay rate of the influence of low-frequency data on high-frequency data. Therefore, EquationEquation (6)
(6)
(6) is presented as follows:
(7)
(7)
GARCH-RKV-MIDAS model
As an extension of the GARCH-MIDAS model, the GARCH-RKV-MIDAS model introduces additional variables into the short-term fluctuations of the GARCH-MIDAS. Also, the frequency of the introduced variables is consistent with that of the return Allowing for the effect caused by market fluctuations on the short-term fluctuations of a single asset, the realized kernel volatility (RKV) of the stock market is introduced into the short-term fluctuation component (4) of the GARCH-MIDAS model for further investigating the short-term impact of market volatility on the fluctuations of a carbon-neutral index. As proposed by Barndorff-Nielsen et al. [Citation61], RKV is calculated using 5-min intraday high-frequency data. The high-frequency data is selected because it contains more comprehensive statistical information and makes it possible to better describe the fluctuations of assets. Distinct from the traditional estimation of realized volatility, RKV can be used to eliminate the impact of noise.
At this point, the short-term volatility component of the GARCH-RKV-MIDAS model is expressed as:
(8)
(8)
where the frequency of the realized volatility
is aligned with the frequency of
When
= 0, the GARCH-RKV-MIDAS model is converted into the GARCH-MIDAS model. In brief, the difference between the GARCH-RKV-MIDAS model and the GARCH-MIDAS model is used to express the short-term volatility component. Besides, the GARCH-MIDAS model is converted into the GARCH-RKV-MIDAS model when the short-term volatility component (4) is replaced with EquationEquation (8)
(8)
(8) .
In this study, the realized volatility RKV is introduced as the volatility factor in EquationEquation (8)(8)
(8) , which represents the realized volatility of the Shanghai 180 Index which indicates the volatility of the stock market. Compared with the GARCH-MIDAS model, the impact of stock market volatility on the short-term volatility of the carbon neutrality concept index is explored in more depth.
In line with the previous study, the GARCH-RKV-MIDAS model is composed of EquationEquations (2)(2)
(2) , Equation(5)
(5)
(5) , and Equation(8)
(8)
(8) . The parameter set is denoted as Θ = {α, β, z, m,
}. Once the distribution of EquationEquation (1)
(1)
(1) is determined, the parameters in the parameter set Θ can be estimated through the maximum likelihood estimation method. When
is assumed to conform to the standard normal distribution, the log-likelihood function can be expressed as follows:
(9)
(9)
The maximum likelihood estimates of the model parameters can be obtained by maximizing the following log-likelihood function:
(10)
(10)
Empirical research
Descriptive statistics analysis
The carbon neutrality concept index (CNCI) used in this paper is an equal-weighted index constructed according to the relevant sector stocks in the Shanghai and Shenzhen Stock Exchanges, derived from the Wind Database. The base point of this index is 1000 and the base date is December 31st, 2017. Based on the daily return data of the carbon neutrality concept index, it involves stocks related to new energy, energy conservation, environmental protection, and power. Proposed by Baker et al. [Citation62], the China economic policy uncertainty (CEPU) index is constructed according to the South China Morning Post. The index is chosen to analyze the impact of economic policy uncertainty on the volatility of the carbon neutrality concept index because of its wide coverage, good continuity and time-varying nature, and more accurate and authoritative measurement of relevant indicators. This study uses the climate policy uncertainty (CPU) index described by Gavriilidis [Citation21] to measure the degree of uncertainty about climate policy changes in the United States climate policy. Since the United States is the world’s largest economy, the CPU index is frequently used to indicate the level of global climate risk. For this reason, this index is used in this study to explore the impact of climate policy uncertainty on the volatility of the carbon neutrality concept index. As proposed by Caldara et al. [Citation63], the geopolitical risk (GPR) index mainly includes geopolitical risk, war, military, and terrorism information. For the first time, the GPR index uses keywords related to geopolitical risk to search for news reports and uses the number of news reports to establish a geopolitical risk index, which effectively measures geopolitical risk and its changes. The relevant data is collected from the website of Matteo Lacoviello. It is adopted to explore the impact of geopolitical risks on the volatility of the carbon neutrality concept index. The time span of the data used in this paper is from January 2018 to June 2022. lists the basic characteristics of the data.
Table 2. Descriptive statistics.
As shown in , the return rate of the carbon neutrality concept index (CNCI) shows left skew and high kurtosis. The climate policy uncertainty (CPU) index, China economic policy uncertainty (CEPU) index, and geopolitical risk (GPR) index are all right-skewed with high kurtosis, suggesting the peak-tailed characteristics of these sequences. Furthermore, the p-values of the JB test fall below 1% for all the sequences, rejecting the hypothesis that the sequences follow a normal distribution.
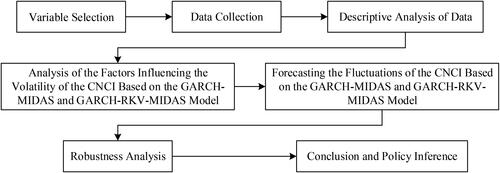
As can be seen clearly from , the carbon neutrality concept index (CNCI) has undergone significant fluctuations after the outbreak of the COVID-19 pandemic. The climate policy uncertainty (CPU) index has basically been on the rise in recent years, indicating an increase in the attention paid to it and the frequent change to economic policies. Because of the Russo-Ukraine War, the geopolitical risk (GPR) index surged abruptly in 2022. The flow of the analysis is presented in .
Figure 1. Time series of data.
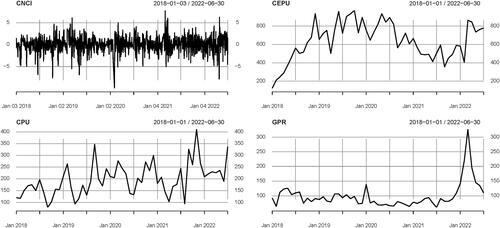
Figure 2. Flow of the study.
The impacts of policy uncertainty and geopolitical risks on the fluctuations of the carbon neutrality concept index
The impacts of policy uncertainty and geopolitical risks on the fluctuations of the carbon neutrality concept index were explored by using the GARCH-MIDAS and GARCH-RKV-MIDAS models constructed in this paper. The results are detailed in the following table.
The findings from are as follows. Firstly, GARCH parameters α and β are significant at the 1% or 5% significance levels, indicating that the constraint of wide stationarity is satisfied in the GARCH equation and that the model is constructed in a reasonable way. Secondly, the parameter θ corresponding to CPU is of significance, whose value is negative, indicating that the uncertainty of climate policy makes a significant difference to the long-term volatility of carbon neutrality. The parameter θ corresponding to GPR is also significant, and its value is positive, suggesting that the increase in geopolitical risk causes a rise in the volatility of the carbon neutrality concept index. Lastly, the parameter θ corresponding to CEPU is insignificant, which may result from the fact that the disrupted channel of influence of economic policy uncertainty in China to carbon market volatility. As an emerging market, the Chinese carbon market has financial attributes. However, its development is not comparable to the EU carbon market. Due to risk spillover and the insufficient linkage between the Chinese financial market and the carbon market, the influence of economic policy uncertainty in China on carbon market volatility is limited.
Table 3. Estimation results based on the GARCH-MIDAS model.
lists the estimation results based on the GARCH-RKV-MIDAS model, where RKV is calculated by using the 5-min high-frequency data of the SSE 180 index. The SSE 180 Index is chosen because it contains a number of large, liquid, and sector-representative stocks that are a good representation of the Chinese stock market. The findings from this table are as follows. Firstly, α and β remain significant at the 1% or 5% significance level, indicating the reasonability of model construction. Secondly, the parameter of stock market fluctuation is estimated to be significant, suggesting the significant impact of stock market fluctuations on the short-term changes of the carbon neutrality concept index. Lastly, the parameter θ of CPU and GPR are both significant at the 5% significant level, which confirms their significant effects on the long-term fluctuation of the carbon neutrality concept index.
Table 4. Estimation results based on GARCH-RKV-MIDAS model.
From the results of this paper, it can be seen that policy uncertainty and GPR are closely related to the carbon neutrality index, and they have an important impact on achieving the carbon neutrality target. Considering that carbon neutrality is conducive to promoting ecologically sustainable development, it can be inferred that policy uncertainty and GPR also have an important impact on sustainable development.
Forecasting of the fluctuations of the carbon neutrality concept index
From the previous research, it is known that CPU and GPR have a significant impact on the fluctuations of the carbon neutrality concept index (CNCI). So, would the introduction of these variables facilitate CNCI prediction? Is the forecasting performance of the GARCH-RKV-MIDAS model constructed in this paper better? To solve these questions, it is necessary to conduct further research.
In addition to various external factors, the volatility of stocks is also affected by many internal factors such as historical volatility. Therefore, when the volatility of the Carbon Neutral Index is predicted using the GARCH-MIDAS or GARCH-RKV-MIDAS model, it is also necessary to consider the long-term effects of previously realized volatility, which is represented by the long-term volatility component as shown in EquationEquation (5)(5)
(5) :
(11)
(11)
(12)
(12)
where
denotes the monthly realized volatility of the Carbon Neutral Index. It is calculated as the sum of squares of daily returns over the past month, and
= 22. In this context, variable X remains the uncertainty index of climate policy or the geopolitical risk index.
Then, the long-term volatility component of GARCH-MIDAS-CPU or GARCH-RKV-MIDAS-CPU model is expressed as:
(13)
(13)
Similarly, the long-term volatility component of GARCH-MIDAS-CEPU, GARCH-RKV-MIDAS-CEPU, GARCH-MIDAS-GPR or GARCH-RKV-MIDAS-GPR model can be obtained.
The entire sample period can be divided into two parts, with the estimation period lasting from Jan. 2018 to Jun. 2021 and the forecasting period lasting from Jul. 2021 to Jun. 2022. In the present study, the Model Confidence Set (MCS) proposed by Hansen et al. [Citation64] is used to evaluate the forecasting performance. According to [Citation64] and the study of Liang et al. [Citation65], five commonly used loss functions are applied to measure the forecasting errors as follows:
(14)
(14)
(15)
(15)
(16)
(16)
(17)
(17)
(18)
(18)
where
represents the actual volatility of the carbon neutral index and
refers to the predicted volatility. In this paper, the rolling forecasting method is used to forecast
with P as the length of the forecast sample. Apparently, the smaller the value of the loss function, the closer the predicted volatility is to the true value, and the better the outcome of the forecast.
In essence, the MCS test is a sequential process, in which some models with poor forecasting performance are continuously removed from the candidate models. At each step of the test, it is assumed that the forecasting performance of any two models is the same. Thus, the null hypothesis is:
(19)
(19)
In the first step of the MCS test, with a significance level of α assumed. If the null hypothesis shown in EquationEquation (17)
(17)
(17) is rejected, then the poor-performing models are eliminated. Besides, this process continues until no more null hypotheses are rejected, with the set of surviving models obtained and represented by
The models included in this set are treated as the optimal forecasting models at the 1-α confidence level. The condition of a model belonging to
is that its corresponding MCS test p-value exceeds the significance level. That is to say, the higher the p-value of the model, the better its forecasting performance.
In order to address the defect of the MCS test, Range Statistics and Semi-quadratic Statistics are adapted to perform the test according to the research of Hansen et al. [Citation66] as follows:
(20)
(20)
(21)
(21)
(22)
(22)
where
denotes the average relative loss function of the model n and
The null hypothesis is rejected if the values of the statistics
and
exceed the critical value. lists the p-values of the MCS test based on EquationEquations (14)–(18). Herein, the reference p-value is set to .20. According to the principle of the MCS test, the prediction ability of the model is considered poor if the corresponding p-value of the model is less than .20, and this model is eliminated from the MCS test. The larger the corresponding p-value, the better the prediction ability of the model.
Table 5. The p-value of the MCS test for different prediction models.
According to , the p-value of the MCS test corresponding to the GARCH-RKV-MIDAS model is evidently larger than that of the GARCH-MIDAS model, regardless of whether the influencing factors of carbon neutrality concept index volatility are CPU, GPR, or CEPU. It is indicated that the prediction effect of the GARCH-RKV-MIDAS model is better, which makes it necessary to introduce the stock market volatility (RKV) into the short-term volatility component of the GARCH-MIDAS model. This is conducive to improving the prediction efficiency of the model significantly. Also, the p-value of the MCS test corresponding to the GARCH-RKV-MIDAS model considering the influence of climate policy uncertainty (CPU) is the largest under most loss functions, and its prediction performance is the best. It is demonstrated that the effect of CPU on the prediction of carbon neutrality concept index volatility is more significant compared with GPR and CEPU and that the efficiency of volatility prediction can be enhanced by considering the impact of this index.
Robustness analysis
Due to the outbreak of the novel coronavirus, all industries have been significantly affected. In order to verify the robustness of the conclusions reached in the previous section, the impacts of policy uncertainty and geopolitical risks on the fluctuation of the carbon neutrality concept index during the novel coronavirus period (the sampling period is from January 2020 to June 2022) were further explored. The specific results are listed in below.
Table 6. Analysis of the impact factors of carbon neutrality concept index fluctuation based on the GARCH-RKV-MIDAS model during the novel coronavirus period.
As shown in , the parameter θ remains significant, indicating a significant and robust impact caused by the uncertainty of climate policy and geopolitical risk on the fluctuation of the carbon neutrality concept index during the novel coronavirus pandemic. Meanwhile, the estimate of the parameter for stock market fluctuation reaches a significant extent, which substantiates the significant impact of stock market fluctuation on the short-term fluctuation of the carbon neutrality concept index.
It is worthwhile to investigate whether the prediction of the carbon neutrality concept index based on the GARCH-RKV-MIDAS model remains better than those based on the GARCH-MIDAS model under different market conditions. Typically, the level of volatility varies as the market conditions change. If the predicted volatility of the carbon neutrality concept index is greater than the median volatility, then it is considered to be at a high level. Conversely, if it is smaller than the median volatility, then it is treated as being at a low level. Based on the study of Liang et al. [Citation67], the out-of-sample (
) is used to evaluate the performance of the model. The formula used to calculate
is expressed as:
(23)
(23)
where
represents the actual volatility,
indicates the predicted volatility and
denotes the volatility based on the benchmark model, which in this paper is the GARCH-MIDAS model that considers only the realized volatility (RV) effects. m and q refer to the length of the initial sample and the prediction sample, respectively (here the initial sample is from January 2018 to June 2021, and the prediction sample is from July 2021 to June 2022). When
is positive, it implies that the model is superior to the benchmark model. According to the study of Clark et al.. [Citation68], the adjusted MSPE statistic was adopted to measure the difference between different models. The specific results are shown in below.
Table 7. Comparison of predictive models under different market conditions.
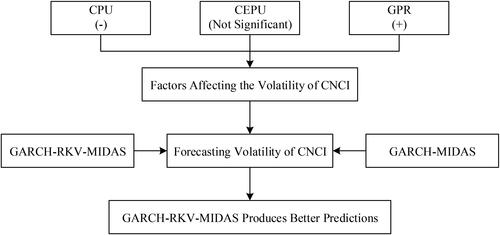
The findings from are as follows. On the one hand, the GARCH-MIDAS model considering the uncertainty index of climate policies (CPU) outperforms the benchmark model which takes into account only GPR effects, regardless of the level of volatility. It is indicated that the introduction of CPU is more conducive to predicting the fluctuations of the carbon neutral index than GPR. On the other hand, considering the impact of GPR and CPU, the GARCH-RKV-MIDAS model outperforms the GARCH-MIDAS model, which confirms that the GARCH-RKV-MIDAS model proposed in this paper outperforms the GARCH-MIDAS model in the efficiency of prediction. In general, the conclusions reached in this part are consistent with those drawn in the previous part. Thus, the robustness of the study is verified. is a graphical presentation of our results.
Figure 3. Summary of findings from empirical research and robustness analysis.
Conclusions and policy contributions
Conclusions
In recent years, there are still few studies conducted to explore the impact of policy uncertainty or geopolitical risks on the volatility of the carbon neutral index, despite many scholars have investigated their impact on financial markets. To renew the existing research, this paper focuses mainly on two aspects. On the one hand, the GARCH-RKV-MIDAS model is constructed on the basis of the GARCH-MIDAS model by introducing the realized kernel volatility (RKV) of the Chinese stock market into the short-term volatility component of the model. On the other hand, the GARCH-RKV-MIDAS and GARCH-MIDAS models are applied to explore the impact of climate policy uncertainty, economic policy uncertainty, and geopolitical risks on the volatility of the carbon neutral index. Meanwhile, multiple comparison standards are adopted to evaluate the predictive performance of different models. The conclusions drawn from this study are as follows. Firstly, climate policy uncertainty and geopolitical risks have a significant impact on the long-term volatility of the carbon neutrality concept index in China. Also, climate policy uncertainty exerts a negative effect on the long-term volatility of carbon neutrality, while geopolitical risks exert a positive effect on the volatility of the carbon neutrality concept index. This is attributed to the negative effect of an increase in geopolitical risks on the carbon neutrality concept index, which exacerbates the volatility of the carbon neutrality concept index. Notably, the long-term volatility of the carbon neutrality concept index is not significantly affected by the uncertainty of China’s economic policy. This may result from the disruption caused to the channels by the impact of economic policy uncertainty on carbon market volatility. As an emerging market, the Chinese carbon market shows financial attributes. However, its development lags behind the EU carbon market. Due to risk spillover and the insignificant linkage between the Chinese financial market and the carbon market, economic policy uncertainty has only an insignificant impact on the volatility of carbon markets. Secondly, as for the influencing factors in the volatility of the carbon neutrality concept index, whether it is CPU, GPR, or CEPU, the p-value of the MCS test by the GARCH-RKV-MIDAS model is obviously larger compared to the GARCH-MIDAS model. That is to say, the GARCH-RKV-MIDAS model produces a better predictive performance, which indicates the necessity to introduce stock market volatility (RKV) into the short-term volatility components of the GARCH-MIDAS model. This is beneficial in significantly improving the efficiency of prediction for the model. Finally, climate policy uncertainty has a more significant impact on the volatility of the carbon neutrality concept index than economic policy uncertainty and geopolitical risks. This may be attributed to climate policy uncertainty that affects the confidence of investors in the carbon neutrality concept index, which is a crucial factor affecting the volatility of the carbon neutrality concept index. Therefore, the efficiency of volatility prediction can be improved by considering the impact of this index.
Policy contributions
Similar to the studies of Kartal et al. [Citation69] and Adebayo et al. [Citation70], the improved GARCH-RKV-MIDAS model as proposed in this paper is demonstrated as an effective econometric tool. Despite the difficulty in making an accurate inference of causal effects through the model, the empirical evidence obtained by applying the GARCH-RKV-MIDAS model can still help to make targeted policy contributions. To mitigate the negative impact of economic policy uncertainty, climate policy uncertainty, and geopolitical risks on the short-term volatility of the carbon neutral index, the following policy contributions are put forward in this paper. Firstly, economic policy uncertainty should be reduced. The government needs to communicate with the public more promptly when formulating, publishing, and adjusting economic policies. Also, it is necessary to enhance the transparency of policies, strengthen the consistency and continuity of policies, and avoid making drastic changes to the existing economic policies, thus preventing any overreaction from the market. Secondly, it is necessary to implement the climate policy. Climate policies should be formulated and implemented in a smooth and orderly way so that markets can adjust asset prices promptly, correctly, and smoothly. Thus, the prices of financial assets and liabilities do not become excessively volatile after a climate policy shock, which is effective in preventing various capital market risks. Thirdly, it is worth paying attention to geopolitical risks. While embracing globalization, an individual country must prepare well for encountering potential geopolitical risks. Policies should be formulated and implemented not only in the interest of the country as a whole but also in consideration of the impact of policy changes on other countries. Additionally, attention should also be paid to the formulation and implementation of policies in other countries. Fourthly, the carbon market must be strengthened. With the launch and promotion of the national carbon market, China becomes more and more connected with the outside world, which however makes the carbon market more vulnerable to economic policy uncertainties. Therefore, carbon market managers need to improve the mechanism of market operation and implementation plan for steadily promoting China’s carbon market and reducing carbon market emissions.
Limitations and future study
The limitations of this paper are reflected mainly in two aspects, for which future improvement can be made in two ways. Firstly, in terms of model construction, the GARCH-RKV-MIDAS model constructed in this paper is applicable only to the univariate case. Thus, the reliability of this study can be enhanced by extending this model to the multivariate case and exploring the impact of CPU, CEPU, or GPR with the introduction of other economic variables. Meanwhile, the predictive performance of the model can be improved. Secondly, in terms of the influencing factors, the empirical evidence obtained in this paper is limited to the domestic financial market, which ignores the cross-country spillover effects. The economic policy uncertainty in other countries may also have an impact on the Chinese financial market and exacerbate the volatility of the carbon neutral index in China. In the future, the factors affecting the volatility of the carbon neutral index will be further explored to construct a multivariate GARCH-RKV-MIDAS model for the improved efficiency of predicting the volatility of the carbon neutral index.
Disclosure statement
No potential conflict of interest was reported by the authors. The opinions expressed in this article are the authors’ own and do not necessarily reflect the view of the authors’ institutions.
Data availability statement
The carbon neutrality concept index (CNCI) used in this article can be obtained from the Wind database. The China economic policy uncertainty (CEPU) index (Baker et al. [Citation62]) and the climate policy uncertainty (CPU) index (Gavriilidis [Citation21]) can be obtained from the website: http://www.policyuncertainty.com/china_epu.html. The geopolitical risk (GPR) index can be obtained from the website: https://www.matteoiacoviello.com/gpr.htm.
Additional information
Funding
References
- Duan H, Zhou S, Jiang K, et al. Assessing china’s efforts to pursue the 1.5 C warming limit. Science. 2021;372(6540):378–385. doi: 10.1126/science.aba8767.
- Battiston S, Dafermos Y, Monasterolo I. Climate risks and financial stability. J Financ Stab. 2021;54:100867. doi: 10.1016/j.jfs.2021.100867.
- Stroebel J, Wurgler J. What do you think about climate finance?. J Financ Econ. 2021;142(2):487–498. doi: 10.1016/j.jfineco.2021.08.004.
- Rolnick D, Donti PL, Kaack LH, et al. Tackling climate change with machine learning. ACM Comput Surv. 2023;55(2):1–96. doi: 10.1145/3485128.
- Aragón FM, Oteiza F, Rud JP. Climate change and agriculture: subsistence farmers’ response to extreme heat. Am Econ J. 2021;13(1):1–35.
- Ortiz-Bobea A, Ault TR, Carrillo CM, et al. Anthropogenic climate change has slowed global agricultural productivity growth. Nat Clim Chang. 2021;11(4):306–312. doi: 10.1038/s41558-021-01000-1.
- Xu L, Fan M, Yang L, et al. Heterogeneous green innovations and carbon emission performance: evidence at china’s city level. Energy Econ. 2021;99:105269. doi: 10.1016/j.eneco.2021.105269.
- Kahn ME, Mohaddes K, Ng RNC, et al. Long-term macroeconomic effects of climate change: a cross-country analysis. Energy Econ. 2021;104:105624. doi: 10.1016/j.eneco.2021.105624.
- Zeng Q, Ma F, Lu X, et al. Policy uncertainty and carbon neutrality: evidence from China. Finance Res Lett. 2022;47:102771. doi: 10.1016/j.frl.2022.102771.
- Wu L, Adebayo TS, Yue XG, et al. The role of renewable energy consumption and financial development in environmental sustainability: implications for the Nordic countries. Int J Sustain Dev World Ecol. 2023;30(1):21–36. doi: 10.1080/13504509.2022.2115577.
- Irfan M, Ullah S, Razzaq A, et al. Unleashing the dynamic impact of tourism industry on energy consumption, economic output, and environmental quality in China: a way forward towards environmental sustainability. J Cleaner Prod. 2023;387:135778. doi: 10.1016/j.jclepro.2022.135778.
- Adebayo TS. Towards unlocking the chain of sustainable development in the BRICS economies: analysing the role of economic complexity and financial risk. Geol J. 2023;58(5):1810–1821. doi: 10.1002/gj.4694.
- Adebayo TS. Trade‐off between environmental sustainability and economic growth through coal consumption and natural resources exploitation in China: new policy insights from wavelet local multiple correlation. Geol J. 2023;58(4):1384–1400. doi: 10.1002/gj.4664.
- Zang X, Adebayo TS, Oladipupo SD, et al. Asymmetric impact of renewable energy consumption and technological innovation on environmental degradation: designing an SDG framework for developed economy. Environ Technol. 2023;44(6):774–791. doi: 10.1080/09593330.2021.1983027.
- Pirgaip B, Dinçergök B. Economic policy uncertainty, energy consumption and carbon emissions in G7 countries: evidence from a panel granger causality analysis. Environ Sci Pollut Res Int. 2020;27(24):30050–30066. doi: 10.1007/s11356-020-08642-2.
- Adedoyin FF, Zakari A. Energy consumption, economic expansion, and CO2 emission in the UK: the role of economic policy uncertainty. Sci Total Environ. 2020;738:140014. doi: 10.1016/j.scitotenv.2020.140014.
- Adams S, Adedoyin F, Olaniran E, et al. Energy consumption, economic policy uncertainty and carbon emissions; causality evidence from resource rich economies. Econ Anal Policy. 2020;68:179–190. doi: 10.1016/j.eap.2020.09.012.
- Jänicke M. Dynamic governance of clean-energy markets: how technical innovation could accelerate climate policies. J Clean Prod. 2012;22(1):50–59. doi: 10.1016/j.jclepro.2011.09.006.
- Wakiyama T, Zusman E. The impact of electricity market reform and subnational climate policy on carbon dioxide emissions across the United States: a path analysis. Renew Sustain Energy Rev. 2021;149:111337. doi: 10.1016/j.rser.2021.111337.
- Kettner C, Kletzan‐Slamanig D. Is there climate policy integration in European union energy efficiency and renewable energy policies? Yes, no, maybe. Env Pol Gov. 2020;30(3):141–150. doi: 10.1002/eet.1880.
- Gavriilidis K. Measuring climate policy uncertainty. Available at SSRN 3847388. 2021.
- Mercure JF, Salas P, Vercoulen P, et al. Reframing incentives for climate policy action. Nat Energy. 2021;6(12):1133–1143. doi: 10.1038/s41560-021-00934-2.
- Su CW, Khan K, Tao R, et al. Does geopolitical risk strengthen or depress oil prices and financial liquidity? Evidence from Saudi Arabia. Energy. 2019;187:116003. doi: 10.1016/j.energy.2019.116003.
- Rasoulinezhad E, Taghizadeh-Hesary F, Sung J, et al. Geopolitical risk and energy transition in Russia: evidence from ARDL bounds testing method. Sustainability. 2020;12(7):2689. doi: 10.3390/su12072689.
- Saint Akadiri S, Eluwole KK, Akadiri AC, et al. Does causality between geopolitical risk, tourism and economic growth matter? Evidence from Turkey. J Hosp Tour Manag. 2020;43:273–277. doi: 10.1016/j.jhtm.2019.09.002.
- Zhao W, Zhong R, Sohail S, et al. Geopolitical risks, energy consumption, and CO2 emissions in BRICS: an asymmetric analysis. Environ Sci Pollut Res Int. 2021;28(29):39668–39679. doi: 10.1007/s11356-021-13505-5.
- Anser MK, Syed QR, Apergis N. Does geopolitical risk escalate CO2 emissions? Evidence from the BRICS countries. Environ Sci Pollut Res Int. 2021a;28(35):48011–48021. doi: 10.1007/s11356-021-14032-z.
- Anser MK, Syed QR, Lean HH, et al. Do economic policy uncertainty and geopolitical risk lead to environmental degradation? Evidence from emerging economies. Sustainability. 2021b;13(11):5866. doi: 10.3390/su13115866.
- Husnain MI, Syed QR, Bashir A, et al. Do geopolitical risk and energy consumption contribute to environmental degradation? Evidence from E7 countries. Environ Sci Pollut Res Int. 2022;29(27):41640–41652. doi: 10.1007/s11356-021-17606-z.
- Balcilar M, Bonato M, Demirer R, et al. Geopolitical risks and stock market dynamics of the BRICS. Econ Sys. 2018;42(2):295–306. doi: 10.1016/j.ecosys.2017.05.008.
- Olanipekun IO, Alola AA. Crude oil production in the Persian Gulf amidst geopolitical risk, cost of damage and resources rents: is there asymmetric inference? . Resour Policy. 2020;69:101873. doi: 10.1016/j.resourpol.2020.101873.
- Dogan E, Majeed MT, Luni T. Analyzing the impacts of geopolitical risk and economic uncertainty on natural resources rents. Resour Policy. 2021;72:102056. doi: 10.1016/j.resourpol.2021.102056.
- Qin Y, Hong K, Chen J, et al. Asymmetric effects of geopolitical risks on energy returns and volatility under different market conditions. Energy Econ. 2020;90:104851. doi: 10.1016/j.eneco.2020.104851.
- Amendola A, Candila V, Gallo GM. On the asymmetric impact of macro–variables on volatility. Econ Model. 2019;76:135–152. doi: 10.1016/j.econmod.2018.07.025.
- Elder J, Serletis A. Oil price uncertainty. J Money Credit Bank. 2010;42(6):1137–1159. doi: 10.1111/j.1538-4616.2010.00323.x.
- Cheng D, Shi X, Yu J, et al. How does the chinese economy react to uncertainty in international crude oil prices?. Int Rev Econ Finance. 2019;64:147–164. doi: 10.1016/j.iref.2019.05.008.
- Kang W, Ratti RA. Oil shocks, policy uncertainty and stock market return. J Int Financ Mark Inst Money. 2013;26:305–318. doi: 10.1016/j.intfin.2013.07.001.
- Van Robays I. Macroeconomic uncertainty and oil price volatility. Oxf Bull Econ Stat. 2016;78(5):671–693. doi: 10.1111/obes.12124.
- Gu X, Zhu Z, Yu M. The macro effects of GPR and EPU indexes over the global oil market—are the two types of uncertainty shock alike? . Energy Econ. 2021;100:105394. doi: 10.1016/j.eneco.2021.105394.
- Zakari A, Adedoyin FF, Bekun FV. The effect of energy consumption on the environment in the OECD countries: economic policy uncertainty perspectives. Environ Sci Pollut Res Int. 2021;28(37):52295–52305. doi: 10.1007/s11356-021-14463-8.
- People’s Political Consultative Conference. Carbon neutral index for Chinese cities released [EB/OL]. 2022 [cited 2023 June 18]. https://obor.nea.gov.cn/detail2/16828.html.
- Qun L, Jiwei L, Tao L. The impact of economic policy uncertainty on carbon neutral development. China Circul Econ. 2022;36(6):11.
- Dietz T, Rosa EA. Rethinking the environmental impacts of population, affluence and technology. Hum Ecol Rev. 1994;1(2):277–300.
- Fasanya IO, Oliyide JA, Adekoya OB, et al. How does economic policy uncertainty connect with the dynamic spillovers between precious metals and bitcoin markets?. Resour Policy. 2021;72:102077. doi: 10.1016/j.resourpol.2021.102077.
- Asl MG, Adekoya OB, Oliyide JA. Carbon market and the conventional and Islamic equity markets: where lays the environmental cleanliness of their utilities, energy, and ESG sectoral stocks?. J Cleaner Prod. 2022;351:131523. doi: 10.1016/j.jclepro.2022.131523.
- Badshah I, Demirer R, Suleman MT. The effect of economic policy uncertainty on stock-commodity correlations and its implications on optimal hedging. Energy Econ. 2019;84:104553. doi: 10.1016/j.eneco.2019.104553.
- Dunz N, Naqvi A, Monasterolo I. Climate sentiments, transition risk, and financial stability in a stock-flow consistent model. J Financ Stab. 2021;54:100872. doi: 10.1016/j.jfs.2021.100872.
- Engle RF, Giglio S, Kelly B, et al. Hedging climate change news. Rev Financ Stud. 2020;33(3):1184–1216. doi: 10.1093/rfs/hhz072.
- Faccini R, Matin R, Skiadopoulos G. Are climate change risks priced in the US stock market? Copenhagen: Danmarks Nationalbank; 2021. (Working Papers nr. 169).
- Choi D, Gao Z, Jiang W. Attention to global warming. Rev Financ Stud. 2020;33(3):1112–1145. doi: 10.1093/rfs/hhz086.
- Bouri E, Iqbal N, Klein T. Climate policy uncertainty and the price dynamics of green and brown energy stocks. Finance Res Lett. 2022;47:102740. doi: 10.1016/j.frl.2022.102740.
- Bartram SM, Hou K, Kim S. Real effects of climate policy: financial constraints and spillovers. J Financ Econ. 2022;143(2):668–696. doi: 10.1016/j.jfineco.2021.06.015.
- Tiwari AK, Abakah EJA, Le TNL, et al. Markov-switching dependence between artificial intelligence and carbon price: the role of policy uncertainty in the era of the 4th industrial revolution and the effect of COVID-19 pandemic. Technol Forecast Soc Change. 2021;163:120434. doi: 10.1016/j.techfore.2020.120434.
- Kannadhasan M, Das D. Do Asian emerging stock markets react to international economic policy uncertainty and geopolitical risk alike? A quantile regression approach. Finance Research Letters. 2020;34:101276. doi: 10.1016/j.frl.2019.08.024.
- Hoque ME, Zaidi MAS. Global and country-specific geopolitical risk uncertainty and stock return of fragile emerging economies (Borsa Istanbul review). Borsa Istanb Rev. 2020;20(3):197–213. doi: 10.1016/j.bir.2020.05.001.
- Sohag K, Hammoudeh S, Elsayed AH, et al. Do geopolitical events transmit opportunity or threat to green markets? Decomposed measures of geopolitical risks. Energy Econ. 2022;111:106068. doi: 10.1016/j.eneco.2022.106068.
- Flouros F, Pistikou V, Plakandaras V. Geopolitical risk as a determinant of renewable energy investments. Energies. 2022;15(4):1498. doi: 10.3390/en15041498.
- Engle RF, Ghysels E, Sohn B. Stock market volatility and macroeconomic fundamentals. Revf Econ Stat. 2013;95(3):776–797. doi: 10.1162/REST_a_00300.
- Adebayo TS, Kartal MT, Ullah S. Role of hydroelectricity and natural gas consumption on environmental sustainability in the United States: evidence from novel time-frequency approaches. J Environ Manage. 2023;328:116987. doi: 10.1016/j.jenvman.2022.116987.
- Ghysels E, Sinko A, Valkanov R. MIDAS regressions: further results and new directions. Econom Rev. 2007;26(1):53–90. doi: 10.1080/07474930600972467.
- Barndorff‐Nielsen OE, Hansen PR, Lunde A, et al. Designing realized kernels to measure the ex- post variation of equity prices in the presence of noise. Econometrica. 2008;76(6):1481–1536.
- Baker SR, Bloom N, Davis SJ. Measuring economic policy uncertainty. Q J Econ. 2016;131(4):1593–1636. doi: 10.1093/qje/qjw024.
- Caldara D, Iacoviello M. Measuring geopolitical risk. FRB International Finance Discussion Paper 1222; 2018.
- Hansen PR, Lunde A, Nason JM. The model confidence set. Econometrica. 2011;79(2):453–497.
- Liang C, Li Y, Ma F, et al. Global equity market volatilities forecasting: a comparison of leverage effects, jumps, and overnight information. Int Rev Financ Anal. 2021;75:101750. doi: 10.1016/j.irfa.2021.101750.
- Hansen PR, Lunde A. Consistent ranking of volatility models. J Econom. 2006;131(1-2):97–121. doi: 10.1016/j.jeconom.2005.01.005.
- Liang C, Wei Y, Li X, et al. Uncertainty and crude oil market volatility: new evidence. Appl Econom. 2020;52(27):2945–2959. doi: 10.1080/00036846.2019.1696943.
- Clark TE, West KD. Approximately normal tests for equal predictive accuracy in nested models. J Econom. 2007;138(1):291–311. doi: 10.1016/j.jeconom.2006.05.023.
- Kartal MT, Samour A, Adebayo TS, et al. Do nuclear energy and renewable energy surge environmental quality in the United States? New insights from novel bootstrap fourier granger causality in quantiles approach. Prog Nucl Energy. 2023;155:104509. doi: 10.1016/j.pnucene.2022.104509.
- Adebayo TS, Ağa M, Kartal MT. Analyzing the co-movement between CO2 emissions and disaggregated nonrenewable and renewable energy consumption in BRICS: evidence through the lens of wavelet coherence. Environ Sci Pollut Res. 2023;30(13):38921–38938. doi: 10.1007/s11356-022-24707-w.