
 ?Mathematical formulae have been encoded as MathML and are displayed in this HTML version using MathJax in order to improve their display. Uncheck the box to turn MathJax off. This feature requires Javascript. Click on a formula to zoom.
Abstract
For sustainable energy management, soft computing can play an important role in developing a charging station planning for low carbon transition to address the challenges faced by electric vehicle (EV) infrastructure system. This article proposes a planning scheme for charging stations of electronic vehicles for low carbon transition using soft computing-based computational techniques in the transportation sector. The existing charging stations have many flaws which are acting as hindrance in the development and acceptance of electronic vehicles by consumers. These flaws include the unreasonable layout of charging terminals, difficulty in charging, consumption of time in charging, and consumer convenience. This paper proposes a novel planning model for charging electronic vehicles as an innovative solution for electronic vehicles for low carbon transition. The protection of the environment is important in this current era and switching to electronic vehicles is a mandate for low-carbon transitions in the transportation sector. The proposed method begins with the collection of data from diverse sites of charging stations using the existing charging infrastructure, and this data also analyzed for ascertaining the energy consumption patterns, availability of renewable energy options, flow of traffic, and consumer preferences. The proposed method aims to augment the deployment of convenient charging infrastructure to promote consumers to switch to electronic vehicles from fuel-based vehicles and to promote renewable energy solutions for electric vehicles (EVs) at economic costs. The location and capacity of charging terminals is also optimized with the aid of hybrid algorithm based on catfish and PSO algorithms in this proposed research work. The effectiveness of the proposed soft computing-based hybrid algorithm is tested by using standard statistical methods and respective results are presented in the result section of this article. The proposed research has practical implications in a real-world scenario where consumers can be promoted to use electric vehicles by optimizing the capacity and availability of the charging station infrastructure which can eventually reduce the carbon footprints from this world.
Introduction
The charging infrastructure is the need of the hour for promoting the sustainable development for electric vehicles in the current era. As the demand for electric vehicles is increasing to reduce the usage of fossil fuel and to increase the usage of renewable energy for reducing carbon footprints [Citation1], there is a need for sustainable infrastructure for electric vehicles (EV) [Citation2]. The charging stations and charging networks are of utmost importance in establishing the infrastructure for electric vehicles. In the current era, the focus on the layout of energy refilling infrastructure is growing rapidly with the research initiatives around the world for the configuration of charging facilities [Citation3]. The research initiatives are based on machine intelligence; nature inspired algorithms and various technologies such as AI, blockchain and advanced optical technologies. Many researchers have also made use of deterministic algorithms, non-deterministic algorithms such as greedy algorithms and evolutionary algorithms to optimize the placement of charging stations [Citation4]. Before applying any techniques for optimizing the charging terminals for delivering energy to the EV, many factors are to be considered such as user travel efficiency, charging load time periods, area-wise charging load, and optimal service capacity of the charging terminals. The researchers have attempted to design a solution for optimizing the usage of charging terminals for delivering energy to the electric vehicles to fulfill their charging/fuel needs to ensure a balanced layout of charging stations while maintaining the convenience for consumers [Citation5]. The traffic density, timing of traffic, maintenance of charging terminals and facilities for delivering energy are important aspects to be considered while designing the infrastructure for electric vehicles which should eventually reduce the carbon transitions and carbon footprints [Citation6].
Many researchers have also given emphasis to swarm intelligence based methods to optimize the local layout of charging stations to ensure power grid safety [Citation7]. Many existing works have ignored some important aspects such as overall capacity of charging terminals, overall demand for charge/energy during the different time intervals, maintenance of charging terminals, and variations in service stations due to area size and consumer size [Citation8]. This lack of consideration hampers the expansion of charging infrastructure facilities that are capable enough to cater to diverse vehicle charging requirements [Citation9]. Some studies are based on homomorphic encryption method with the integration of Blockchain technology, for Internet of Vehicles (IoV) for promoting the sustainable environment [Citation9]. The encryption methods ensure the security of the consumers and privacy of data transmission and storage in under numerous IoT scenarios. Many existing studies are exploring the behavior and preferences of the consumers for designing the infrastructure for smart cities with a focus on encouraging sustainability [Citation10]. To attain this goal, many researchers have used PCA method along with the machine learning approaches to provide an optimal solution for the development of a charging planning infrastructure [Citation11]. The researchers have also tried to determine the user preferences and brand values for purchasing the EV vehicles and then choosing the charging terminals for timely delivery of energy [Citation11]. The researchers have attempted to recognize the key parameters that influence the consumer decisions and inclinations toward the electric vehicles for minimizing carbon transitions.
The researchers demonstrate the efficiency of the proposed energy-saving approach in minimizing the hop delay in multi-hop optical channels [Citation12]. With the aid of AI and IoT techniques, the researchers have optimized the consumption of energy while maintaining the fast data transmission. The research findings of the article are offering energy-efficient communication systems by utilizing the resources optimally for low carbon transition. The proposed energy saving method not only improves the energy efficiency but also expands the reliability and performance of the system. The research idea can be replicated in many areas where saving of energy and reduction in carbon footprints is crucial such as industry 4.0, EV charging infrastructure and smart cities.
Many existing studies explore the implications of the charging facilities and charging infrastructure for promoting the growth of electric vehicles for low carbon transitions and for protection of the environment by minimizing the usage of fossil fuel [Citation13]. The researchers and academicians have analyzed the indicators and factors that provides insights into the adaption of advanced technologies for reducing the carbon transition and optimizing the usage of energy [Citation14]. Some authors focus on the development of photovoltaic (PV) based charging stations which are a part of self-sustained energy generation systems as a substitute of gas stations [Citation15]. Such research endeavors present an innovative approach for planning environment friendly PV-charging stations in a way that supports low carbon transition. By minimizing the dependency on traditional gas stations and by incorporating PV technology, a sustainable and environment friendly solution can be provided to strengthen the EV infrastructure [Citation16]. The existing approaches are listed below in a sub-section of related work.
Related work
In [Citation17], the authors have developed an innovative algorithm for extracting the information automatically for assessing the optimal location for charging the electric vehicle. The authors have presented a conceptual framework for promoting green environment in smart cities by developing the concept of optimal layouts of charging stations for the growth of electric vehicles. In [Citation18], the authors have emphasized on the planning of EV charging stations on the basis of cost-benefit study. The involvement of service providers and energy consumers is considered for mutual benefits and utilization of power grids is also considered as a charging facility. In [Citation19], the authors have used optical allocation of charging stations based on renewable energy concept and attempted to control carbon emissions. The authors have used intelligent methods for automatically provide the indication for the nearest and the best charging facility for electric vehicles to promote EV infrastructure for the convenience of consumers. The charging stations are powered by a microgrid with the hybrid operational mode. The research is focusing on creating an ecosystem that integrates charging stations with microgrids. In [Citation20], the authors are using multi-objective strategy to address the multiple challenges for charging infrastructure. The authors are using cluster-based approach and then also integrating electrically chargeable vehicles into EV charging infrastructure by handling multiple objectives. Their multi-objective approach is showing the potential benefits of using multiple functions for optimizing the charging facility for EV vehicles and for improving grid stability.
In [Citation21] the authors use the attractive flying capacitor multilevel (FCML) technology for the development of DC-DC stage of the charging station for EV. The FCML technology is accumulating the storage of energy which is scalable in nature as it can upgrade itself as per the requirement. Each EV charging point can have a single or multiple parallel cells to scale up the FCML technology. The FCML based architecture is tested on Gallium Nitride (GaN) switches for EV charging. Experimental results show that the FCML works well with GaN switches for charging the electric vehicles. In [Citation22], the authors are proposing a planning method for EV charging stations as an innovative method to support EV charging infrastructure on the basis of NP-complete optimization problem where there are many combinations are possible for charging stations but the EV vehicles have to select the optimal charging station. The authors are demonstrating through the results that the proposed method is efficient enough to handle small to large traffic of EV vehicles at charging stations in a realistic situations. The authors’ state that the entire world is switching from fossil fuel based vehicles to the electronic vehicles due to environmental issues [Citation23]. Therefore, proper infrastructure is required except home chargers to support EV vehicles by providing fast and timely charging. The energy generation methods are discussed in the manuscript proposed by many authors as of now. The challenges for establishing the charging infrastructure are also discussed. The existing methods of fast charging are explained in detail and future directions for developing better charging infrastructure to promote electric vehicles are also discussed. In [Citation24], the charging station (CS) mechanism is proposed on the basis of photovoltaic (PV) arrays. The proposed CS method is handling the load of EV vehicles along with handling the quality of the power generation to support the distribution grid under heavy electric vehicles (EVs) loads with improved power quality. The proposed method based charging stations are able to operate under the conditions of load unbalancing, and sudden change in operational mode in case of hybrid vehicles. In [Citation25], the article is presenting a comprehensively review on the recent EV charging infrastructure, methods, and challenges for the establishment of EV charging infrastructure. Several techniques associated with the EV vehicles to provide charging solutions are discussed, and the advantages and disadvantages of each method are also highlighted to provide a glimpse on the positive and negative aspects of the existing technologies in the area of EV charging solutions. This article is also discussing the perspective of consumers for selection of charging stations. Finally, the suggestions are also made by the experts for making the EV charging infrastructure more users friendly and affordable.
Identifying gaps in existing studies is crucial for addressing the existing problems through the research efforts and addressing areas where more research endevours are expected. Many studies have not adequately address the user-centric factors, such as preferences of users, demand for charging, cost of charging and the impact of charging infrastructure on overall user experience as the accessibility and convenience of the consumers [Citation26,Citation27]. There is a need to design a mechanism which can forecast the demand for charging, and then find optimal location for charging terminal considering the convenience of user along with economic and environmental factors. The low congestion of vehicles at charging terminals also reduces the carbon transition, reduces the overall charging cost, and optimizes the charging process [Citation28]. This article proposes the charging station planning scheme that integrates multiple elements to support the low-carbon transition and provide a sustainable solution. Through the consideration of user charging profiles, optimal charging capacity is determined, aligning with energy efficiency and economic viability. Soft computing techniques enable the optimization of charging terminal quantity, placement, and service range, while the comprehensive objective function ensures the selection of sustainable layout schemes. The integration of machine intelligence methods enhances transaction efficiency and transparency, reinforcing the sustainability and user-friendliness of the scheme [Citation29,Citation30]. Ultimately, this scheme contributes to the transition toward low-carbon transportation systems by promoting renewable energy use and reducing carbon emissions associated with EV charging.
Research contributions
Based on the above existing approaches, this paper fully dissects the vehicle charging power using innovative methods for low carbon transition and improved accessibility to charging stations.
The charging profiles of users are examined to determine the appropriate charging capacity, considering factors such as charging pile quantity, power, and the economics of charging facilities. The location of charging stations contributes to a positive consumer experience as it promotes user convenience and accessibility.
Layout and capacity management are fundamental for the optimization of the charging infrastructure. The variable weight Voronoi diagrams are employed to optimize the initial location of charging terminals and develop an objective function based on minimum conversion costs for users seeking charging terminals.
The conversation cost of each charging terminal option is analyzed using catfish particle swarm optimization (CPSO), with modifications to prevent local optima and generate an alternative library of charging terminal layouts.
A comprehensive objective function is then formulated by considering the minimum total cost of society, allowing for the selection of an optimal layout scheme from the alternative library of charging terminal layouts.
This section has revealed background details, existing works in the field of research and major contributions of the research work. The next section provides insights into the proposed methodology for low-carbon transition in the transportation sector.
Proposed methods
This section is elaborating the proposed work into different sub-sections in a cohesive manner. In order to address the problem of carbon footprints, this paper proposes the charging station planning scheme and provides a sustainable solution by considering various factors and employing advanced techniques. Firstly, the charging profiles of users play a crucial role in determining the charging capacity of stations. We have analyzed the demand for charging from the consumers and then we have also analyzed the supply against the demand for energy by the EV users. The alignment of delivery of energy to the respective users has been made with the aid of nature inspired proposed methodology. The proposed approach enhances the energy efficiency and also enhances the utilization of resource optimally by reducing the carbon emissions in the charging process. Then, the proposed mechanism attempts to improve the charging process for saving the maintenance of charging stations. It initially regulates the quantity of charging stations based on the service radius of charging stations at different time intervals. By incorporating the road tortuosity coefficient, the analysis of the service range of charging stations is determined. The proposed approach identifies the optimal charging station options that optimize the travel distances from source to destination for consumers and also contributes to sustainable transportation practices. The Voronoi diagrams are also utilized for enhancing the sustainable placement of charging stations. These diagrams help in optimizing the primary location of charging stations by considering the influencing factors such as approachability, proximity to destination routes, and density of population. The objective function is designed based on the minimum conversion cost for consumers who are looking for charging stations and the proposed method ensures cost-effectiveness and user convenience for end consumers. The catfish particle swarm optimization (CPSO) algorithm is also employed to determine the global solution by avoiding the local optima. This helps in generating the optimal location of charging stations for the delivery of energy to the energy seeker consumers for their electric vehicles. The entire process generates the layout of charging terminals for fulfilling the energy demands of consumers of electric vehicles. In order to determine the most suitable layout, a comprehensive objective function is designed that minimizes the total cost of energy delivery. The objective function considers both economic as well as environmental aspects for minimizing the carbon emissions. By considering sustainability as a main criterion, the proposed method aims to minimize the overall costs of delivery of energy to EV vehicles. It also promotes renewable energy utilization, and reduces the carbon footprints.
Determination of demand for charging and quantity for charging
Identification of vehicle charging demand
Considering the vehicle usage scenarios and consumer charging preferences across different locations in the city. The charging demand for EV within each field is determined by the factors such as 100 km electricity consumption and average driving mileage. This field-specific vehicle charging demand has been calculated by using EquationEquation (1)
(1)
Where Q(i) is the average daily charging demand of new energy vehicles in field i; D(i) is the average annual mileage of new energy vehicles in field i; P(i) is the 100 km electricity consumption of new energy vehicles in field i; R(i) is the average percentage of new energy vehicles in field i that use public charging piles; η is charging efficiency.
Analysis of the whole life cycle economics of charging piles
In this study, our main focus is to evaluate the entire life cycle economics of charging piles, particularly in terms of the payback period. To achieve this, we need to analyze the investment cost and the associated benefits of charging piles separately. The cost inputs for charging piles primarily encompass the construction and operational expenses of charging facilities, while the gains are primarily derived from operation service fees and government subsidies [Citation19,Citation20]. Additionally, considering that the typical operational cycle of charging piles spans over 6 years, we introduce a discount rate to establish the objective function for investments throughout the entire life cycle of charging piles, as illustrated in EquationEquations (2)(2)
(2) and Equation(3)
(3)
(3) . We determine the payoff function, as presented in EquationEquation (2)
(2)
(2) , to further quantify the benefits.
(2)
(2)
In EquationEquation (2)(2)
(2) , j represents the power type of charging terminal; n stands for the number of years, i.e. 1, 2, 3, …N; Cop(n,j) is the daily operation and investment of type j charging facilities in the nth year; Cso(n,j) is land rental cost; Cman(n,j) is management cost; Ceq(n,j) is equipment maintenance cost; Clo(n,j) is electrical loss cost; Ctax(n,j) is taxation cost; Cel(n,j) is other daily operating cost. C has been calculated in EquationEquation (3)
(3)
(3) .
(3)
(3)
Where Cf is the total investment of charging facilities within a whole life cycle; r is discount rate, taken as 8% [Citation10]; Cep(j) is the cost of purchasing charging facilities and equipment; Cin(j) is equipment installation expense; Cot(j) is another fee. P has been calculated as in EquationEquation (4)(4)
(4) .
(4)
(4)
Where Pf is NPV of operational earnings; Pse,n is the total charging service fee from users in the nth year; Psu,n is governmental financial subsidy; Pre,n is the NPV of equipment scrapping and recycling after N-year use, which is counted by 5% of equipment cost. Considering that there are no subsidies for charging terminal construction and operation, we consider a charging service fee of 0.75 yuan/kWh. To illustrate this, we utilize the survey data from , which includes 38 charging terminals with a power capacity of 60 kW each. By substituting these values into EquationEquations (2)(2)
(2) to Equation(4)
(4)
(4) , we can establish the relationship between the average daily charging capacity and the revenue generated by the charging piles. This relationship is visualized in .
Figure 1. Operational economics of 60 kW charging facilities.
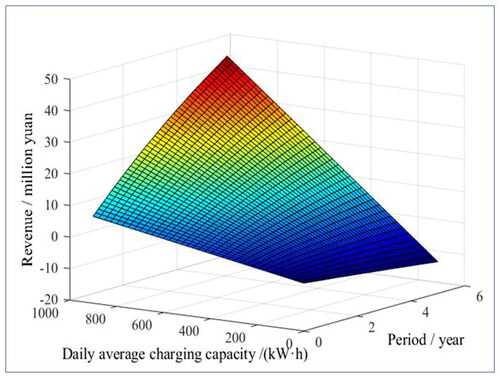
Table 1. Investment in the construction and operation of charging terminals for facilitating low carbon transition.
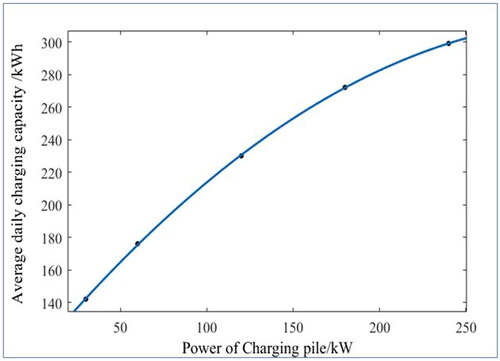
Based on estimates, in order to achieve profitability within a three-year timeframe, the average daily power supply for a single 60 kW charging pile should exceed 176 kWh. Similarly, the overall life cycle economics of charging piles with power capacities of 30, 120, 180, and 240 kW are analyzed using survey data. Fourier fitting is applied to obtain the average daily charging capacity for a single charging pile, considering the profitability of charging piles with different power capacities within a three-year period. The results of this analysis are presented in .
Figure 2. Charging capacity of each power charging pile.
Determining the optimal number of charging piles to be constructed in the public area within the designated planning area
Large differences in vehicle usage and use scenarios lead to large differences in users’ preferred charging power and the proportion of public charging pile users [Citation26,Citation27]. Our investigation on charging terminals and users in Hainan province, Xiamen city, Changchun city and others reveals that private areas are mainly installed with self-built charging piles, but due to insufficient parking spaces, the difficulties in mounting charging piles in gated communities, and off-site charging, the charging piles constructed in public areas still need to satisfy the charging demand of at least 25% of vehicles in private areas. Moreover, as vehicles such as taxis, and cars hailed online, buses and sanitation vehicles are more sensitive to time, so for ease of calculations it is assumed that it is recharged by public charging piles only [Citation28]. The percentage of power-wide public charging piles suitable for private and public vehicles is given in .
Table 2. Percentage of charging pile power preferably used by new energy vehicles.
In order to accommodate evolving needs and maintain operational efficiency, the planned quantity of charging piles with a power capacity of 30 kW or higher should adhere to EquationEquation (5)(5)
(5) [Citation28]. Additionally, to ensure a gradual increase in the number of charging piles, a car-pile ratio of 2:1 is adopted for the planning of charging piles with a power capacity of 30 kW or lower in public areas. The corresponding Equation is EquationEquation (5)
(5)
(5) .
(5)
(5)
Where A(i) is the quantity of charging piles with power i; Qm(i) is the total power supply required of charging piles with power i; Qa(i) is the minimum average daily single-pile power supply of charging piles with power i on the condition of ensuring three-year profitability.
Let’s consider the example of the designated area in downtown Changchun. By taking into account factors such as car ownership, the development trend of new energy vehicles, and the current number of vehicles in the area, we project the average daily quantity of both public and private vehicles in the planned area by 2025. It’s important to note that the charging demand of trucks in the area is not considered as their charging scenario mainly involves logistics dispatching centers located outside the main urban area. By referring to and utilizing EquationEquation (5)(5)
(5) , determine the quantity of different types of charging piles required in the planned area, as presented in .
Table 3. Estimation of the number of power-based charging piles to be placed in the planned area.
Division of service range via weighted voronoi diagram (VD)
VD is a method of distance-based plane segmentation that regards the closest distance to the vertex in the plane as the basis of determination [Citation29]. Each vertex radiates differently in different scenarios and there is a phenomenon of different expansion rates with the vertex as the core. Therefore, different weights are assigned to the delineated vertices, enabling them to radiate at different rates until they come into contact with other diffusion regions [Citation30].
Let’s assume for a set of points Q = {q1, q2, q3, …, qn} (3 ≤ n ≤ ∞) that are not identical to each other in the plane, and define the weighted VD in EquationEquation (6)(6)
(6) .
(6)
(6)
Where d(x, qi) and d(x, qj) are the Euclidean distances between x and qi and between x and qj, respectively, and ωi is the vertex Voronoi diffusion weight. In charging terminal planning, the weight ωi of each vertex is mainly used to reflect the scale and service capacity of the charging terminal. The more the number of charging piles and the higher the power in the charging terminal, the larger the weight ωi is, a way that illustrates the service range of different charging terminals more scientifically.
Establishment of charging terminal sites
Determination of objective function
The objective function covering operators and users is created with the comprehensive cost of charging terminal construction and operation and the conversion cost of users looking for charging piles as shown in EquationEquation (7)(7)
(7) .
(7)
(7)
Where Chu is pile-seeking conversion cost; Cbu is the translated annual cost of the charging terminal; Cen is the average annual operating cost of the charging terminal. The pile-seeking conversion cost is based on the model of minimizing the conversion cost during the driving process from the user to the charging terminal, whereby the location layout of charging terminals is initially selected and optimized. EquationEquation (8)(8)
(8) describes the objective function of pile-seeking conversion cost.
(8)
(8)
Where σ is the driving and time conversion cost of electric vehicles per km, determined by the model and user profile; dkj is the distance between charging demand point j and charging terminal k; qk is the number of EVs at charging demand point j each day. Due to the road network limitation, the distance between charging demand point j and charging terminal k is not a straight line characteristic, and therefore, tortuosity coefficient λkj is introduced, ranging from 1 to 1.41, the specific value of which is determined by the actual road conditions.
Charging terminal creation and operation costs are closely related to charging pile scales and levels. As the selected area under planning is small, we have made an assumption in this article that the unit land cost of each station remains unchanged. Since the transformers, installation expenses and management fees can be equally shared among the charging piles of the same station equally which is further optimized on the basis of EquationEquations (2)(2)
(2) and Equation(3)
(3)
(3) . The charging terminal construction and operation costs are obtained from EquationEquation (9)
(9)
(9) and Equation(10)
(10)
(10) .
(9)
(9)
(10)
(10)
Where Ckep is the purchase and installation costs of charging piles and supporting equipment in charging terminal k; Sk and CkL are the land use area and unit price/area of the charging terminal; Ckma, Ckeq, Cklo, Cktax and Ckel are respectively the annual management fee, equipment maintenance fee, electrical loss cost, taxation and other operating cost of the charging terminal.
3.2. Constraint determination
In the planning of charging terminals, it is important to consider constraints such as the service capacity and the maximum service radius [Citation18]. These factors ensure that the charging terminal covers a wider area and caters to a larger number of charging demands. If the maximum vehicle charging demand within the coverage area exceeds the service capacity of the charging terminal, it may result in unmet charging needs for other vehicles. Additionally, if the distance between the vehicles in the coverage area and the charging terminal is too great, there is a risk of the vehicle’s battery running out of power before reaching the charging terminal, causing inconvenience for users [Citation19]. While building the model, the remaining EV battery capacity is not taken into account, thus making the service radius of the charging terminal the primary constraint in this regard.
Constraint of new energy vehicle charging demands as shown in EquationEquation (11)
Where Nknev is the number of new energy vehicles within the service area of the charging terminal; γmax is the simultaneous charging rate of new energy vehicles within the service area of the charging terminal; Nkm is the number of charging piles in the charging terminal needed to improve the charging experience (the charging vehicles within the service area at the peak of simultaneous charging are not more than the charging piles).
Constraint of new energy vehicle service radius as given in EquationEquations (12)
Where dmax is the maximum distance to charging terminal from charging demand point; Dkj is Euclidean distance between two charging terminals; Dmin is the minimum distance specified between two charging terminals.
Catfish PSO
Charging terminal selection is a matter of nonlinear optimization solution, and the conventional PSO algorithm tends to fall into local optimum while determining the solution. Therefore, we adopted catfish PSO (CPSO) to improve the speed, effect of solution and optimization as shown in EquationEquation (14)(14)
(14) .
(14)
(14)
Where c3 and c4 denote the intensity of catfish interference with the individual optimal extremes and the full optimal extremes; c3rand() and c4rand() indicate catfish operators, the values of which are taken as follows:
(15)
(15)
(16)
(16)
Where e0p is the deviation threshold between the current cost and the current individual extremum; ep is the deviation between the current cost and the current individual extremum; e0g is the deviation threshold between the current cost and the current global extremum; e.g. is the deviation between the current cost and the current global extremum. It can be seen that if the deviation of the current cost is greater than the deviation threshold, the catfish operator c3rand() takes the value of 1, and at this point, the CPSO algorithm is the standard particle swarm algorithm; otherwise, it is considered convergence phenomenon in particles, and the catfish operator is used to perturb the local optimum and the global optimum. As a result, the particles are prompted to keep moving through the impact and thus converge to the global optimum.
Establishment of charging terminal sites database
Pre-planning assumptions
The modeling of the charging terminals mentioned in this article is based on the following presuppositions.
The charging terminals are all reasonable candidates selected according to the analytical results of regional population density and conform to the site selection principles of charging convenience, grid capacity security, and geographic adaptability.
Each demand point represents a region, and the charging load of the corresponding demand point signifies the charging demand of all EVs in the region.
The distance from all users at each demand point to the charging terminal is a reasonable choice.
Capacity and location determination processes of charging terminals
The capacity and location determination processes of charging terminals are as follows:
Based on the quantity of power-wide charging piles Np and the maximum service capacity of charging terminals at various levels, the quantitative range of charging terminals [Ns min, Ns max] is obtained in advance according to the constraint and the charging terminal scale division standard, namely the alternative pool of charging terminal quantities.
Based on the regional population density map, road network map, power grid planning and geographic environment, and theoretical basis that higher level charging terminals are laid out in the areas with higher population density and traffic flow in the area under planning, we first determined the locations of initials at various levels in the road network map according to different alternative solutions. Then, we used the alternative charging terminal as the growth kernel vertex, set charging terminal weights based on the charging terminal levels, and generated a weighted VD to analyze the divided service range of these stations and judge whether they meet the planning constraints.
Within the service range of each initial station, a site selection model is built with the minimum station-seeking conversion cost. Based on the model, the users’ conversion costs in different alternative location schemes are analyzed by CPSO. The estimation steps of conversion costs are as follows:
Initialize various CPSO parameters in a randomized manner to generate the initial particle locations.
Calculate the particle fitness value using the cost occurred in finding charging piles as a fitness function.
Calculate the catfish operator through EquationEquations (15)
Compare the fitness values, and update the particle fitness to the optimal state.
After the maximum iteration is reached, output the optimal position of the particle; otherwise, continue to optimize starting from step (2).
Introduce the construction and operation costs of charging terminals in each option from EquationEquations (9)
Compare the costs of different options, and select the option with the lowest comprehensive cost as the best capacity and location of charging terminal.
Results and analysis
Planning and analysis of the quantity of charging terminals in the area under planning
The 108 km2 area under planning in downtown Shijiazhuang is described in Section 1.3 which has been taken as an example to calculate the quantity of charging piles at different power levels (see ). For simplicity, the number, power, area and service radius of charging piles in the charging terminal at each level are shown in .
Table 4. Parameters of different-level charging terminals.
As can be observed in , as the charging terminal scale goes larger, the service capacity will also be enhanced but the individual charging terminal construction cost will go up in that case. There is a need to initially determine the number of charging terminals to be established to meet the vehicle charging demand. However, when lesser number of charging terminals is built, their service radius will be larger than the maximum service radius constraint, and the driving cost for users to find charging piles will be significantly increased. When more charging terminals are established, then the required charging terminal scale will be reduced, and the number of individual charging terminals will be gradually cut down as the land usage fee and grid connection cost reduces eventually, but the comprehensive expenses will rise. The comprehensive fee will cover cost of transformers, operating costs, and other supporting facilities, leading to increase in comprehensive charging terminal cost. Therefore, according to the constraints of EquationEquations (11)(11)
(11) to Equation(13)
(13)
(13) and preliminary consideration of the comprehensive cost, the value range has been determined for the charging terminals.
demonstrates the average energy delivery of single AC charging station in the city at each hour during a day time. Energy delivery graph exhibits changes during the different times of the day as it peaks at 9AM and 7PM when multiple users arrive at their workplace to charge their respective vehicles. The energy which is utilized to maintain the charge also increases at noon, when most of the EV vehicles are fully charged. The average charging event at charging station takes 2.77 h and uses 6.56 kWh of energy.
provides insights into the maintenance state of the AC charging station during delivering AC charge to the electric vehicles. The above graph is showing the average of maintaining the charging state across each station. Most of the charging stations are busy in the morning between 9 to 10 AM. After charging, maintenance bar starts showing upward trend from the morning to afternoon timing. By the evening, the demand again increases for charging stations and maintaining state starts diminishing as till the next morning, the charging stations are put at rest. It requires 0.338 h timing for maintaining per day per charging station.
Regional layout analysis of charging terminals in the area under planning
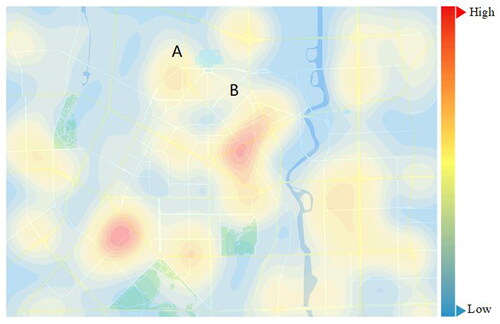
is the heat map of pedestrian volume in the area under planning, which partly reflects the traffic density. According to the charging terminal planning principle, charging terminals tend to be built near the roads with higher traffic density. Therefore, based on the above-mentioned number of charging terminals, further in combination with the data of charging terminal scale and service radius, and based on the road network structure, the preliminary selection of charging terminal sites is completed, and the service range of charging terminals is divided by the weighted Voronoi diagram. It should be noted here that buses and passenger cars are mainly recharged at passenger transportation centers and dispatching stations from points A to B as shown in which are the locations of medium-large charging terminals under planning.
Figure 3. Energy delivery at each hour during day time for a single AC charging.
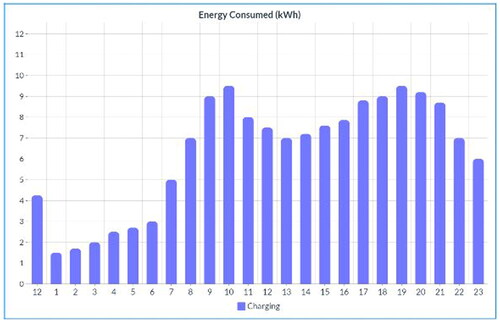
Figure 4. Time spent by charging station to maintain the state.
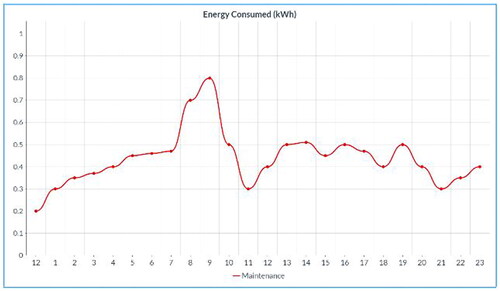
Figure 5. Heat map of pedestrian volume in the area under planning.
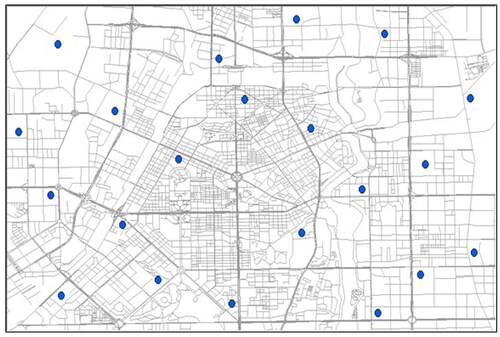
The preliminary screening and division of charging terminals under different quantity scenarios is implemented in line with the regional traffic density and the service radii of charging terminals at different scales. gives the information on the 21 charging terminal locations laid out with ArcGIS on the road network map of the area under planning according to traffic flow.
Figure 6. Charging terminal location information.
First of all, this research analyzed the pile-seeking conversion cost of charging terminal layout in different quantity scenarios in terms of charging convenience, and employed the CPSO algorithm to calculate the objective function fitness value of pile-seeking cost. The average daily charging vehicles in the area under planning of public charging piles are about 648 in number. For ease of measurement, the population size is set be 600, the inertia weight coefficient ω = 0.73, the CPSO parameters c1=c2=2, c3=1, c4=4, e0p=0.01, e0g=0.02, the single-kilometre driving and time conversion cost of electric vehicles σ = 0.85 yuan/km, and the number of population iterations are 100. is the scheme for locating 21 charging terminals and the comparison of the convergence curves of two algorithms for selection of charging terminal sites. It can be seen that the PSO algorithm used is superior to the conventional PSO algorithm in terms of convergence speed and optimization effect, and more fruitful.
Through continuous iterative refinement, the minimum annual conversion cost of pile seeking under different quantity schemes of charging terminals is obtained ( and ). Changed trend of the conversion cost of users seeking piles is shown in .
Figure 7. Comparison of optimal fitness curves of two algorithms.
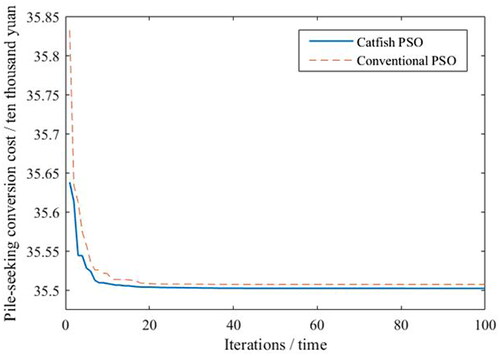
Figure 8. Change trend of the conversion cost of users seeking piles.
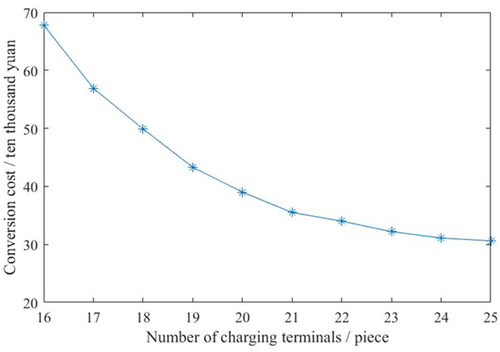
Table 5. Pile-seeking conversion cost under different quantity schemes of charging terminals.
In , it can be seen that the more the number of charging terminals, the more convenient it is for users to find charging terminals, and the lower the conversion cost. But when the number of charging terminals reaches to 20 or above, the conversion cost decreases largely as the number of charging terminals continues to increase. The construction and operation cost parameters of different-scale charging terminals are further introduced, and the comprehensive cost in the layout scheme of different charging terminal quantities ( and ) is derived from EquationEquations (7)(7)
(7) to Equation(10)
(10)
(10) through iterative calculation.
Table 6. Comprehensive cost of charging terminals at different scales.
In and , it can be seen, as the number of charging terminals are increasing, the driving distance for users to find charging terminals is reducing, which in return leads to lower pile-seeking conversion costs. In nutshell, the higher number of charging terminals eventually increases the average cost for equipment sharing and operational cost. According to comprehensive analysis, if the number of charging terminals in the area under planning is 21, the comprehensive cost is the smallest, which is the best solution for determining the charging terminals in that area. Therefore, the scale of charging terminals with the lowest comprehensive cost in the area under planning is 9 small charging terminals, 8 medium charging terminals, 2 medium-large charging terminals, and 2 large charging terminals, and the station coordinates are given in . The service range of each charging terminal is further divided on the road network map via ArcGIS and the weighted Voronoi diagram. The results are illustrated in . In addition, the service range of different charging terminals differ widely, mainly depending on the service capacity of charging terminals at different levels.
Figure 9. Changing trend of the comprehensive cost of charging terminals at different scales.
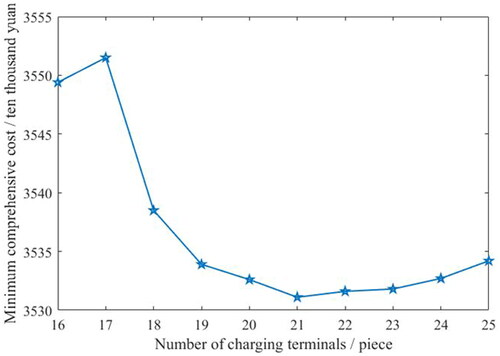
Figure 10. Charging terminal planning and service range division results.
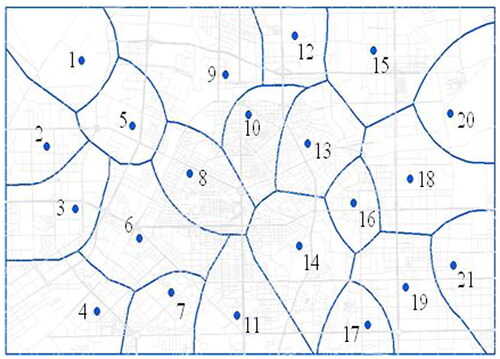
Table 7. Location coordinates and scales of charging terminals.
Comparison with state-of-the art-methods
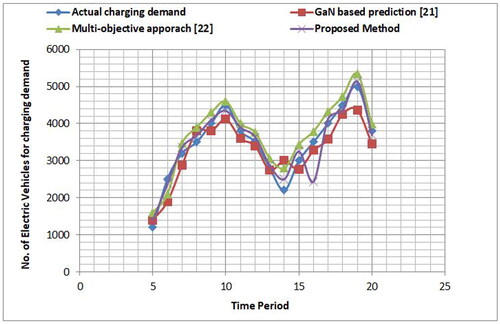
It is bit difficult to make comparison with all the existing methods with the proposed technology but we are choosing some of the latest existing methods for carrying out the comparative study with our proposed method. The charging strategies are compared for the prediction of energy demand by EV vehicles from charging stations as shown in . The results reveal that the proposed method analyze the demand for charging very accurately to deliver energy to the electric vehicles as compare to the comparative methods.
Figure 11. EV count for charging demand at charging stations.
Secondly, the statistical parameter standard deviation has been considered as a parameter for the comparative study after calculating the energy delivered by all the charging mechanisms as a final parameter.
, Citation9 and Citation10 are presenting the comparison between the nature inspired proposed method and state-of-the-art methods namely GaN-based charging method [Citation21] and multi-objective charging strategy [Citation22] with respect to standard deviation (SD) load for energy delivery to AC charging stations. The values are representing the deviations in percentage at different levels of SD load. It is observed from . that at the lower SD (0.01 and 0.05), the nature inspired proposed charging method consistently outperforms GaN-based charging method [Citation21] and multi-objective charging strategy [Citation22], and proving the lower deviations in percentage for energy delivery. As there is an increase in SD load, the performance gap between the proposed charging mechanism which is using machine intelligence nature inspired method and other method narrows, but the proposed charging mechanism still maintains a competitive edge. GaN-based charging method [Citation21] tends to show higher deviations across all SD load levels. The performance of GaN-based charging method [Citation21] becomes more considerable as the SD load increases, but it lags behind the proposed charging mechanism. At lower SD of 0.01 and 0.05, the proposed charging mechanism consistently demonstrated superior performance over the other two methods, maintaining lower percentage deviations as compared to GaN-based charging method [Citation21] and multi-objective charging strategy [Citation22]. As the SD load increased to 0.1 and 0.5, the proposed charging mechanism continued to perform better than both alternatives. It is evident that even at higher load variability (0.5), the proposed charging mechanism maintained its values consistently with lower percentage deviations. The comparative results suggest that the proposed nature inspired charging mechanism excels in providing accurate and reliable energy delivery to charging stations across a spectrum of SD load scenarios.
Table 8. Standard deviation (SD) for the proposed method for delivery of energy to EV at charging stations on average basis.
Table 9. SD for the GaN-based charging method for delivery of energy to EV at charging stations on average basis.
Table 10. SD of the multi-objective charging strategy for delivery of energy to EV at charging stations on an average basis.
Conclusion
In conclusion, the charging station planning scheme integrates multiple elements to support the low carbon transition and provide a sustainable solution to the electric vehicles by describing the appropriate quantity for charging terminals. To cater to the charging demand of new energy vehicles and the whole life cycle economics of charging piles, the location and capacity management of charging terminals through a weighted VD and CPSO algorithm is designed. The results reveal that the standard deviation (SD) of the proposed method shows the lowest or optimal values especially at the lower SD (0.01 and 0.05), the nature inspired proposed charging method consistently outperforms GaN-based charging method and multi-objective charging strategy, and proving the lower deviations for energy delivery. As the number of vehicles increase for charging the proposed method shows accurate demand for charging with 94.5% accuracy. For achieving this accuracy, the road tortuosity coefficients based on road network characteristics have been deployed to mitigate the effect of the conventional pile-seeking algorithm on the accuracy of Euclidean distance between the vehicle and the charging terminal. From the view of charging convenience, the objective function of pile-seeking conversion cost is optimized by the CPSO algorithm. Ultimately, the proposed scheme contributes to low carbon emission by enhancing the charging facilities to promote electric vehicles. In future, a mechanism can be developed that can dynamically forecast the demand for charging by considering more factors such as seasonal variations, special events, and emerging trends in electric vehicle adoption. The charging terminals can be integrated with renewable energy sources and strategies can be explored for optimizing energy usage, energy storage, and distribution within the charging infrastructure.
Disclosure statement
No potential conflict of interest was reported by the author(s).
Data availability statement
The data can be shared on a valid request from the institutional email of the researcher.
Additional information
Funding
References
- Tian S, Hua G, Cheng TCE. Optimal deployment of charging piles for electric vehicles under the indirect network effects. Asia Pac. J. Oper. Res. 2019;36(01):1950007. doi: 10.1142/S0217595919500076.
- Wang H, Zhao D, Cai Y, et al. A trajectory-based energy consumption estimation method considering battery degradation for an urban electric vehicle network. Transp Res Part D: transport Environ. 2019;74:142–153. ” doi: 10.1016/j.trd.2019.07.021.
- Mingyu PAN, Xukun SUN, Xianglong LI, et al. Optimization of charging pile layout based on cost control and collective coverage model. Modern Electric Power. 2021;38(02):230–236.
- Chen Z, Wang W, Li Z, et al. Study on optimization of charging pile layout based on multi-factor constrained P-median model. J Beijing Jiaotong Univ. 2021;45(3):93–99.
- Kaur M, Kadam S, Hannoon N. Multi-level parallel scheduling of dependent-tasks using graph-partitioning and hybrid approaches over edge-cloud. Soft Comput. 2022;26(11):5347–5362. doi: 10.1007/s00500-022-07048-1.
- Zhou G, Zhu Z, Luo S. Location optimization of electric vehicle charging stations: based on cost model and genetic algorithm. Energy. 2022;247:123437. doi: 10.1016/j.energy.2022.123437.
- Kong W, Luo Y, Feng G, et al. Optimal location planning method of fast charging station for electric vehicles considering operators, drivers, vehicles, traffic flow and power grid. Energy. 2019;186:115826. doi: 10.1016/j.energy.2019.07.156.
- Jiang L, Sakhare SR, Kaur M. Impact of industrial 4.0 on environment along with correlation between economic growth and carbon emissions. Int J Syst Assur Eng Manag. 2022;13(S1):415–423. doi: 10.1007/s13198-021-01456-6.
- Kaur M. AI- and IoT-based energy saving mechanism by minimizing hop delay in multi-hop and advanced optical system based optical channels. Opt Quant Electron. 2023;55(7):635. doi: 10.1007/s11082-023-04882-x.
- Wang T, Zhang F, Gu H, et al. A research study on new energy brand users based on principal component analysis (PCA) and fusion target planning model for sustainable environment of smart cities. Sust Energy Tech Assess. 2023;57:103262. doi: 10.1016/j.seta.2023.103262.
- Yu G, Zhang X, Wang H, et al. Low carbon planning of PV-charging stations for self-sustained highway transportation energy system considering the retirement of gas stations. IEEE Trans. on Industry Appl. 2024;60(1):1208–1218. doi: 10.1109/TIA.2023.3282933.
- Li Y, Tan Z, Yang S, et al. Multi-attribute feature fusion algorithm for blockchain communications in healthcare systems using machine intelligence. Soft Comput. 2023;27(22):17435–17445. doi: 10.1007/s00500-023-09192-8.
- Roy S, Venu S, Sai Karthik KA, et al. An ecosystem blueprint for electric vehicle charging stations fed by a hybrid microgrid – a case study. In 2022 22nd National Power Systems Conf. (NPSC), New Delhi, India;2022 pp. 908–913. doi: 10.1109/NPSC57038.2022.10068987.
- Karmaker AK, Hossain MA, Pota HR, et al. "Energy management system for hybrid renewable energy-based electric vehicle charging station," in. IEEE Access. 2023;11:27793–27805. doi: 10.1109/ACCESS.2023.3259232.
- Clairand J-M, González-Rodríguez M, Cedeño I, et al. A charging station planning model considering electric bus aggregators. Sustain. Energy, Grids Networks. 2022;30:100638. doi: 10.1016/j.segan.2022.100638.
- Liu Z -f, Zhang W, Ji X, et al. Optimal Planning of charging station for electric vehicle based on particle swarm optimization. IEEE PES Innovative Smart Grid Technologies, Tianjin, China; 2012:1–5, doi: 10.1109/ISGT-Asia.2012.6303112.
- Abdel-Basset M, Gamal A, Hezam IM, et al. Sustainability assessment of optimal location of electric vehicle charge stations: a conceptual framework for green energy into smart cities. Environ Dev Sustain. 2023;26(5):11475–11513. doi: 10.1007/s10668-023-03373-z.
- Hou H, Tang J, Zhao B, et al. Optimal planning of electric vehicle charging station considering mutual benefit of users and power grid. WEVJ. 2021;12(4):244–255. doi: 10.3390/wevj12040244.
- de Lima TD, Franco JF, Lezama F, et al. Joint optimal allocation of electric vehicle charging stations and renewable energy sources including CO2 emissions. Energy Inform. 2021;4(S2):33. doi: 10.1186/s42162-021-00157-5.
- Zhang Y, Hua Y, Kang A, et al. Optimal and efficient planning of charging stations for electric vehicles in urban areas: formulation, complexity and solutions. Exp Sys. with App. 2023;230:120442. doi: 10.1016/j.eswa.2023.120442.
- Elrais MT, Rezaii R, Batarseh I. Scalable GaN-Based EV Charging Station with Energy Storage. 2023 IEEE applied power electronics conference and exposition (APEC). Orlando, FL; 2023:pp. 1688–1692. doi: 10.1109/APEC43580.2023.10131300.
- Ahmed HY, Ali ZM, Refaat MM, et al. A multi-objective planning strategy for electric vehicle charging stations towards low carbon-oriented modern power systems. Sustainability. 2023;15(3):2819. doi: 10.3390/su15032819.
- Mohammad S, Ali G-M. Fast-charging station for electric vehicles, challenges and issues: a comprehensive review. J. Energy Storage. 2022;49:104136.
- Jaraniya D, Kumar S. PV charging station with VSS-IMSAF and SOSMCC disturbance observer based controls to enhance the distribution grid capability. IETE of Research. 2023;70(2):2166–2177. doi: 10.1080/03772063.2023.2169201.
- Savari GF, Sathik MJ, Raman LA, et al. Assessment of charging technologies, infrastructure and charging station recommendation schemes of electric vehicles: a review. Ain Shams Eng J. 2023;14Issue(4):101938. doi: 10.1016/j.asej.2022.101938.
- Alkawsi G, Baashar Y, Abbas U D, et al. Review of renewable energy-based charging Infrastructure for Electric Vehicles. Applied Sciences. 2021;11(9):3847. doi: 10.3390/app11093847.
- Raykar N, Khedkar G, Kaur M, et al. A novel traffic load balancing approach for scheduling of optical transparent antennas (OTAs) on mobile terminals. Opt Quant Electron. 2023;55(11):962. doi: 10.1007/s11082-023-05201-0.
- Patil S, Kaur M, Rogulj K. Fairness-driven link scheduling approach for heterogeneous gateways for digital twin enabled industry 4.0. Int. J Intelligent Networks. 2023;4:162–170. doi: 10.1016/j.ijin.2023.06.001.
- Zavorka R, Paar MA. Focus on electromobility within smart city solutions—charging stations, renewable energy, and air quality monitoring. Sensors. 2022;22(20):7841. doi: 10.3390/s22207841.
- Dillon R, Donnie B, Rean M. A techno-economic quantification of carbon reduction strategies in the Trinidad and Tobago power generation sector using carbon emission pinch analysis (cepa). Carbon Manage. 2023;14(1). doi: 10.1080/17583004.2023.2227159.