
 ?Mathematical formulae have been encoded as MathML and are displayed in this HTML version using MathJax in order to improve their display. Uncheck the box to turn MathJax off. This feature requires Javascript. Click on a formula to zoom.
Abstract
Confronting climate change, this study quantifies the embodied carbon emissions from the building sector—an overlooked yet significant contributor to urban carbon emissions. Through a novel empirical framework, the embodied carbon of Chicago’s building stock was assessed and visualized, providing a scalable template for other cities with comparable datasets. The analysis encompasses 1,010,840 buildings and identifies 157 architectural archetypes. This methodology facilitates the granular evaluation of embodied carbon, guiding strategic urban carbon mitigation planning. establishes visual analytics tools for informed policymaking. The geospatially resolved findings identify emissions-intensive zones showing that majority of emissions are concentrated in specific archetypes and geographic areas, delivering actionable data for urban development stakeholders. The findings reveal that increasing the building lifespan to 80 years with a 20% reduction in building sizes can decrease carbon emissions to one-third of the current value. The research harnesses the Excel 3D Map tool for emissions visualization, offering an intuitive understanding of urban emissions’ spatial dynamics and highlighting key areas for intervention. Furthermore, a sensitivity analysis explores the repercussions of end-life thresholds and building sizes on projected emissions. This multifaceted approach enhances the capacity for data-driven, low-carbon urban planning, paving the way for cities to align with global decarbonization goals and laying the groundwork for a versatile embodied carbon assessment methodology. This study contributes to the existing literature by creating a transferable framework for measuring embodied carbon in building stocks, providing detailed geo-accurate data for urban planners and policymakers, and offering benchmarks and visualizations for assessing and understanding embodied carbon performance and mitigation in urban environments, exemplified by the city of Chicago.
Introduction
The 2021 Global Status Report for Buildings and Construction published by the United Nations details that global carbon emissions from the building sector represent 37% of total emissions, including 10% from building construction (i.e. embodied carbon emission) [Citation1]. via research, practice, and regulatory tools enacted over multiple decades, we have a clear understanding of operational building energy use and associated carbon emissions partnered with effective carbon reduction strategies [Citation2,Citation3]. However, mitigating the climate emergency and moving toward carbon neutrality will require that all carbon emissions from building stock be quantified and strategies enacted to reduce their impacts. The embodied carbon of a building [Citation4] – resulting from the greenhouse gases emitted from the extraction, manufacturing, transportation, installation, maintenance, demolition, and disposal of building materials over a building’s whole lifecycle is a prime but overlooked target for impact and mitigation [Citation5,Citation6]. As current green building codes, benchmarks, and regulations remain focused on operational energy savings and carbon reduction, the empirical studies on the effectiveness of embodied carbon (e.g. recycle and re-use) mitigation strategies on the built environment remain limited due to the paucity of high-quality data [Citation7,Citation8]. Recent studies have found that green buildings focusing solely on operational energy and carbon can be more harmful than traditional buildings due to the exclusion of embodied carbon emissions in their assessments [Citation2]. These elevated negative effects are presumed to be due to the non-inclusion of embodied carbon emissions in current “green” practices. Hence, a method of measuring and assessing the whole building life cycle embodied carbon (LCEC) of buildings at an urban scale is needed. The urgency of addressing building emissions cannot be overstated since it is the essential first step to creating strategies to mitigate and reduce carbon emissions from the building sector. As urban centers continue to grow, the decisions made today regarding building design, construction materials, and energy systems will have long-lasting effects on the urban carbon footprint and the global fight against climate change. Despite this importance, the understanding of the complete life cycle of the building stock at cities and urban scales has not received enough attention due to the lack of high-resolution data and methodologies to assess them. While some studies have tried to approach this issue in the developing countries with more available large-scale data [Citation9–13], this phenomenon is specifically more tangible in the developed countries such as the United States.
In the United States, the lack of knowledge regarding a building’s embodied carbon impact exists at the whole-building level, and is due to three gaps: (i) methodology to measure the entire building stock– per differences in building types, (ii) building-level data at the national scale, and (iii) benchmarks for assessing the building’s embodied carbon performance. In addition to building stock complexities, there is also heterogeneity in the urban context. Differences between states in terms of existing building inventory, market demand, climate, population size and density, and vacancy rates all play a role in embodied carbon assessments – thus there is no one-size-fits-all solution. Building-level data is a foundational element of decarbonizing the built environment because we cannot manage what we do not measure. Moreover, embodied carbon benchmarking is useful for designer, practitioners, and local and state policymakers. Hence there is an urgent need to measure, inventory, assess and map building sector embodied carbon emissions at the national scale.
To fill the knowledge gap, this research aims to create a framework and model to measure, map, and benchmark the individual building’s embodied carbon and environmental impact on an urban scale with high resolution. Chicago is used as a case study to test and validate the proposed framework.
Literature review
Methods for calculating and mapping carbon emissions from urban building stocks are diverse and contingent upon the collected data, the foundational models applied, the emission sources identified, and the intended scope of application [Citation14].
Review of methods used for urban embodied carbon assessment
Presently, there are two predominant categorical methodologies employed for the appraisal of carbon emissions at the urban scale: (1) Top-down methodologies synthesize data for the entire aggregate of building stock by employing macroeconomic or statistical datasets—such as material flow analyses—at a collective level. This is typically carried out within defined geographic confines (e.g. urban or national boundaries) and temporal parameters. Subsequently, this composite data is partitioned into discrete segments, for instance, delineating single-family residences based on their functional characteristics or geographic propinquity, as elucidated by previous study [Citation15]. (2) Bottom-up methodologies conduct a granular analysis by evaluating individual elements within the building stock. This includes discrete buildings, specific materials, or distinct technological applications. These isolated assessments are then extrapolated to a broader stock-level context. As Mastrucci and colleagues suggested, through the disaggregation process, bottom-up approaches yield a considerably enhanced resolution in capturing the unique attributes of individual buildings, thereby facilitating a more precise evaluation of the embodied carbon emissions [Citation16].
The top-down methodological approach can be further subclassified into computational [Citation17] and statistical models [Citation16]. Each model is grounded in the statistical correlation drawn from historical data amalgamated at a macro scale, juxtaposed with socio-economic indicators such as population dynamics or economic development. These correlations serve to elucidate the interplay between the building sector’s activities and resultant carbon emissions, as explicated by [Citation15]. Both model variants are proficient in forecasting the macroeconomic performance of the building stock, as well as the implications of embodied carbon within varied developmental trajectories over time. An exemplar of a prominent top-down, statistically oriented model is the National Energy System (NEMS), as referenced by the Energy Information Administration in 2009. What distinguishes the computational model is its application and amalgamation of computational resources. The advancement of machine learning methodologies has spurred a heightened interest in computational models [Citation18].
The bottom-up approach is differentiated into three distinct model types: physics-based, statistical [Citation19], and computational [Citation20]. The primary divergence between top-down and bottom-up models, whether statistical or computational, resides in the origin and granularity of data inputs. For the bottom-up statistical and computational models, data is typically sourced from detailed, site-specific observations, contrasting with the broader, macro-level data employed by top-down models [Citation16]. Within the realm of physics-based models, two prominent subcategories emerge: the archetype method Lanau and colleagues [Citation21], which generalizes building characteristics into standard models, and the building-by-building method, which scrutinizes each building individually for detailed analysis [Citation22].
In the domain of bottom-up quantification of building stock, the use of geographical information data has markedly increased in recent years. This upsurge is driven by the escalating demand for data that is both precise and detailed concerning the traits and spatial arrangement of buildings. A notable advance in this field was achieved by Tanikawa and colleagues in 2009, who undertook an early foray into geo-localized evaluations of construction materials accumulated within buildings and infrastructural assets [Citation23].
Furthermore, even though some of the researchers have concentrated on carbon emission at the urban scale, most of these studies are focused on a specific phase (e.g. urban expansions or demolition) and have not considered the whole life cycle of the cities. Moreover, the majority of these studies are in the context of developing countries, specifically China. Many of the studies on an urban scale focus on transportation carbon emissions [Citation24,Citation25]. Some studies deployed simulation methods to assess this impact [Citation26]. Urban expansion is another area on this scale. A study in Wuhan, China worked on carbon storage loss issues in urban sprawl scenarios [Citation27]. Other researchers also worked on this area in Guangzhou, Changsha, Zhuzhou, Xiangtan, Beijing, Tianjin, and Hebei cities in China on the same area [Citation28–31]. These studies relied on simulation methods to estimate carbon emissions. A different study in China used a bottom-up approach to calculate the embodied carbon of the buildings [Citation32]. Nevertheless, this study uses a process-based input-output model which is not appropriate for large-scale predictions in the lack of data condition, which is mostly the case for the developed countries.
A study in Ireland concentrated on the whole life cycle emission from buildings [Citation33]. However, this study relied on the EPA datasets for estimating the emissions and did not concentrate on a high-resolution building-by-building estimation model. Therefore, this method cannot be used for further high detailed analysis and sensitivity analysis. Meanwhile, a study in the United Kingdom worked on a bottom-up methodology based on typologies of buildings to estimate the carbon emission [Citation34]. However, this study was focused on mostly assumptions about the current England buildings regarding their height, area, and type and not the actual dataset from the cities’ condition. Another study in Australia worked on a wide national scale of embodied and operational carbon emission but this study was also based on the 4 general archetypes, namely detached, townhouse, apartment, and high-rise building in the scope of residential buildings and did not consider the archetypes based on the cities’ existing buildings’ data [Citation35]. Therefore, the current study is one of the very first studies conducted in the context of developed countries and in a building-by-building high-resolution approach which makes it suitable for any high-resolution simulation and sensitivity analysis studies.
Review of urban carbon emission mapping
The mapping of existing carbon emissions is indispensable for comprehending the baseline and crafting strategies for carbon mitigation. Therefore, a critical aspect of evaluating carbon emissions from the urban built environment is to delineate their spatial distribution. Historically, studies have predominantly applied top-down methods to estimate and map carbon emissions, assign emission reduction responsibilities, and project emissions from the construction sector at the national and regional levels [Citation36,Citation17]. Such approaches have been more aligned with urban industrial planning rather than spatial planning. However, such approaches often overlook the embodied carbon emissions from material production, fall short in pinpointing the spatial distribution of carbon emissions from individual buildings, and do not support urban carbon management at a granular level.
Addressing this gap, this project has introduced a bottom-up approach using the archetype method to compute carbon emissions from urban building stocks. This method integrates data from various sources and statistical inventories, utilizing tools like ArcGIS. Carbon emission factors for different building archetypes are determined through professional experience and statistical analyses, using a building life cycle assessment model. The archetype method is then employed to construct detailed carbon emission inventories for individual buildings within urban areas, enabling the quantification and cartographic representation of carbon emissions from the urban building stock.
Materials and methodology
Overall approach
In this study, as illustrated in , a four-step bottom-up approach was used to assess the embodied carbon and environmental impact of Chicago’s existing building stock. The archetype approach, which models an average building to typify a segment of the building stock, is the most prevalent methodology employed in bottom-up building stock modeling [Citation37,Citation16]. This type of approach and model development is well-suited to building stock studies since it can link a high-resolution detailed assessment at an individual building level, scale it up, and apply the archetype data to the entire building stock at the urban scale [Citation37].
Figure 1. Research methodology flowchart.
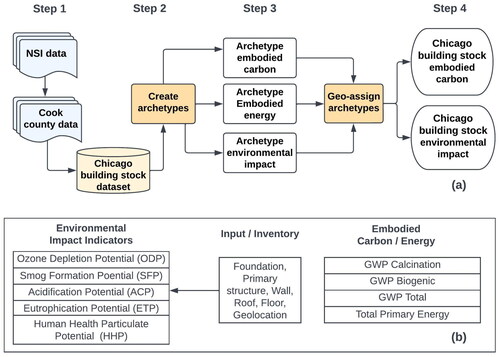
The first step started with Chicago building stock dataset creation. This phase involved the amassing of data, such as structural and material attributes of buildings, building floor area, and height, at a granular, individual building level. A comprehensive set of 15 building variables was extracted from two distinct data sources, as detailed in Building Stock Dataset Creation section and , with the geospatial coordinates of each building being precisely documented. Subsequently, the second step entailed the synthesis of individual building datasets into archetypes representative of Chicago’s diverse building stock. The details of archetypes are described in Archetypes CreationSection.
Table 1. Data sources and variables.
In the third step, the whole building life cycle embodied carbon (LCEC), embodied energy (primary energy), and associated environmental impact were calculated for each archetype. Athena Impact Estimator for Buildings was used to conduct the analysis. The Athena Impact Estimator for Buildings is a widely recognized tool for conducting life cycle assessments (LCA) of buildings. This software assess the environmental impact of building materials over their entire lifecycle, including extraction, manufacturing, transportation, installation, maintenance, and end-of-life disposal. The Athena Impact Estimator software is tailored for the North American region which makes it perfect for this study. Moreover, the comprehensive dataset, industry acceptance, and detailed outputs are other advantages that led to using this software [Citation38]. The results were then exported into an Excel sheet and integrated into one workbook to create the emissions dataset. In the final step, this dataset was employed to generate a visual representation on a map of Chicago, facilitating an analysis aimed at elucidating the spatial distribution of embodied carbon and the broader environmental impact exerted by the city’s existing building stock.
Building stock dataset creation
Two datasets were utilized for data collection. The National Structure Inventory (NSI) was used as the main source of the data collection, including the structural data of the buildings [Citation39]. The National Structure Inventory (NSI) was initially formulated by the United States Army Corps of Engineers to support its Dam and Levee Screening initiative. The latest iteration of this dataset has been made accessible to the public and has subsequently been incorporated into the database managed by the Federal Emergency Management Agency (FEMA).
The data collected for Chicago buildings from this NSI included building structure type, foundation type, square footage, number of floors, and coordination of each building. However, while wall and roof materials are among the factors that influence the buildings’ environmental emissions noticeably [Citation16,Citation40,Citation41], this dataset lacks the buildings’ envelope materials. Therefore, the Cook County Open Data was used to cover this gap for Chicago [Citation42]. It should be noted that this dataset includes the residential buildings and therefore the commercial buildings are not in the scope of this study. Coordination data, the roof and wall materials, the land square footage, and the heating systems (central heating, other heating, and central air conditioning) were collected from this dataset. demonstrates the data sources and variables used in this study. The geo-coordinates of each building were used to match the two data sources. The combined data sources lead to the creation of a dataset of over 1 million building
Embodied carbon and environment impact indicators
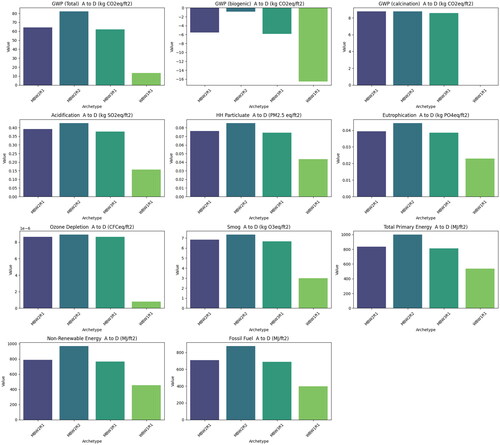
In this study, as illustrated in , in addition to LCEC, five midpoint environmental indicators were used to assess the life cycle environmental impact (LCEI) of the Chicago building stock: Human health particulate potential, ozone depletion potential, acidification potential, smog formation potential, and eutrophication potential. As stipulated by the U.S. Environmental Protection Agency, a suite of specific midpoint environmental impact categories has been established, utilizing common equivalence units to facilitate the comparison and quantification of sustainability objectives and achievements. These categories include (1) human health particulate potential (PM2.5 eq/m2); (2) acidification potential (kg SO2eq/m2); (3) eutrophication potential (Kg PO4eq/m2); (4) ozone depletion potential (CFCeq/m2); (5) smog formation potential (kg O3eq/m2); and (6) human health cancers, non-cancerous diseases, and eco-toxicity effects (various units). The first five categories are predominantly utilized within the building and construction sector, attributable to their direct relevance to building lifecycle impacts [Citation37].
Archetypes creation
For this study, directly calculating the environmental impact of individual buildings was not feasible because of the enormous building numbers. However, environmental impact could be assessed based on a set of building physical characteristics and energy consumption, presenting unique building archetypes. The archetype building models were generated using existing buildings in the two datasets mentioned in Building Stock Dataset Creation section, which include buildings with relatively similar characteristics, representing the existing building stock in Chicago. In order to construct the archetypes, the combination of structure type, foundation type, wall type, and roof type was added to the created building stock dataset.
As listed in , Archetypes were described following the naming convention A-B-CC-DD, whereby A describes the building structure type (Wood, Masonry, Manufactured, Steel), B represents the foundation type (e.g. Crawl, Basemen), CC represents the exterior wall materials (e.g. wood, Masonry), and DD is the roof construction types (R1-R6). All archetypes were created as 92 square meters/1000 square feet (12 meters by 7.6 meters), one-floor height. Using the primary structure options, exterior wall materials, foundation types, and roof types, this study generated 157 archetypes representing over 1 million buildings in Chicago. These 157 archetypes were created using the existing buildings in Chicago meaning there were 157 different combinations of primary structure type, foundation type, exterior wall type, and roof types. Therefore, in the created dataset, each building was assigned an Archetype Code. For example, the code “WBW2R1” represents a building with a wooden structure (W), basement foundation (B), wall type 2 (W2), and roof type 1 (R1); “MCW1R3” represents a building with a masonry structure (M), crawl foundation (C), wall type 1 (W1), and roof type 3 (R3). The electrical and mechanical equipment and interior design materials impact were not in the scope of this research.
Table 2. Archetype variables in building segments.
Assess life cycle embodied carbon emission and environmental impact
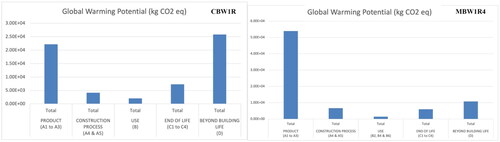
A two-step process was used to obtain the entire building stock LCEC and environmental impacts in Chicago. In the first step, the LCEC and five environmental impact indicators of individual archetypes were calculated using Athena Impact Estimator version 5 (comply with both EN15804 and 15978). To achieve this, each of the 157 archetypes was modeled in the Athena as a single-floor 1000 SQF building. For example, an MBW1R4 archetype was modeled as a single-story 1000 SQF building with a masonry structure, basement foundation, wooden exterior wall material, and shake roof type, as mentioned in . This resulted in a dataset of LCEC including three indicators: the Biogenic Global Warming Potential (GWP), Calcination GWP, and Total GWP. Five impact environmental impact indicators are explained in Embodied Carbon and Environment Impact Indicators section. In addition, embodied energy was also calculated and measured by primary energy use for each of the archetypes. This forms a dataset for the expected emissions per area unit for each of the archetypes which were later used to calculate the building emissions for each individual building in Chicago by multiplying these values with the building’s area and number of floors. Archetype life cycle embodied carbon ranges from 123.79 kgCO2e/m2 (11.5 kgCO2e/ft2) for WBW2R1 to 950.45 kgCO2e/m2 (88.3 kgCO2e/ft2) for SSW1R2. shows one example of embodied carbon assessed through the whole life cycle archetype CBW1R1 with 661.98 kgCO2e/m2 and MBW1R4 with 846.04 kgCO2e/m2.
Figure 2. Life cycle embodied carbon archetype (a) CBW1R1. (b) MBW1R4.
In the second step, the archetypes were assigned to each individual building in the Chicago datasets created for this study (refer to Building Stock Dataset Creation section). The created dataset of the building inventory includes the archetype code of each building, its year built, floor area, and number of floors. As explained earlier, the Athena models were considered for a 1000 SQF 1-floor building. Therefore, the value generated by the Athena can be divided by 1000 to produce each archetype environmental emission per square footage for one floor. Accordingly, EquationEq. (1)Equation 1
Equation 1 was used to calculate the emission of each of the buildings where the archetype emission in each of the emissions. In this equation, the building area is in units of square footage, and the number of floors is an integer number.
Equation 1
Equation 1
Visualization and analysis
After creating the dataset, Python programming was utilized to analyze the data and determine the significance of emissions for each building archetype. This analysis served as the foundation for developing a sensitivity analysis model and a dashboard for 3-dimensional visualization of the emissions. From a life-cycle assessment (LCA) perspective, the age of a building creates various scenarios that influence its emissions. For instance, buildings undergo demolition, replacement, and renovation once they reach a certain age, which can result in the construction of new buildings that differ in size from the original baseline. To address these changes, scenarios were developed and programmed in Python to assess the impact of these changes on emission levels. EquationEquation (2)Equation 2
Equation 2 was employed to simulate the emissions of new buildings, assuming that the new square footage would range from 80% to 120% of the existing square footage. Additionally, the age threshold was set between 50 to 100 years, with increments of 10 years, guided by findings from the current literature review. The current emissions of the buildings were used as the baseline in the sensitivity analysis.
Equation 2
Equation 2
After calculating the new emission, the changes towards the baseline were calculated based on EquationEq. (3)Equation 3
Equation 3 . This ratio shows the amount of the change in the total emission compared to the current status of the city’s building stock.
Equation 3
Equation 3
Additionally, the Excel 3D Map tool was employed to visualize and project emissions across Chicago. The coordinates in the dataset, representing the longitude and latitude of each building, were used to display the calculated emissions as bars located at each building’s position. The choice of the Excel 3D Map tool was driven by its user-friendly interface, which offers numerous customizable options to filter the visualizations based on building archetypes, age ranges, and emission levels. Moreover, the robust and fast backbone of the Excel 3D Map tool and its real-time connection to the data make it a suitable tool for visualizing such results. It also provides an interactive environment, allowing users to access detailed information about each building simply by hovering over it with the cursor. Furthermore, the tool supports various 2D visualization features, making it an ideal choice for developing a 3D GIS-based dashboard, which was one of the objectives of this research.
Results and discussion
Descriptive analysis
demonstrates the general statistics of the Chicago buildings’ height, area, and year built. In the consolidated dataset of Chicago’s urban infrastructure, a total of 1,010,840 buildings were analyzed which had an average area of 1,819 Sqf mean year built of 1958, delineating 157 unique architectural archetypes.
Table 3. The descriptive statistics of buildings area, height, and age.
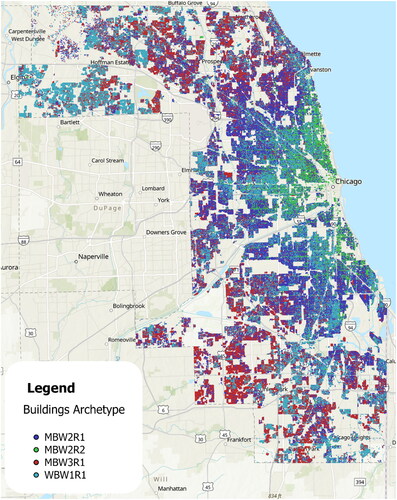
As illustrated in , the predominance of the city’s building composition is attributable to merely three archetypes: "MBW2R1", "WBW1R1", and "MBW3R1", which collectively represent approximately 88% of the total. Specifically, "MBW2R1" typifies 36% of the building stock, characterized by masonry structures with basements and shingle roofs. The "WBW1R1" archetype, accounting for 29%, is distinguished by wooden structural elements, including basements, wood walls, and similarly shingled roofs. The third prominent category, "MBW3R1", constitutes 23%, featuring masonry buildings with basements, walls of mixed masonry and wood, and shingle roofs. These findings highlight a pronounced architectural homogeneity within the city’s vast array of buildings.
Figure 3. The GIS visualization of main archetypes in the Chicago Metropolitan Area.
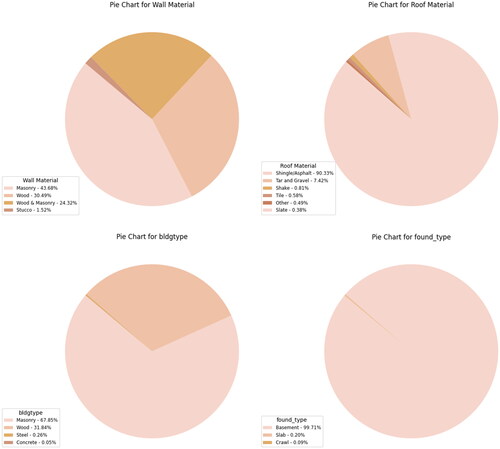
As illustrated in , within the external wall category, masonry walls represent the majority at 43.68%, followed by wooden walls at 30.49%. The combination of wood and masonry accounts for 24.32% of the buildings, while stucco materials comprise only 1.52%. In terms of rooftop materials, over 90% consist of Shingle and Asphalt. The least common roofing material is slate, making up just 0.38% of the total, which equates to approximately 3,840 buildings. Additionally, the results indicate that most buildings are constructed with masonry structures, and more than 99% of the buildings feature basement foundations.
Figure 4. The distribution of the number of buildings with different materials in Chicago.
shows the general statistics of the amount of different emission types in A-C and A-D LCA phases throughout the buildings in Chicago. Phases A–C denotes the amount of emission from the raw material stage to the construction and disposal of the materials while phase D adds the phases beyond the building LCA, including reuse, recovery, recycling, etc.
Table 4. The emissions statistical distribution in Chicago over 1,010,840 buildings.
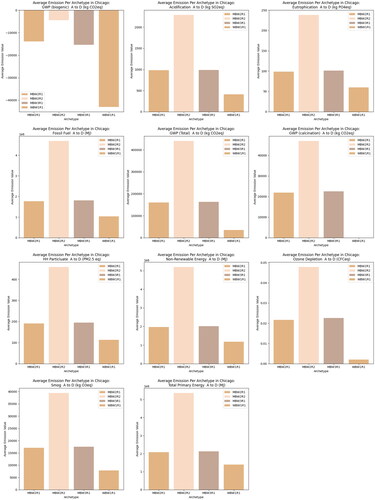
After analyzing the status of 4 main archetype categories in Chicago, the average value of the different emissions for each of these categories was assessed. As demonstrated in , “MBW2R2” average emission is slightly higher than the three other categories. This category comprises masonry structures, basement foundations, masonry walls, and tar and gravel roofs. Meanwhile, the WBW1R1, as the only frequent category with a wooden structure in Chicago has the lowest emission rate.
Figure 5. The total life cycle emission value of each archetype per square foot based on the Athena model.
Although the difference between emissions seems insignificant, the analysis of the emissions in practice and applied to the city scale shows different results. As shown in , the average emission of the buildings with MBW2R2 becomes significantly higher than the other categories in practice. The main difference between this archetype and two other masonry buildings is in the rooftop material.
Figure 6. The average emission for each of the archetypes in the entire city of Chicago.
The last item worthy of mention is the biogenic carbon calculation. EN 15804 is an important regulation that defines the product category rules for building and construction products. In this study, we follow this requirement: in the newest version, EN15804 + A2, long-term biogenic carbon storage is not permitted. All biogenic carbon sequestered in modules A1-A3 must be considered as emitted (or transferred to nature) in module C. Since module C has to be included in life cycle assessment under the new requirement, so any carbon sequestering, bio-based materials are considered to have net zero biogenic carbon over their life cycle. The life cycle carbon emission (A-C) can not go negative under the new requirements.
Sensitivity analysis
Sensitivity analysis in the context of building stock refers to a method used to assess the impact of variations in input parameters on the output of building carbon emission models. This analysis is crucial for understanding the uncertainties associated with building stock models and for improving the accuracy of performance predictions [Citation43]. There are several uncertainties exist in the assessment, mainly related to the assumption made and data used in the calculation. Two primary factors can influence the accuracy and reliability of the assessment results. The first factor is end-of-life uncertainty. Existing LCA databases and methods often lack comprehensive data on the end-of-life treatment and recycling of building materials and components [Citation44]. An end-of-life stage, including recycling and disposal, can have a substantial influence on the environmental impact of a building [Citation45]. The second factor is the building life span, there is no consensus on what value of building life span should be used since it varies per region, building types, and other factors. The building life span found in previous studies varies between 50 years and 100 years, which led to a wide range of GWP results. A sensitivity analysis was conducted to test the impact of the uncertainty associated with total floor area and building life span. A 10-year increment was used for change from the initial assessment, which is 50 years. Five values were used for building life span: 60, 70, 80, 90, and 100 years. The baseline was considered as the current amount of GWP in the A-C phases of the lifecycle and EquationEqs. (2)Equation 2
Equation 2 and Equation(3)
Equation 3
Equation 3 were used to perform the sensitivity analysis.
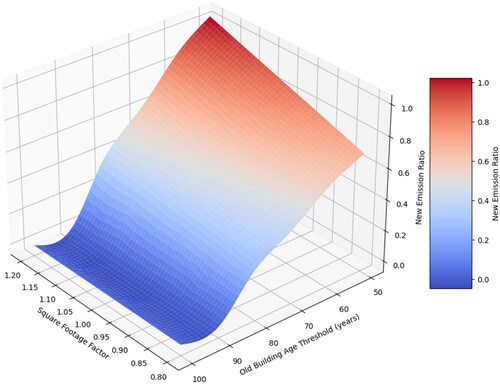
indicates the ratio of the changes compared to the baseline for different areas and building age threshold scenarios and helps to understand how strategic modifications to building footprints and age limits can substantially influence emission outputs. The square footage factor determines the range of change in the buildings’ square footage. Considering the age of the buildings in Chicago, and the fact that the number of buildings more than 90 years old is negligible, the results showed almost no new emission for this range. Nevertheless, the results showed that the policies for the new building area and the age of buildings can significantly impact the new amount of emission. Keeping the buildings up to 80 years and then considering the 80% of the current area for the new buildings had the lowest ratio with 26% of the current emission showing that small modifications can lower future emissions significantly while the age threshold of 50 and 20% increase in the area produced almost the same as existing emission in the whole city with both new and old buildings. This fact is evident in where the higher slopes of emission increase are observed when moving from 100 years threshold to 50 years.
Figure 7. The heatmap of the new emission ratio for different building areas and age thresholds.
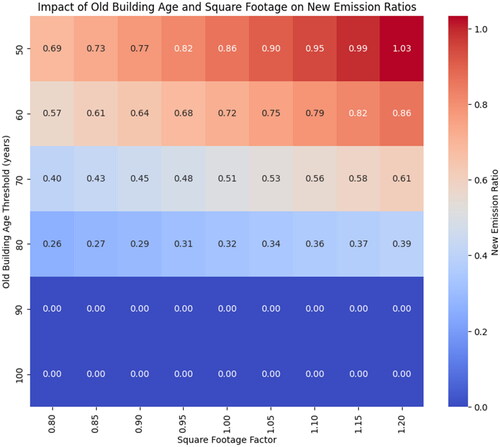
Figure 8. The emission changes sensitivity analysis for different areas and ages 3D visualization.
Visualization
The 3D visualization of the buildings’ emissions transforms our understanding of the geographical distribution of these emissions. After understanding the archetypes and their emission rates, the Excel 3D Map tool was used to visualize the emissions. This powerful visualization, as shown in , offers critical insights that benefit policymakers, urban planners, and environmental researchers by pinpointing the sources and patterns of emissions across different regions. This particular visualization presents data from a significant subset, 10,000 buildings out of more than one million analyzed in the study, and provides more information about the geographical buildings’ emissions as a substantial tool to investigate the root causes of the construction industry’s adverse environmental impacts.
Figure 9. The building emissions visualization for buildings’ total life cycle emission for 10,000 sample buildings (each box in the 3D visualization demonstrates a building in the city of Chicago).
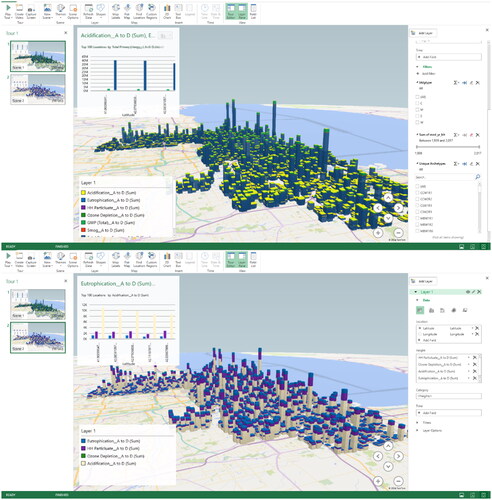
The 3D Map tool not only displays the locations and emission levels but also incorporates a suite of interactive features that allow users to dissect the data further. Users can apply filters to view emissions by building archetype, structural materials, construction year ranges, and more, enhancing the tool’s utility for detailed analysis. The emissions are categorized and color-coded, making it easier to differentiate between types such as CO2, methane, or particulate matter. This differentiation is crucial, as it enables the visualization to adapt to various analytical scenarios for different units and scales of the emissions, ensuring that emission stacks are accurately represented in terms of both magnitude and type. Besides the mentioned features that allow users to customize the data they want to access, the Excel 3D Map Tool provides an extremely user-friendly environment that needs no expertise to modify the variables.
The data revealed intriguing patterns, notably that downtown Chicago—a region dense with high-rise buildings—registered high emission potentials. This was anticipated given the urban density and architectural characteristics. Surprisingly, certain suburban areas, particularly the northwest, also displayed elevated emissions. A deeper dive into the data linked these emissions to specific building types, particularly those with roofing materials categorized under archetypes MBW2R3 and MBW2R4, underscoring the significant impact of construction materials on emission levels.
In addition to geographic and material factors, the visualization highlighted that structures with steel frameworks, though less common in Chicago, contributed disproportionately to the emission totals. This insight, aligned with findings from to , confirms the substantial role of building materials and structural types in environmental impact. Overall, this advanced visualization tool does more than merely map emissions; it provides a multi-dimensional exploration of environmental data, empowering stakeholders to make informed decisions and target interventions more effectively. Additionally, the size and selection of the subsample can be changed according to the users’ demands.
Contribution
This study contributes to the existing literature in the following three aspects. First, at the methodology level, this study creates a framework to measure the existing building stock’s embodied carbon in the city of Chicago, such framework and methodology can be applied to other cities that have similar building characteristic information. Secondly, for the building-level data at the urban scale, the individual buildings with geolocation have been identified, modeled, and assessed. Such detailed and geo-accurate embodied carbon data is a tremendous asset for urban planners, policymakers, and researchers who are interested in advancing the understanding of built environment embodied carbon mitigation. Lastly, the descriptive analysis provides benchmarks for assessing the future building’s embodied carbon performance, and the data visualization provides the general public information regarding the existing urban embodied carbon and future changes. By dissecting the emission profiles of Chicago’s building stock, the study contributes to a growing body of knowledge aimed at fostering resilient, low-carbon urban environments.
Limitation
While this research establishes a comprehensive framework for constructing a detailed inventory of buildings and calculating their emissions using a bottom-up approach, it does have some limitations. Firstly, the study is geographically constrained to the Chicago metropolitan area, which may limit its generalizability to other regions. Additionally, there are constraints related to the availability of detailed data on building envelopes and roofing materials. The data for Chicago categorizes building wall materials into four categories, which may not adequately represent the actual diversity of materials used.
Furthermore, the absence of a unified dataset necessitates the merging of various datasets, leading to the exclusion of numerous buildings from the study. Although these limitations affect the number of archetypes analyzed, they do not compromise the methodological integrity of the research. Despite the significant prevalence of several archetypes, the overall impact of these limitations on the findings is minimal. Looking ahead, future research could leverage data extraction technologies such as Google Street View and satellite imagery, combined with computer vision models, to develop a more generalized model capable of extracting data for cities beyond Chicago, thereby extending the applicability of this study.
In addition to the previously discussed limitations, this study also faces constraints due to its underlying assumptions. Specifically, the emissions resulting from the renovation of buildings to maintain their usability as they age were not included in sensitivity analysis results since it was not in the scope of this research. Consequently, it is recommended that future studies undertake detailed simulations to assess the impact of various renovation and replacement scenarios on urban emission levels.
Conclusion
This research aimed to investigate the building stock emissions in the United States. It utilized the city of Chicago as the study platform. The objectives of this study were to (1) develop a methodology for extending the emission databases to individual buildings in North America, (2) investigate the most frequent archetypes and their emission levels, and (3) visualize the results geographically and explain the emission status of Chicago. To achieve these objectives, the study chose the Athena Impact Estimator Software as the emission estimator database and used the National Structure Inventory and Cook County Open Data as the datasets to gather the buildings’ characteristics. A bottom-top physical-based archetype approach was used to model different emissions for Chicago.
The results demonstrated that although 157 archetypes existed in Chicago, more than 90% of them were distributed through four archetypes. Furthermore, the analyses showed that although the archetypes might seem not to be remarkably different at first glance, the differences between the emissions make substantial differences in the practice and can influence the emission level of the buildings significantly. Furthermore, the roof material proved to be a very influential factor in the emission level of the buildings. Moreover, the wood material was associated with the lowest emission rate while the steel structure was associated with the highest ones.
The 3-dimensional visualization showed that the emission hotspots might be different as it is expected in the cities. For instance, the northwest side of the Chicago emission was even greater than some of the buildings in the downtown area. The observation of the data in this area showed that the high-emission archetypes were constructed with different roof types. The results of this study not only provided a systematic framework for building emission but also emphasized on the importance of developing a suitable platform for visualizing and demonstrating the emission results for better understanding and decision-making. The results of this study are useful for policymakers, urban planners, architects, and environmental researchers. Future studies are suggested to concentrate on utilizing the power of advanced methods such as computer vision to collect the required data such as wall and roof material. Future research can also concentrate on expanding this methodology to other cities at other zones and climate conditions for better comparison.
Acknowledgements
We thank Zachary Dooner and Carter Powers for their contributions to data collection. We also thank all faculty, staff, and students in the School of Architecture and Department of Civil and Environmental Engineering and Earth Science at the University of Notre Dame for their support of this project.
Disclosure statement
No potential conflict of interest was reported by the author(s).
Data availability statement
The data that support the findings of this study are available on request from the corresponding author, MH. The data are not publicly available because they contain information that could compromise the privacy of building owners.
Additional information
Funding
References
- Hamiltton I, Rapf O, Kockat D, et al. 2021 global status report for buildings and construction. 2021. https://www.unep.org/resources/report/2021-global-status-report-buildings-and-construction.
- Hu M. A building life-cycle embodied performance index—the relationship between embodied energy, embodied carbon and environmental impact. Energies. 2020;13(8):1905. doi:10.3390/en13081905.
- Hu M, Esram NW. The status of embodied carbon in building practice and research in the United States: a systematic investigation. Sustainability. 2021;13(23):12961. doi:10.3390/su132312961.
- Chen W, Yang S, Zhang X, et al. Embodied energy and carbon emissions of building materials in China. Build Environ. 2022;207:108434. doi:10.1016/j.buildenv.2021.108434.
- Stephan A, Crawford RH. A comprehensive life cycle water analysis framework for residential buildings. Build Res Inform. 2014;42(6):685–695. doi:10.1080/09613218.2014.921764.
- Vilches A, Garcia-Martinez A, Sanchez-Montañes B. Life cycle assessment (LCA) of building refurbishment: a literature review. Energy Build. 2017;135:286–301. doi:10.1016/j.enbuild.2016.11.042.
- Wu P, Xia B, Zhao X. The importance of use and end-of-life phases to the life cycle greenhouse gas (GHG) emissions of concrete – a review. Renew Sustain Energy Rev. 2014;37:360–369. doi:10.1016/j.rser.2014.04.070.
- Kumari LMT, Kulatunga U, Madusanka N, et al. Embodied carbon reduction strategies for buildings. In: Dissanayake R, Mendis P, editors. ICSBE 2018, vol. 44. Singapore: Springer Singapore; 2020; p. 295–308.
- Wang J, Wei J, Zhang W, et al. High-resolution temporal and spatial evolution of carbon emissions from building operations in Beijing. J Clean Prod. 2022;376:134272. doi:10.1016/j.jclepro.2022.134272.
- Gately CK, Hutyra LR. Large uncertainties in urban‐scale carbon emissions. JGR Atmos. 2017;122(20):11,242–11,260. doi:10.1002/2017JD027359.
- Huang C, Zhuang Q, Meng X, et al. A fine spatial resolution modeling of urban carbon emissions: a case study of Shanghai, China. Sci Rep. 2022;12(1):9255. doi:10.1038/s41598-022-13487-5.
- Liu Z, Cai B. High-resolution carbon emissions data for Chinese cities. In: Belfer center for science and international affairs. Cambridge, Mass: Harvard University; 2018.
- Chuai X, Feng J. High resolution carbon emissions simulation and spatial heterogeneity analysis based on big data in Nanjing City, China. Sci Total Environ. 2019;686:828–837. doi:10.1016/j.scitotenv.2019.05.138.
- Zhang N, Luo Z, Liu Y, et al. Towards low-carbon cities through building-stock-level carbon emission analysis: a calculating and mapping method. Sustain Cit Soc. 2022;78:103633. doi:10.1016/j.scs.2021.103633.
- Lim H, Zhai ZJ. Review on stochastic modeling methods for building stock energy prediction. Build Simul. 2017;10(5):607–624. doi:10.1007/s12273-017-0383-y.
- Hu M, Ghorbany S. Building stock models for embodied carbon emissions—a review of a nascent field. Sustainability (Switzerland). 2024;16(5):2089. doi:10.3390/su16052089.
- Arehart JH, Pomponi F, D'Amico B, et al. Structural material demand and associated embodied carbon emissions of the United States building stock: 2020–2100. Resour Conserv Recycl. 2022;186:106583. doi:10.1016/j.resconrec.2022.106583.
- Ghione F, Mæland S, Meslem A, et al. Building stock classification using machine learning: a case study for Oslo, Norway. Front Earth Sci. 2022;10:886145. doi:10.3389/feart.2022.886145.
- Yamaguchi Y, Kim B, Kitamura T, et al. Building stock energy modeling considering building system composition and long-term change for climate change mitigation of commercial building stocks. Appl Energy. 2022;306:117907. doi:10.1016/j.apenergy.2021.117907.
- Nägeli C, Jakob M, Catenazzi G, et al. Towards agent-based building stock modeling: bottom-up modeling of long-term stock dynamics affecting the energy and climate impact of building stocks. Energy Build. 2020;211:109763. doi:10.1016/j.enbuild.2020.109763.
- Lanau M, Liu G. Developing an urban resource cadaster for circular economy: a case of Odense, Denmark. Environ Sci Technol. 2020;54(7):4675–4685. doi:10.1021/acs.est.9b07749.
- Österbring M, Mata É, Thuvander L, et al. A differentiated description of building-stocks for a georeferenced urban bottom-up building-stock model. Energy Build. 2016;120:78–84. doi:10.1016/j.enbuild.2016.03.060.
- Tanikawa H, Hashimoto S. Urban stock over time: spatial material stock analysis using 4d-GIS. Build Res Inform. 2009;37(5-6):483–502. doi:10.1080/09613210903169394.
- Gao XL, Hu TJ, Peng P. Research on the simulation and realization approach of urban low-carbon transport. AMR. 2014;989–994:1328–1332. doi:10.4028/www.scientific.net/AMR.989-994.1328.
- Wu H, Zhao X. Carbon emission early warning system modeling and simulation study of urban regional transportation. IJSH. 2016;10(8):271–280. doi:10.14257/ijsh.2016.10.8.26.
- Li Z, Deng G-Q. Simulation of urban carbon emission model based on big data fusion machine learning algorithm. In: Proceedings of the 2023 4th International Conference on Computing, Networks and Internet of Things. New York, NY, USA: ACM; 2023; p. 235–239. doi:10.1145/3603781.3603821.
- Wang Z, Zeng J, Chen W. Impact of urban expansion on carbon storage under multi-scenario simulations in Wuhan, China. Environ Sci Pollut Res Int. 2022;29(30):45507–45526. doi:10.1007/s11356-022-19146-6.
- Hu X, Li Z, Cai Y, et al. Urban construction land demand prediction and spatial pattern simulation under carbon peak and neutrality goals: a case study of Guangzhou, China. J Geogr Sci. 2022;32(11):2251–2270. doi:10.1007/s11442-022-2046-x.
- Tian Y, Zhao X. Simulation of construction land expansion and carbon emission response analysis of Changsha-Zhuzhou-Xiangtan Urban Agglomeration based on Markov-PLUS model. Shengtai Xuebao. 2024;44:129–142.
- Wu A-B, Chen F-G, Zhao Y-X, et al. Multi-scenario simulation of construction land expansion and its impact on ecosystem carbon storage in Beijing-Tianjin-Hebei urban agglomeration. Huan Jing Ke Xue. 2024;45(5):2828–2839. doi:10.13227/j.hjkx.202305221.
- Li X, Liu Z, Li S, et al. Urban land carbon emission and carbon emission intensity prediction based on patch-generating land use simulation model and grid with multiple scenarios in Tianjin. Land. 2023;12(12):2160. doi:10.3390/land12122160.
- Zhu W, Feng W, Li X, et al. Analysis of the embodied carbon dioxide in the building sector: a case of China. J Clean Prod. 2020;269:122438. doi:10.1016/j.jclepro.2020.122438.
- O'Hegarty R, Kinnane O. Whole life carbon quantification of the built environment: case study Ireland. Build Environ. 2022;226:109730. doi:10.1016/j.buildenv.2022.109730.
- Drewniok MP, Dunant CF, Allwood JM, et al. Modelling the embodied carbon cost of UK domestic building construction: today to 2050. Ecol Econ. 2023;205:107725. doi:10.1016/j.ecolecon.2022.107725.
- Allen C, Oldfield P, Teh SH, et al. Modelling ambitious climate mitigation pathways for Australia’s built environment. Sustain Cit Soc. 2022;77:103554. doi:10.1016/j.scs.2021.103554.
- Zhong X, Hu M, Deetman S, et al. Global greenhouse gas emissions from residential and commercial building materials and mitigation strategies to 2060. Nat Commun. 2021;12(1):6126. doi:10.1038/s41467-021-26212-z.
- Hu M. A look at residential building stock in the United States - mapping life cycle embodied carbon emissions and other environmental impact. Sustain Cit Soc. 2023;89:104333. doi:10.1016/j.scs.2022.104333.
- Chen Z, Gu H, Bergman R, et al. Comparative life-cycle assessment of a high-rise mass timber building with an equivalent reinforced concrete alternative using the Athena impact estimator for buildings. Sustainability. 2020;12(11):4708. doi:10.3390/su12114708.
- NSI. NSI Technical References; 2024 https://www.hec.usace.army.mil/confluence/nsi/technicalreferences/latest.
- Gomez-Azpeitia G, Arvizu V, Arena P. CO2 emission by different building materials for walls: CASE: housing in Colima, Mexico. In: PLEA 2009 - Architecture Energy and the Occupant’s Perspective: Proceedings of the 26th International Conference on Passive and Low Energy Architecture; 2009.
- Ayikoe Tettey UY, Gustavsson L. Primary energy and CO2 emissions implications of different insulation, cladding and frame materials for residential buildings. IOP Conf Ser: earth Environ Sci. 2019;297(1):012020. doi:10.1088/1755-1315/297/1/012020.
- Cook County Assessor’s Office. Assessor residential property characteristics | Cook county open data; 2022.
- Mastrucci A, Pérez-López P, Benetto E, et al. Global sensitivity analysis as a support for the generation of simplified building stock energy models. Energy Build. 2017;149:368–383. doi:10.1016/j.enbuild.2017.05.022.
- Fnais A, Rezgui Y, Petri I, et al. The application of life cycle assessment in buildings: challenges, and directions for future research. Int J Life Cycle Assess. 2022;27(5):627–654. doi:10.1007/s11367-022-02058-5.
- Marsh E, Allen S, Hattam L. Tackling uncertainty in life cycle assessments for the built environment: a review. Build Environ. 2023;231:109941. doi:10.1016/j.buildenv.2022.109941.