
Abstract
The potential long-term impacts and systemic effects of incentives are of great interest to the biofuels industry and decision makers, particularly with regards to forthcoming mandates for biofuels. We have used the Biomass Scenario Model (BSM) to build a theoretical understanding of the role of incentives on the evolution of the biomass-to-biofuels market. It models a broad range of biofuels such as renewable gasoline, diesel, and aviation fuel. In this paper, we focus on cellulosic ethanol as we describe model-based insights into potential incentives that are aimed at stimulating industry growth while tempering overall incentive-related government expenditures. Subsequent research can test the key insights gained through BSM simulations against actual policy implementation and actual outcomes.
Introduction
Regulations, financial incentives, and other public initiatives promote biofuels in the United States. These initiatives have been put in place because biofuels that replace the use of conventional liquid fuels reduce dependence on imported energy as well as greenhouse gas emissions.[Citation1] For example, the established starch ethanol industry in the United States has been promoted through a series of federal- and state-level initiatives, beginning in the 1970s with the Energy Policy Act of 1978. Tyner [Citation2] attributes the extreme growth of the industry that started in 2005 to a fixed ethanol subsidy in combination with a rapidly increasing oil price. Mabee [Citation3] asserts that the incentives put in place for the nascent starch ethanol industry in the major producing states were pivotal to the industry's success; there must be a balance between funds going toward research and development and toward commercialization. Mabee recognizes, though, that the growth of the industry can be slowed due to lack of development in other areas of the biomass-to-biofuels supply chain, namely feedstock supply and biofuel demand. Other articles discuss how policies have enabled the starch ethanol industry to grow in the United States, including how the ban on MTBE was key to industry expansion.[Citation4,Citation5] Finally, state-specific incentives targeted at ethanol production and use have led to greater adoption of ethanol in the Midwest.[Citation6,Citation7]
However, the growth of the starch ethanol industry has given birth to the ‘food versus fuel’ debate, generating concern that higher corn prices have negatively impacted consumers. The Energy Independence and Security Act of 2007 (EISA) further attempted to address the issues of energy independence and ‘food versus fuel’ by mandating 136,275 km3 per year of renewable liquid transportation fuel in the US marketplace by the year 2022, but limiting starch ethanol production to 56,781 km3 per year through the Renewable Fuel Standard (RFS).[Citation8] As a result, much of the current research and development is focused on producing ethanol from cellulosic feedstocks. These feedstocks are advantageous because they do not necessarily compete directly with food production and appear to require fewer inputs (e.g., water, nutrients, and land) in comparison with corn grown for starch ethanol. However, the nascent advanced biofuels industry has struggled to meet the EISA mandates, and the US Environmental Protection Agency (EPA) has continuously decreased the biofuel volumes required.[Citation9]
This paper does not attempt to discuss the merit of increased biofuels usage in terms of social or environmental benefits. Rather, it introduces points of leverage where incentives, in combination, appear to be sufficient to propel the cellulosic ethanol industry forward into a future ‘boom’, not unlike the one involving the starch ethanol industry beginning in 2005. Several studies discuss the potential incentives setting that are essential for biofuel industry development. Tyner [Citation2] proposes a few options for future incentives that could be directed at promoting cellulosic ethanol industry growth: a greenhouse gas (GHG) credit, reverse auctions for biorefineries using cellulosic materials, and tax credits targeting cellulosic-based facilities. A report from the European Union surveys the exiting biofuels industry and relevant initiatives on an international level and asserts that different components need to be in place in order for a mix of incentives to be effective: limit risks for potential investors, standardize the technology, and eliminate the pricing gap between biofuels and conventional fuels.[Citation4]
This article explores the policy environment surrounding cellulosic ethanol and builds upon previous studies by providing improved, full-supply-chain understanding of the points of leverage that could lead to more rapid and sustained industry growth. The analyses detailed herein are based on the Biomass Scenario Model (BSM), a system dynamics model that simulates the complex interactions between incentives and production, thereby providing insights into impact and coordination of incentives across the supply chain. BSM simulation results suggest bottlenecks and points of leverage, and they provide theoretical insight into the incentives most likely to facilitate the industry's development. These insights can guide a subsequent examination of actual policy outcomes and of the industry's progress to date.
Methods: dynamic simulation of the biofuels supply chain
The US Department of Energy (DOE) Bioenergy Technologies Office and the National Renewable Energy Laboratory (NREL) have developed the BSM to investigate the dynamics associated with the potential evolution of a biofuel industry in the United States.[Citation10] The model uses a system dynamics modeling approach, built on the STELLA software platform,[Citation11] to represent the dynamic interactions of the major sectors that comprise the biomass-to-ethanol supply chain: feedstock production and logistics, feedstock conversion, and downstream elements (inventory, dispensing, distribution, fuel use, and vehicle fleet). The BSM tracks the development of the cellulosic ethanol industry over time by representing investment in new technologies, competition from petroleum fuels, vehicle demand for biofuels, and implementation of various government policies. Its intended use is to generate and explore plausible scenarios for the evolution of a biofuels transportation fuel industry in the United States. High-level system models such as the BSM are not designed to provide precise quantitative forecasts. The BSM was designed for: (1) analyzing and evaluating points of impact; (2) generating scenarios; (3) identifying high-impact levers and bottlenecks to system evolution; and (4) instigating focused discussion among policymakers, analysts, and stakeholders. This article focuses on the entire cellulosic ethanol supply chain, as represented by the BSM. Extensive analyses have been performed utilizing the model to address the critical role played by system bottlenecks, gasoline pricing, industrial learning, and financing in development of the cellulosic ethanol industry.[Citation12]
A transition from the current US petroleum-based transportation fuel economy to one that incorporates significant amounts of renewable transportation fuels is characterized and addressed in the BSM as a ‘system-of-systems’ problem. As an established methodology for analyzing the behavior of complex, feedback-rich systems, system dynamics focuses on the relationships between and feedback among parts of a system, and can facilitate investigation of system bottlenecks, analysis of policies, and diagnosis of unintended consequences.[Citation13]
The BSM has been developed as a set of sectors, such that each major component (feedstock supply and logistics, feedstock conversion, and downstream) can be simulated in isolation or in conjunction with other sectors. The feedstock production and logistics sector simulates the production of biomass, as well as other crops, through farmer decision making, land allocation dynamics; new agricultural practices, markets, and prices; and tracking harvesting, collection, storage, preprocessing, and transportation of feedstocks. The feedstock conversion sector has three cellulosic ethanol conversion technologies at four production scales. The ethanol produced during conversion is then distributed throughout the United States in the form of the most common ethanol/gasoline blends of E10 and E85. The sectors in the BSM react to information in a complex, non-linear fashion that depends on, among other things, industrial learning, project economics (e.g., net present value), installed infrastructure, consumer choices, and investment dynamics. The model is geographically stratified using the 10 US Department of Agriculture (USDA) farm production regions,[Citation14] which allows for regional-specific analyses to be performed.
The BSM has been populated with data from recognized sources and calibrated to key output metrics. For instance, the production levels of commodity crops and their prices were calibrated to USDA baseline projections.[Citation14] Through periodic DOE peer reviews,[Citation10,Citation15] formal reviews with industry and academic experts,[Citation16] and interactive meetings with individual specialists, subject matter experts have provided invaluable insights for validating model inputs and simulation results. In addition, external experts have aided in related analyses to corroborate major modeling components utilized in the BSM (e.g., a study on learning curves for implementation into the conversion sector).[Citation17]
In contrast to many simulation approaches in which the underlying simulation model is treated as a black box, we have taken care in designing the BSM to make assumptions transparent to users. For a more detailed discussion of the model structure, its sectors, and their logic and data sources, see Peterson et al., Newes et al., and Lin et al.[Citation17–Citation19]
Results and discussion
The following analyses address issues relevant to the cellulosic ethanol industry, and lists the subset of the BSM intervention options that will be discussed here. For the purposes of this article, ‘industry takeoff’ denotes a sustained increase in cellulosic ethanol production (roughly 3785 km3/year) that can be sustained without subsequent external subsidies. For more technical information on maturity in the BSM, see Vimmerstedt et al. [Citation20]. These incentives are integrated into the BSM, allowing for a wide range of policy-specific analyses (some of which are described below) to be performed.
Table 1. Selected points of intervention studied.
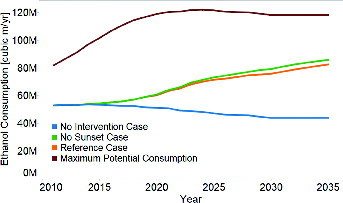
Current experience with the real-world systems and initial analysis of BSM sectors, both in isolation and in a complete-biomass-to-ethanol configuration, indicate that the cellulosic ethanol industry is unlikely to develop without substantial external help throughout the supply chain (see the ‘no intervention case’ in ). While some incentives (e.g., BCAP) appear not to stimulate the industry, a mix of coordinated incentives (e.g., point-of-production and point-of-use incentives) can facilitate earlier initial development of the market, which in turn reduces investor risk, increases yields, and drives down costs, further spurring industry build-out. Furthermore, analysis using the BSM suggests that overly aggressive or poorly targeted incentives can cause industry instability and result in minimal increases in cellulosic ethanol production. Sustainable industry development is likely to require a systematic orchestration of incentives for the disparate actors within the system. In particular, the combination of initiatives for early, sustained industry growth includes a favorable gasoline-to-E85 price spread as perceived by end users; a high level of external investment in dispensing station infrastructure (tankage and related equipment); aggressive initial external investment in pilot, demonstration, and pioneer-scale conversion facilities; and high rates of industry learning.
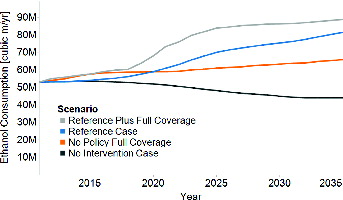
Figure 1. Ethanol consumption under different scenarios from 2010 to 2035.
Overall growth in cellulosic ethanol industry can be constrained by a bottleneck at any point in the supply chain. One important constraint is the blend wall (i.e., limiting ethanol consumption to E10). Current starch ethanol production is being limited by the blend wall, both in a physical sense and that it is limited in the RFS. Without increased utilization of E85, a broader transition to gasoline with 15% ethanol content, additional products that utilize ethanol, or a combination of these strategies, there will be no market for additional ethanol production.
To organize the analysis, it is helpful to conduct tests against a ‘reference incentive case’ in which a mix of incentives stimulates moderate industry takeoff () at moderate total cost (). The reference incentive case was developed through a systematic analysis of points of intervention, alone and in combination. It includes moderately aggressive incentives for ethanol production and a US$132 per m3 gasoline tax but is not optimized to maximize cellulosic ethanol output. Instead, the primary goal in developing the reference scenario is to find a set of plausible incentives that spur industry growth, while costing no more than US$5 billion per year in total incentive outlays.
Figure 2. Variations of the reference policy case, where just one of the policies comprising it is ‘turned off’ with cellulosic ethanol production levels in 2020 and 2035.
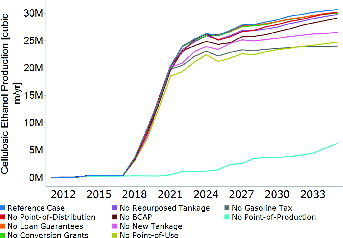
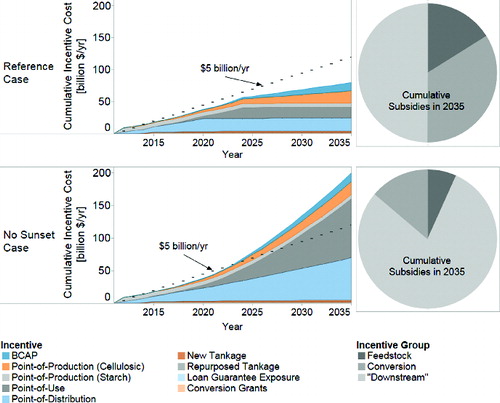
Figure 3. Simulated potential cumulative government spending (relative to 2010) on incentives in the reference case versus no sunset case. ‘Loan guarantee exposure’ does not represent actual spending, but rather the potential cost of defaults of loans guaranteed by the government; ‘downstream’ combines ethanol storage, distribution, and end-use.
The specific incentive/investment configuration of the reference case is shown in . Note that incentives are ‘phased out’ in a staged manner, with the incentives involving grants for capital equipment or loan guarantees eliminated first (in 2021) while the volumetric incentives continue through the simulation. In general, incentives are sequenced such that incentives are phased out once the industry can sustain growth without them. This incentive configuration and these results are not intended to be prescriptive; instead, they form a baseline against which the impact of potentially sensitive data inputs can be studied and ‘on-the-margin’ incentive/investment analyses can be conducted.
Table 2. The ‘reference incentive case’: inputs that produce a moderate, sustained industry takeoff.
illustrates the resulting ethanol consumption in the BSM with and without the reference incentive case. Without the policies in place, the cellulosic ethanol industry does not take off; on the contrary, ethanol consumption actually falls as vehicle fleet efficiency increases. (Note that vehicle fleet and gasoline price forecasts from the Annual Energy Outlook [Citation27] are used in the BSM. The ‘Maximum Potential Consumption’ line represents 100% E85 consumption by all flexible-fuel vehicles and E10 by other gasoline vehicles.)
The increase in ethanol consumption does not occur simply because subsidies force the market to develop. Rather, the implementation of subsidies increases the attractiveness of investing in the cellulosic ethanol industry − either directly (e.g., investing in biorefineries) or indirectly (e.g., planting cellulosic feedstocks). For example, loan guarantees for biorefineries incentivize new construction, which advances industrial learning, thereby reducing the perceived risk of investing in future biorefineries. In addition, as the agricultural system gains familiarity with the production of cellulosic feedstocks, perceived farmer risk will decline, and a greater number will engage in feedstock production.
In constructing the reference case, we also examined the effects of eliminating a range of incentives. shows the effect of removing each of these separately, suggesting that the availability of a point-of-production incentive is an essential component in regard to cellulosic ethanol production. Other components of the reference policy case, particularly the gasoline/carbon tax and point-of-use incentives, are highly influential as well. High-impact components of these parts of the supply chain are outlined in more detail in the following subsections.
Governmental policies promoting investment in biorefineries are vital to stimulating industry learning and accelerating growth
Nascent industries such as cellulosic ethanol are subject to a high level of risks involving large capital investments. Many parameters are uncertain for facilities that have yet to be built on a commercial scale: most importantly, the conversion technology yield, capital costs, and variable costs (including feedstock costs). For investors, these factors translate into risk premiums that are included in their required rate of return calculations for initial investments; they also inhibit the ability for firms to borrow money until the technology is proven. Detailed techno-economic design reports tend to show that early-stage biorefineries do not provide sufficient return on investment to justify financing their construction.[Citation19] Incentives that target participants in the conversion sector can help to mitigate these risk factors by lowering costs and thereby promoting investment in the industry. For example, the point-of-production incentive accrues to producers and supports construction of new biorefineries and increased plant utilization. (Much of this influence, though, is related to the magnitude of the incentive for the 3785 km3 of cellulosic production.)
Some conversion-related incentives do not appear to make a large difference in overall ethanol consumption or in cellulosic ethanol production. In , removing loan guarantees and capital conversion grants for pioneer commercial-scale facilities appears to have little impact on cellulosic ethanol production. Loan guarantees and capital conversion grants are targeted toward building pioneer commercial facilities only and, for the simulation results detailed in this paper, are not available to full commercial-scale facilities, which exhibit significant economies of scale. Since capital costs are very high for initial biorefineries, other policies included in the reference incentive case promote the building of full commercial facilities: the point-of-production incentive is set at a high rate for the first 3785 km3 of cellulosic ethanol production. This per-m3 incentive encourages investment in higher-capacity biorefineries, making conversion grants and loan guarantees unnecessary to incentivize companies to build facilities.
Incentives targeting biorefineries are important for initial industry development; however, their interaction with industrial learning and incentives in other areas of the supply chain is the key to industry takeoff. Different assumed values for rates of learning, in combination with the strength of policies, result in different bottlenecks. If learning occurs too quickly, industry development will be stymied by other constraints, such as feedstock availability or existing E85 tankage. If it is too slow, cumulative experience has a small impact on production cost and the high cost of cellulosic ethanol remains the primary constraint on market growth. For a comprehensive description of how learning is implemented in the BSM, see Peterson et al. [Citation17]
One critical component of the learning curve dynamics in the BSM is the concept of a progress ratio, which affects how rapid increases in cumulative production volumes translate into learning and subsequently, into increases in commercial maturity. (The BSM utilizes a learning-by-doing approach; thus, the progress ratio is defined as the ratio of the gap between the state of the industry after a doubling of experience – typically cumulative years in operation or production – and the current state of the industry.) Smaller progress ratios translate to more attractive capital costs, yields, feedstock throughputs, investor risk premiums, and access to debt financing with doublings in cumulative production. shows BSM simulation results for the reference case with total cellulosic ethanol production at five different values for the progress ratio ranging from 75% (reference case) to 95%. The response of ethanol production to different progress ratios is highly nonlinear; moving from 85% to 80%, for example, has a particularly large impact on simulation results (over 13,249 km3 of additional production by 2025). Certain types of government policies (e.g., ones oriented towards accelerating the rate of industry learning) could nudge industry progress ratios towards lower, more favorable values.
Figure 4. Total ethanol production under progress ratios of 75% to 95%.
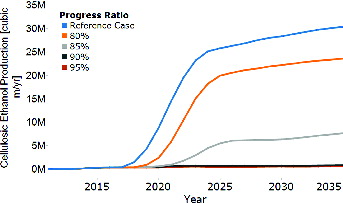
The nonlinear response to changes in the progress ratio in these simulations is the result of layered constraints in the production system for cellulosic ethanol. When the progress ratio is 90%, increases in experience translate into small reductions in costs, and the high cost of cellulosic ethanol remains the primary constraint on market growth. A progress ratio of 85% allows much lower costs to be realized more rapidly, causing production to ramp up quickly. Progress ratios below about 75% cause the system to encounter new constraints that limit market growth: ethanol production is no longer the dominant constraint at lower progress ratios which (although not shown in ) have similar production levels to the 75% progress ratio case. Examples of these constraints include the number of filling stations that have E85 pumps and the supply and price of feedstock. The large increase in ethanol production resulting from low progress ratios causes feedstock prices to rise, which reduces the profitability of investments in new plants.
Finally, with faster rates of learning (as indicated by lower progress ratios), the cellulosic ethanol industry settles into a much lower price regime. In BSM simulations incorporating very slow rates of learning, ethanol prices tend to steadily increase out to 2035 (double their initial value in 2010). The results for decreased learning rates hint at increased price volatility.
Bottlenecks in ethanol distribution and dispensing infrastructure may significantly impede the growth of the cellulosic ethanol industry
The biomass-to-biofuels supply chain involves multiple interdependent sectors, and it is important for the capacities at each sector to grow in sync with one another. Bottlenecks, which result when these capacities are out of sync, may significantly impede the growth of the cellulosic ethanol industry. The BSM has been used to identify three fundamental barriers to large-scale ethanol adoption in the downstream sector. First, the storage and distribution of ethanol requires separate infrastructure from that used for petroleum products. Second, fuel dispensing station owners are required to install specific pumps that can dispense E85. Third, for those vehicles that are E85-capable, consumers need to choose to fill their tanks with E85 rather than more conventional fuels. The BSM captures end-user choice based on a comparison of the energy content per dollar. Ethanol pricing at the point of use appears to be tied to petroleum prices,[Citation28] and unless point-of-distribution prices are very low, the resultant price differential may not be sufficient to drive widespread adoption of ethanol.
The bottleneck that inhibits ethanol storage and distribution can only be overcome by increasing available ethanol-capable infrastructure. To test this hypothesis of supply chain bottlenecks, the fraction of the distribution system (terminals and transport) with ethanol infrastructure and the fraction of refueling stations with ethanol-capable tankage were set to 100%, thus mimicking the situation in which ethanol is a fungible/infrastructure-compatible fuel. In addition, the capital grant incentive for new E85 tankage is of critical importance if the ethanol is available for distribution. Finally, a point-of-distribution incentive encourages consumers to purchase E85. Both of these incentives are included in the reference policy case (see ). indicates that removing these downstream constraints results in substantially more ethanol consumption, either with or without supportive polices. In general, a lack of appropriate downstream incentives could limit the effectiveness of otherwise effective upstream ones, and vice versa. For more detailed analyses dealing with the downstream portion of the BSM, see Vimmerstedt et al.[Citation12]
Figure 5. Effect of removing downstream infrastructure constraints. ‘Full Coverage’ refers to a scenario where all storage terminals and dispensing stations can handle ethanol.
Policies employed in isolation are not as effective as a combination of policies that capitalize on potential system synergies
In the reference case, aggressive initial investment in conversion plants combined with sustained support policies in downstream portions of the ethanol supply chain is an effective policy combination. demonstrates how systemic orchestration of policies at different points in the supply chain can interact to increase cellulosic ethanol production.
Figure 6. Synergistic effect of policies on cellulosic ethanol production.
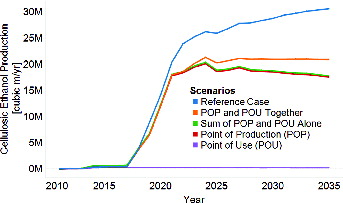
A point-of-use incentive in the downstream sector does little to affect cellulosic ethanol production when implemented in isolation (roughly 227 km3 by 2035) whereas a point-of-production incentive minus the conversion sector increases production substantially (roughly 17,791 m3 by 2035). The sum of production for these two policies when they are implemented in isolation is slightly more than the production when just the point-of-production incentive is in effect. However, when the two polices are applied in combination, the total production is increased by 15% in 2035. With all other policies implemented, the reference incentive case shows an even larger increase in cellulosic ethanol production. This result illustrates a significant advantage of a system dynamics simulation; rather than just summing the results of separate, static, disconnected analyses, system dynamics modeling shows how the different parts of the supply chain can work together to enhance policy outcomes.
Spreading incentives among different sectors of the supply chain helps to orchestrate the balanced growth of capacity at each stage. The interaction between the point-of-use and point-of production incentives provides a good illustration of this dynamic. The point-of-use incentive decreases financial risk for gas station owners, causing more E85 tankage to be installed. The resulting increase in ethanol demand, in conjunction with the point-of-production incentive, decreases the risk for those contemplating investment in biorefineries. This increased confidence results in more biorefineries being built and increased cellulosic ethanol production. Without the elevated ethanol demand, there would be fewer conversion facilities built and the industry would not grow as rapidly.
In addition, subsidizing the feedstock sector does not necessarily equate to additional ethanol consumption. Just as certain policies are necessary for the cellulosic ethanol industry to thrive, policies aimed at feedstock production can be enhanced when coordinated with other downstream policies. Conversely, the expected benefits from policies promoting the feedstock portion of the supply chain for cellulosic ethanol do not necessarily trickle down to the conversion and downstream sectors. On the contrary, some policies aimed at feedstock growers and transporters in the upstream sector can have little impact on other portions of the supply chain due to bottlenecks in the system.
As the cellulosic ethanol industry becomes self-sustaining, additional government spending becomes less effective at spurring additional industry growth
Policies that produce a takeoff in the cellulosic ethanol industry may no longer be necessary once the industry reaches sufficient maturity. For example, the reference policy case is built around a constraint that limits spending to US$5 billion per year. The top portion of shows the cost of each policy of the reference case. If the same values in the reference policy case are taken with no expiration of the policies (‘no sunset case’), the cumulative costs by 2035 would more than double (bottom portion of ).
If policies do not expire, as in the ‘no sunset case’, the total cumulative spending is substantially higher with very little extra ethanol consumption (see ). This result is especially interesting because the majority of the additional funds goes toward the ‘downstream’ (storage, distribution, and end-use) portion of the supply chain. As consumption of ethanol increases, the need for continued per-m3 point-of-use incentives decreases.
Conclusions
Within the set of parameters evaluated, factors other than aggressive policies in the conversion and downstream sectors do not appear to significantly affect cellulosic ethanol production or consumption. BSM simulations suggest that dramatic gasoline price shocks are required to significantly shift the ethanol consumption curve. Ethanol is both a competitor and additive to gasoline, and decision makers utilize information about the absolute and relative prices of each fuel when making choices in the BSM. As such, high gasoline price could play a role in the adoption of E85. Analysis using the BSM reveals that single price shock scenarios, even of great magnitudes and durations, do little to affect the overall ethanol consumption pattern. It is important to note that the BSM does not include any speculative dynamics based on gasoline price volatility. Decision makers in the model are reacting only to current prices and are not formulating hypotheses regarding the direction of gasoline prices, for example, or making investments based on price volatility expectations. The results in this paper have not been tested under alternative price expectation formulations. For further discussion on E85 pricing in the BSM, see Newes et al. [Citation18]
The results in this article suggest that development of the cellulosic ethanol industry will require external assistance, and that multiple points of intervention will facilitate accelerating expansion. In particular:
an initial focus on biorefinery development via point-of-production and investment initiatives can stimulate industrial learning;
supporting/coordinating initiatives aimed at various sectors of the supply chain will be more effective than ‘one-off’ incentives;
dispensing stations represent an important bottleneck to be addressed; and
as the industry develops, it is possible for incentives to sunset such that the industry is self-sustaining.
As the cellulosic ethanol industry grows, policy makers can assess the effects of the present policies and evaluate the real system in terms of existing bottlenecks and the combination of policies that are serving to advance industry growth. While some incentives for ethanol production and ethanol-capable dispensing stations do exist (), they are not generally well coordinated. Models are a powerful tool for learning [Citation29] and can aid in the development of relevant questions, the exploration of scenarios, and the formation of insights in complex systems. The analyses contained in this document should be assessed against actual data as they become available. In addition, there is an opportunity for decision makers to assess the costs versus benefits of these policies, building on the findings of this study.
Acknowledgment
The authors would like to acknowledge the Biomass Scenario Model developers and analysts. Robert Wallace (Booz Allen Hamilton) and John Sheehan (The University of Minnesota) were instrumental in initial model development. Zia Haq, Kristen Johnson, and Alicia Lindauer of the US Department of Energy have supported analyses to shed light on the biofuels system. Dana Stright of Lexidyne LLC was responsible for creating many of the graphics in the report. In addition, the other BSM team members have provided helpful insights, discussions, and reviews: Mark Paich of Lexidyne LLC and Laura Vimmerstedt, Daniel Inman, David Hsu, Yolanda Lin, Ryan Elmore, Andrew Argo, and Amy Schwab of NREL.
Disclosure statement
The authors declare no competing financial interest.
References
- Office of the biomass program, energy efficiency and renewable energy. Multi-Year program plan March 2008. Washington, DC: Taylor & Francis; 2008.
- Tyner WE. The US ethanol and biofuels boom: its origins, current status, and future prospects. Bio Science. 2008;58(7):646–653.
- Mabee WE. Policy options to support biofuel production [Internet]. In: Biofuels. Olsson L, editor. Berlin Heidelberg: Taylor & Francis; 2007. p. 329–357 [cited 2013 Dec 5]. Available from: http://link.springer.com/chapter/10.1007/10_2007_059.
- Pelkmans L, Govaerts L, Kessels K. Inventory of biofuel policy measures and their impact on the market. Belgium: Taylor & Francis; 2008.
- Powers M. King Corn: will the renewable fuel standard eventually end Corn Ethanol's Reign? [Internet]. Rochester, NY: Taylor & Francis; Available from: http://papers.ssrn.com/abstract=2303820.
- U.S. Department of Energy. Ethanol laws and incentives [Internet]. Taylor & Francis; 2014. Available from: http://www.afdc.energy.gov/fuels/laws/3252.
- MacDonald T. Ethanol Fuel Incentives Applied in the U.S. Reviewed from California's Perspective [Internet]. Sacramento, CA: Taylor & Francis; Available from: http://www.energy.ca.gov/reports/2004-02-03_600-04-001.PDF.
- U.S. Congress. Energy Independence and Security Act of 2007 [Internet]. Available from: http://www.gpo.gov/fdsys/pkg/BILLS-110hr6enr/pdf/BILLS-110hr6enr.pdf.
- U.S. Environmental Protection Agency. Renewable fuels: regulations & standards [Internet]. Taylor & Francis; 2013. Available from: http://www.epa.gov/otaq/fuels/renewablefuels/regulations.htm.
- Biomass Program. Analysis platform review report: an independent evaluation of platform activities for FY 2008 and FY 2009 [Internet]. Washington, DC: Taylor & Francis; 2009. Available from: http://www.obpreview2009.govtools.us/review/documents/OBP_ANALYSIS_Platform_Review_Report_EERE_Standard_Cover_(FINAL_V1).pdf.
- isee systems. STELLA: systems thinking for education and research software [Internet]. 2010. Available from: http://www.iseesystems.com/softwares/Education/StellaSoftware.aspx.
- Vimmerstedt L, Bush B, Peterson S. Ethanol distribution, dispensing, and use: analysis of a portion of the biomass-to-biofuels supply chain using system dynamics. PLoS ONE. 2012;7(5).
- Benson T, Doyle J, Draper F, et al. Tracing connections: voices of systems thinkers. Hanover, NH: Taylor & Francis; 2010.
- Interagency Agricultural Projections Committee. USDA agricultural projections to 2016 [Internet]. Taylor & Francis; Available from: http://www.ers.usda.gov/media/197549/oce20071_1_.pdf.
- Biomass Program. Analysis 2011 platform review report: an independent evaluation of platform activities for FY 2010 and FY 2011 [Internet]. Washington, DC: Taylor & Francis; Available from: http://www1.eere.energy.gov/bioenergy/pdfs/2011_analysis_review.pdf.
- Bush B. Biomass-to-Bioenergy Supply-Chain scenario analysis [Internet]. 2013. Available from: https://www2.eere.energy.gov/biomass/peer_review2013/Portal/Analysis/#.
- Peterson S, Newes E, Inman D, et al. An overview of the Biomass Scenario Model [Internet]. Cambridge, MA, 79. 2013. Available from: http://www.systemdynamics.org/conferences/2013/proceed/index.html.
- Newes E, Inman D, Bush B. Understanding the developing cellulosic biofuels industry through dynamic modeling [Internet]. In: Economic effects of biofuel production. Taylor & Francis; 2011. Available from: http://www.intechopen.com/books/economic-effects-of-biofuel-production/understanding-the-developing-cellulosic-biofuels-industry-through-dynamic-modeling.
- Lin Y, Newes E, Bush B, Peterson S, Stright D. Biomass Scenario Model v2.0 documentation: data and references [Internet]. Golden, CO: Taylor & Francis; Available from: http://www.nrel.gov/docs/fy13osti/57831.pdf.
- Vimmerstedt L, Bush B, Hsu D, Inman D, Peterson S. Maturation of biomass-to-biofuels conversion technology pathways for rapid expansion of biofuels production:a system dynamics perspective. Biofuels, Bioprod. Bioref. 2015;9(2): 158–176.
- Commodity Credit Corporation. Biomass crop assistance program; proposed rule. Washington, DC: Taylor & Francis; 2010.
- U.S. Department of Energy. Alternative fuels data center: cellulosic biofuel producer tax credit [Internet]. (2012). Available from: http://www.afdc.energy.gov/laws/law/US/413.
- U.S. Department of Energy. Alternative fuels data center: volumetric ethanol excise tax credit (VEETC) [Internet]. (2012). Available from: http://www.afdc.energy.gov/laws/law/US/399.
- U.S. Department of Energy. Biomass Program: DOE invests $385 million in six cellulosic ethanol projects [Internet]. (2007). Available from: http://www1.eere.energy.gov/biomass/news_detail.html?news_id=10603.
- U.S. Department of Agriculture. USDA Rural Development - Biorefinery Assistance Program [Internet]. (2012). Available from: http://www.rurdev.usda.gov/BCP_Biorefinery.html.
- Renewable Fuels Association. Tax incentives [Internet]. (2012). Available from: http://ethanolrfa.org/pages/tax-incentives.
- Energy Information Administration. Annual Energy Outlook 2010 with projections to 2035 [Internet]. Taylor & Francis Available from: http://www.eia.gov/oiaf/archive/aeo10/pdf/0383%282010%29.pdf.
- Anderson ST. The demand for Ethanol as a gasoline substitute. East Lansing, MI: Taylor & Francis; 2009.
- Sterman JD. Learning from evidence in a complex world. Am J Public Health. 2006;96(3):505–514.