
Abstract
Background: In this work the impact of grinding and chopping on the rheological properties of four switchgrass materials (panicum virgatum) is investigated, comparing physical characterization to previously published feeding performance in bulk equipment in a high-tonnage facility, in which chopped materials exhibited dramatically better handling performance than corresponding ground materials. Results: Physical characterization included sieve analysis, automated digital image analysis of particle size and shape distributions, microscopy of particle microstructure, shear tests using two different sizes of ring shear testers, flow tests in a custom hopper with an adjustable outlet, and uniaxial compression and spring back tests. Shear tests failed to demonstrate consistent statistically significant differences between the shear strengths of the chopped and ground materials subjected to uniaxial compression. However, in laboratory-scale hopper flow tests, the chopped materials exhibited substantially better flow performance than the ground materials, in agreement with the previously published bulk handling tests. Conclusion: Chopped switchgrass materials exhibit substantially better flowability properties in large-scale bulk equipment and in laboratory-scale hopper feeding tests; however, shear tests were not able to reliably predict the flowability properties of bulk switchgrass particles, likely because uniaxial-compression shear tests do not capture the effects of compressibility and elasticity in multi-dimensional flow streams.
Introduction
Conversion of biomass into renewable fuels has been the topic of considerable research for many years because of its environmental and geopolitical benefits. The Billion-Ton Update released by the US Departments of Energy (DOE) and Agriculture (USDA) in August 2011 reports that there are more than a billion tons of biomass available annually in the US alone, which could replace approximately 30% of domestic petroleum usage.[Citation1] Approximately one-third of that material could come from perennial energy crops. Supply systems that can quickly and efficiently handle large volumes of feedstock will clearly be needed to deliver such large quantities of biomass. Importantly, it has been estimated that harvesting, transportation, storage, and preprocessing operations contribute up to 50% of feedstock cost at the refinery gate.[Citation2] These handling costs can be reduced by improving handling efficiency throughout the supply system.[Citation2,Citation3] Recent reviews of fast pyrolysis for producing bio-oils,[Citation4] gasification of biomass to produce syn-gas,[Citation5] combustion of biomass,[Citation5] and co-firing biomass with coal,[Citation6,Citation7] as well as the use distillers grains from the production of ethanol from corn,[Citation8] have all reported challenges associated with feeding and handling biomass feedstocks.
Kenney et al. [Citation9] noted that biomass cost-to-value relationships have been a primary driver behind biomass logistics research, development, and demonstration, which has resulted in substantial progress toward improving biomass collection and preprocessing machinery performance and efficiencies,[Citation10,Citation11] reducing material losses,[Citation12,Citation13] and expanding harvesting and storage operational windows.[Citation14] However, as Kenney et al. [Citation9] concluded, the conventional approach of driving down logistics costs can miss opportunities that come from paying closer attention to feedstock quality. Of particular concern for systems that must handle biomass materials are the wide range of moisture contents (25–60%), large particle size distributions depending upon drying and grinding/chipping conditions, low energy densities (8–14 MJ/kg), and low bulk densities (60–100 kg/m3) coupled with fibrous interlocking particles that tend to resist flow. Establishing specifications and ensuring that biomass feedstock materials consistently meet those specifications appears critical for optimizing conversion processes.[Citation15]
Unlike liquids and gases, bulk solid materials can sustain stresses without undergoing significant deformation. The amount of stress that bulk solids can support depends upon their compression and stress history and, unlike liquids and gases, when a bulk solid does flow, the flow pattern is rarely uniform. Another important consideration is that the shear deformation (failure) of bulk solids can exhibit both plastic and elastic behavior. The complexity of the flow behavior of bulk solids make them much more challenging to handle than liquids and gases. Common problems include plugging, segregation, obstructed or limited discharge, erratic flow, sudden uncontrollable flow, and sticking of material to container walls which causes a loss of live storage and can lead to spoilage. In 2000, Merrow [Citation16] reported that bulk solids handling has improved due to years of experience and that industrial plants that handled bulk solids typically operated at 77% of design capacity, compared to 90% for processes that handle liquids or gases. In a perspective on solutions to handle biomass variability, Kenney et al. pointed out that solving biomass feeding problems will likely benefit from material conditioning or reformatting as well equipment optimization.[Citation9]
The primary properties that impact flowability of biomass materials include particle size and shape distribution (including microstructure), cohesive strength/unconfined yield strength, moisture, bulk density, compressibility, elastic recovery, and wall friction. Permeability, which is a measure of the ability of a bulk solid to allow a fluid or a gas such as air to flow internally, is also important for fine powders. Unfortunately, the impacts of these properties on the flow performance of many biomass materials are not well documented in available literature. Jenike developed the first complete methodology for the flow of bulk solids within the framework of hoppers, bins, and feeders in the 1960s and 1970s.[Citation17] His work included test equipment and procedures for measuring the necessary material properties, a theory of bulk solids flow within hoppers and bins, and a procedure to determine the hopper slope and outlet dimensions required for unobstructed gravity flow.
Most bulk solids flow easily when they are well-aerated and can gain considerable strength when they are compacted. For example, bulk solids in fluidized beds exhibit very low shear strengths and flow easily; however, the same bulk solids can be transformed into rigid tablets or pellets by exposing them to extreme compressive stresses. The fact that the strength of bulk solids increases with compressive stress allows them to form an arch when placed inside a hopper. As material is added to the hopper, the normal stress (compressive pressure) increases at the bottom causing the material to become cohesive due to increased internal friction and shear strength. The strength of bulk solids is typically measured using the yield locus concept, which is explained below in terms of flow within a hopper.
As a particle flows downward through a hopper, the pressure to which it is subjected first increases as the height of material above it increases, then decreases as the particle approaches the outlet at the bottom, where the stresses perpendicular to the material surface are essentially zero (i.e., the material is unconfined). During this process, the major and minor principal stresses (pressures), σmajor and σminor, respectively, experienced by the element each proceed through maximum values, which are denoted by σ1 and σ2, respectively. Assuming that the elastic recovery of the material is negligible, the final bulk density ρb of the material is only a function of σ1 and σ2, expressed mathematically as ρb = ρb(σ1,σ2). For this reason σ1 and σ2 are termed consolidation pressures. This relationship is demonstrated in . The pressure–stress (σ–τ) curve that represents failure of the material at a specified bulk density ρb(σ1,σ2) is known as the yield locus. Shear stress values below the yield locus cannot overcome the material's strength and do not result in flow, while shear stress values above the yield locus result in failure and flow of the material, which is a statement of Jenike's famous flow–no flow criteria, which is that flow in a bulk solid occurs if the applied stress at a location exceeds the material's yield strength. The point ‘e’ marks the end of the yield locus. If the material is subjected a pressure beyond point ‘e’, then the maximum consolidation pressures, σ1 and σ2, are increased, resulting in an increase in the bulk density, and a new yield locus, typically higher on the τ axis, must be defined.
Figure 1. Schematic showing typical yield locus and effective yield locus for a material that has been subjected to maximum consolidation pressures σ1 and σ2 (resulting in a steady bulk density ρb, assuming that elastic recovery is negligible).
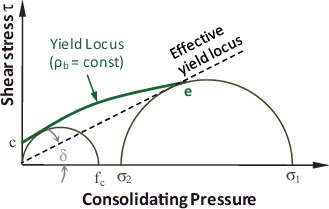
There are other important aspects to note in . First, a Mohr stress semi-circle can be drawn through the point ‘e’ and tangent to the yield locus to determine the maximum major and minor consolidation pressures, σ1 and σ2, which are the intercepts of the Mohr semi-circle with the σ axis (the definition and interpretation of Mohr's circles can be found in strength of materials textbooks, e.g. [Citation18]). Second, the unconfined yield strength fc(σ1,σ2) is also found from the yield locus and is the major principal stress of a bulk material at a free surface, such as a material arch (where the normal force is effectively zero) that results in shear deformation and flow. The quantity fc is located by defining a second, smaller Mohr semi-circle tangent to the yield locus and that also passes through the origin (i.e., the minor stress is zero) as illustrated in
The intercept of the yield locus with the shear stress axis also has a physical interpretation and represents a material's cohesion (consolidation strength with no consolidation pressure as marked by the point ‘c’ in ), which is a measure of the interparticle binding strength. A fourth parameter that can be found from the yield locus is the effective angle of internal friction δ, which is the angle between the σ axis and the line through the origin and the point ‘e’, which is termed the ‘effective yield locus’ and is a measure of the inner friction at steady flow. The effective angle of internal friction δ is very important in the design of hoppers and can be determined by the relation [Citation17](1)
A large number of studies have been conducted on the flowability of powders; [Citation19–21 and references therein] however, far fewer studies have been conducted to determine the flowability of biomass materials. Chevanan et al. [Citation22] measured flowability parameters of chopped switchgrass, wheat straw, and corn stover using a custom-built direct shear tester with a 305 mm x 305 mm square cross-section. They demonstrated that the flow property measurements from the materials, which had geometric mean lengths ranging from 7 to 15 mm were reliable and repeatable. Chopped corn stover exhibited the most difficult handling properties with the highest angle of internal friction, unconfined yield strength, major consolidation strength, and cohesive strength.[Citation19] Wu et al. [Citation23] employed an array of instruments, including a custom-built large annular shear tester to measure the physical and flow properties of different sizes of wood chips, wood pellets, and torrefied wood pellets. They determined that wood chips and torrefied wood pellets had the highest angle of internal friction and effective angle of internal friction.
Guan and Zhang [Citation24] measured the effect of moisture content and compressive stress on the flowability of wheat flour using a custom-built flow hopper and direct shear measurements. They found that increasing moisture content from 8.6% to 14.2% resulted in a 72% increase in cohesion but had little effect upon the effective angle of internal friction. Applied compressive stress increased the required hopper opening for arch-free flow by 50% or more.[Citation21] Fitzpatrick et al. [Citation19] measured the flow properties of 13 food powders and reported that moisture generally made the powders more cohesive; however, high moisture contents appeared to lubricate the flow. Ganesan et al. [Citation25] found that the flowability of distillers dried grains with solubles (DDGS) decreased with increasing moisture content and that adding as much as 2% of calcium carbonate as a flow additive did not significantly improve flow properties. Jensen et al. measured the bridging tendency of wood chips from whole trees, logging residues, and roundwood cut to different particle sizes and shapes and at different moisture contents using an adjustable slot opening and found that most of the variation was due to the fraction of particles longer than 100 mm and moisture content.[Citation26]
Switchgrass (Panicum virgatum L.) has been identified as a potential cellulosic energy crop for biofuel production [Citation27] and, similar to other energy crops, switchgrass poses challenges for harvesting, transportation, storage, and handling. In particular, the low bulk density and poor handling properties of switchgrass prompted the USDOE to award Genera Energy and the University of Tennessee a US$4.9 million grant to develop high-tonnage equipment systems to efficiently supply switchgrass to commercial-scale biofuels facilities, with the unit in Vonore, Tennessee, as an example.[Citation28] Bulk handing operations revealed that the materials prepared with a forage chopper exhibited dramatically better handling properties than materials prepared using a tub grinder.[Citation29,Citation30] This work presents the detailed rheological property characterizations that were conducted on switchgrass materials prepared using different chopping and grinding equipment as part of that project.
Materials and methods
Sample preparation and characterization
Eleven switchgrass materials (Panicum virgatum L.) as summarized in were prepared and tested for handling properties during DOE's high-tonnage switchgrass project led by Genera Energy in 2010–13. All samples were harvested from Color Wheel Farm, Monroe County, TN. Eight samples were prepared using a forest harvester (John Deere 3975 Pull-Type) to cut different theoretical lengths of chop (TLOC) as noted in and three of the samples were prepared with a Vermeer TG500 grinder using different screen sizes. One of the materials (Ch13-dry) was harvested later in the season to obtain a material with lower moisture. Two samples prepared using the forest harvester and two samples prepared using the grinder (marked with dark fill in ) were selected for detailed characterization, although some tests were conducted on all samples. The results of the characterization tests are described below.
Table 1. Switchgrass samples prepared during DOE's high-tonnage switchgrass project led by Genera Energy in 2010–13.
Representative specimens for each test were prepared using a custom rotary splitter that consists of eight bins mounted on a rotating table and a conveyor. The conveyor fed material into the rotating bins to fill each bin with a representative sample. Well over 100 revolutions of the bins were accomplished during each splitting operation to ensure that the samples in all of the bins were as representative as possible of the original sample. A riffle splitter with 25 mm wide riffles was also used to split small quantities of samples with small particles (less than approximately 25 mm in length).
Sieve particle classification
Sieve classification of the materials was performed in duplicate according to ASABE Standard S310.4 using a standard forage separator and a standard Ro-tap separator according to ASAE S319.3. The samples were first sieved using the forage separator and then material captured in the pan of the forage separator was sieved with the Ro-tap separator. Sieves with sizes (in mm) 19, 12.7, 6.3, 3.96, 1.17, 0.85, 0.5, 0.5, 0.212, and 0 mm (pan) were employed for samples Grind-Lg and Grind-Sm. The same sieves were employed for samples Chop-Lg and Chop-Sm except that an additional sieve with a side opening length of 0.6 mm was included between the 0.85 and the 0.50 mm sieves. All reported sieve sizes refer to the side length of the square openings. From the sieve results, the cumulative particle passing distributions (CPDs) and the associated probability density distributions (PDDs), which represent the derivative of the CPDs, were calculated. For all of the analyses, the 50% cumulative passing percentile sieve size, Sieve50, was calculated by interpolation to find the theoretical sieve size (side length of square opening) that corresponds to retaining 50% of the particles by mass. This sieve size corresponds to the 50% height on the CPD. Similarly, the 10% and 90% cumulative passing percentile sieve sizes (Sieve10 and Sieve90, respectively) were also calculated and reported. The geometric mean particle diameter was not calculated according to ASABE Standard S310.4 because the particles are not approximately spherical or cubical and the particle sizes may not be logarithmic-normally distributed.
Coarse particle image analysis (Clemex automated digital image analysis)
The size and shape properties of the switchgrass samples were determined using a Clemex digital image analysis system (Clemex Technologies Inc., QC, Canada) at 48X magnification. Digital image analysis was performed by sparsely sprinkling representative samples onto either a black still background or a black moving conveyor belt, while images were captured by a camera (Clemex L 1.4 C CCD: 1392×1024 pixels) positioned approximately 1 meter above the particles. The particles and the background were separated in the software through a gray threshold. Additional tests demonstrated that test results were not affected by particle orientation or conveyor belt speed. Each set of images was analyzed cumulatively using the following parameters:
Area (A): total area for each object;
Breadth (Br): the measure of the feret perpendicular to length (longest feret);
Aspect ratio (Aspect): ratio of length over width (longest feret to shortest feret);
Feret: distance between two parallel tangents on each side of a particle (analogous to using a caliper) measured at a specific angle with respect to the process frame;
Length (L): longest of 32 ferets measured every 5.625° for each object;
Width (W): shortest of 32 ferets measured every 5.625° for each object;
Hybrid Length (HL): If StrW/W ≥ 0.1, then HL = L, otherwise HL = StrL;
Hybrid Width (HW): (Rule Equation1
(1) ) If StrL/StrW ≥ 10, HW = StrW; (Rule 2) If StrL/StrW < 10 and StrW/W < 0.85, then HL = StrW, otherwise HL = W;
Perimeter (P): sum of all borders belonging to an object interpolated from three points;
Roughness (Rough): ratio of convex perimeter to perimeter; provides a measure of the jaggedness of an object's edges;
Roundness (Round): a shape measure that quantifies the ‘roundness’ of an object's edges; Round = (4·Area)/(π·L·L);
String Width (StrW) and String Length (StrL): Estimates of average length and width of curved particles. StrW and StrL are determined by simultaneously solving the equations: StrW·StrL = A; 2·StrW+2·StrL = P.
The software also allows particles with certain roughness values (ratio of convex perimeter to actual perimeter) to be excluded from the measurement statistics, and this feature was employed to prevent overlapping particles from skewing the measurements. Particles extending outside the digital image were also excluded from analysis. In addition, particles with widths less than 5 camera pixels (approximately 0.4 mm) were also discarded from the analysis. Sieve analysis indicated that particles with diameters less than 0.5 mm represent less than approximately 5% of the total mass of the materials. Similar to the sieve analysis, CPDs and PDDs were determined for primary particle parameters measured by the digital imaging method and were used to estimate 10%, 50%, and 90% cumulative passing values. The tests for each sample material were performed separately three times in order to estimate repeatability. An average number of approximately 36,000 particles were analyzed per sample. Calibration of the digital imaging system and assessment of performance for analyzing pine particles has been published in a prior publication.[Citation31] The calibration and performance for analyzing particles of the switchgrass samples featured in this publication are shown in Supplementary Figures 1–3 and Supplementary Table 1. For the calibration process, 32 representative particles were analyzed for by quantitative visual inspection of calibrated photographs to determine particle widths and lengths. These measurements were then used to develop the Hybrid Width (HW) and Hybrid Length (HL) parameters to extract reliable length and width information of the switchgrass particles from the automated digital image analysis process.
Fine particle image analysis (Keyance digital microscope)
The effect of the cut on the edges of the grass samples was examined using a digital optical microscope (VHX-1000E, KEYENCE Co., Osaka, Japan) at 2500X magnification. Several micrographs were obtained from each set of sample particles.
Shear (unconfined yield strength) tests
Specific shear strength and unconfined yield strength measurements were performed for materials with relatively large and small size particles using an automated Schulze ring shear tester (Dietmar Schulze Schüttgutmesstechnik, Wolfenbüttel, Germany) and a custom-built, large ring shear tester, respectively. Photographs of the ring shear cell are shown in Supplementary Figure 4. Shear tests employing the automated Schulze ring shear tester were conducted in accordance with ASTM D6773-08 using a size M shear cell (outer diameter of 10 cm and inner diameter of 5 cm).
Briefly each test consists of measuring the shear stress in a material as it is subjected to a steady shearing velocity. The material is placed inside a ring-shaped vessel in which the bottom half of the vessel is free to rotate relative to the top half. The upper ring is held fixed while the bottom ring is rotated to shear the sample. As illustrated in Supplementary Figure 4, a weight mounted on a computer-controlled stage is moved to apply downward force to the top ring by means of a hanger. The force on the top ring applies a compressive uni-axial stress to the sample, referred to as the ‘preshear compression stress’ σpre. The lower ring is then rotated relative to the top ring at a rate of approximately 0.1 RPM. As the lower ring begins to rotate, the shear force that is required to hold the top ring in place quickly increases and then reaches a steady state value, known as the ‘preshear shear stress’ τpre. The shear stress is then reduced to zero by stopping and slightly reversing the rotation of the lower ring. The weight on the top ring is then reduced to apply a lesser compressive stress to the sample, referred to as the ‘shear compression stress’ σshear and then the sample is sheared again. The steady state shear stress required to shear the sample under the lesser compressive stress is recorded as the steady state shear stress τshear for the combination of preshear and shear compressive stresses. This process is then repeated three or more times using the same preshear compression stress σpre but different shear compression stresses σshear to obtain a yield locus [Citation32]. Three or more yield locus curves obtained using different values of preshear compression stress σpre are used to construct a flowability curve.
As noted in ASTM D6773-08, the size M shear cell (outer diameter of 10 cm) can be employed to test materials with particles as large as 1 cm. In addition, the large particles can be removed from bulk solids with a significant percentage of fine particles (typically one-third or more of particles by mass that are less than 6 mm in length) without significantly affecting the test results because for these materials the shearing action occurs primarily across the fine particles. Samples Grind-Lg and Grind-Sm, as shown below, consisted of particles that were sufficiently large that shear results obtained using the Schulze ring shear tester may not have been valid. Consequently, a larger, custom shear cell (Supplementary Figure 5) was fabricated. The outer diameter of the large shear tester is approximately 25 cm (2.5 times larger than that of the Schulze ring shear tester) and is considered compatible with particles that are as large as 2.5 cm. The large shear cell was installed inside a universal testing machine (Instron load frame model 5598, Norwood, MA), which supplies the compressive stress for the shear tests. Similar to the Schulze ring shear tester, the larger unit rotates the lower ring at approximately 0.1 RPM while two force transducers apply a measured force to hold the upper ring (the lid) stationary.
The load frame applies a compressive force through a piston, which is equipped with a bearing and ball-joint that allows the lid to rotate in three dimensions around the tip of the piston. The (small) frictional forces inside the bearing and ball-joint can affect the shear forces measured by the force transducers, which is a disadvantage compared to the Schulze ring shear tester. The small frictional forces inside the bearing of the piston are measured in separate experiments by rotating the bearing while a stack of known weights supply axial load. A further difference between the automated Schulze ring shear tester and the custom, large ring shear tester is that the larger unit is not fully automated. The load frame automatically applies and maintains the specified compressive stresses; however, an operator monitors the experiments and determines when steady-state preshear and shear conditions have been met. Subject to the limitations described above, the experiments employing the large ring shear tester were conducted in the same manner as those that employed the automated Schulze ring shear tester.
Hopper flow tests using hopper with adjustable outlet
A plane-flow, V-shaped hopper equipped with an adjustable outlet () was employed to measure the critical arching width of the materials due to each material's self-weight and also when subjected to a compressive force. As illustrated in (d), a stationary liner made of 0.1 mm stainless steel foil is inserted between the sample and the inclined walls. The stationary liner wraps around 50 mm diameter rollers that are fixed to the bottom of the inclined walls. As the walls are slowly raised to widen the outlet at the bottom of the hopper, the stationary liner is held taut, so that the material is not directly affected by the vertical motion of the walls. The outlet at the bottom of the hopper can be opened continuously from fully closed to a maximum width of 0.5 m. The length of the outlet can also be adjusted to a maximum of 1 m in length. For all tests, the length of the outlet was larger than three times the maximum outlet width at the point of material flow to ensure plane flow at the center of the outlet. The slope of the side walls can be adjusted from 10° through 45° from vertical, although for these tests the slope of the side walls was maintained constant at approximately 35° from vertical.
Figure 2. Adjustable-outlet hopper. (a) Top view; (b) end-view; (c) weights positioned on vertical rod; and (d) schematic showing position of weights, rods, material, bottom board and mass scale.
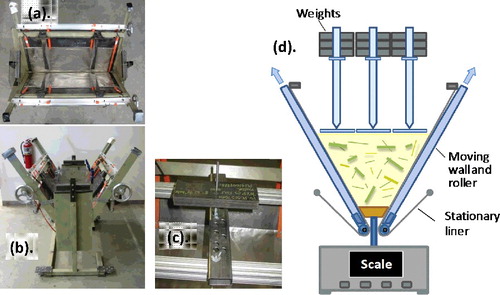
A typical test is conducted by slowly pouring material from a height of approximately 0.6 m. If additional compressive force is desired in addition to the material's self-weight, the hopper is filled in shallow layers of approximately 5 cm, and each layer is compressed by briefly placing a stack of weights of the desired mass (corresponding to either 3 or 5 kPa) on top of each point on the layer's surface before the next layer of material is poured into place. After the hopper is filled to a height of 28 cm from the bottom, the biomass sample is allowed to settle for five minutes. If additional weights are employed in a test, a weight assembly is also placed on top of the biomass and allowed to remain in place for five minutes. The weight assembly consists of stacks of weights positioned on vertical rods that press through flexible joints on plates on the biomass. After five minutes the walls are slowly raised until the arch of material in the bottom of the hopper fails, causing the material to fall out through the opening. The final width of the hopper opening is recorded as the critical arching width of the material for the particular parameters of the experiments, including material moisture, particle size distribution, bulk density, and additional applied weight, if any. Each measurement was repeated three or more times in order to get a statistically valid measurement.
Some tests also employ trapezoidal-shaped boards positioned in the bottom of the hopper. The central board (20.3 cm long) is supported above a scale as featured in (d) so that it is slightly above the hopper walls. By measuring the force on the scale, the vertical compressive stress in the materials at the board's surface can be calculated. The top faces of the boards are 5 cm wide or wider in increments of 5 cm. Once the force on the central board is determined, the hopper walls are slowly raised until the boards drop out of the bottom of the hopper. The hopper walls are then slowly raised further until the arch of material in the bottom of the hopper breaks, and the material flows out the bottom of the hopper, similar to tests that do not employ boards.
Bulk density and compression tests
The bulk densities of the samples were measured by following a modified version of ASTM E 873-82 for densified particulate biomass fuels. The samples were poured into a cylindrical container from a height of 0.6 m above the container's top edge until the height of the material was approximately 66% of the container's diameter. The height of the material was less than that normally used in the ASTM E 873-82 in order to minimize the effects of the walls on subsequent compression tests. The loose bulk density of the sample was estimated by dividing the average sample height as determined by at least five measurements at separate locations by the mass of the sample. To promote settling, the container with the sample was then dropped five times from a height of 0.15 m onto a hard surface. Subsequently, the ‘packed density’ was determined following the density measurement procedure described above.
After the specimens were packed by dropping from a fixed height, the container was loaded into a universal testing machine that had a cylindrical lid attached to its crosshead. The diameter of the lid was slightly smaller than that of the container to minimize potential friction effects between the lid and the container. The universal testing machine was then used to the slowly lower the cylindrical lid to compress the sample while simultaneously measuring the applied uniaxial stress and sample density.
Results and discussion
Coarse particle image analysis and sieve particle classification
Supplementary Figures 6–9 are photographs of representative particles of samples Grind-Lg, Grind-Sm, Chop-Lg, and Chop-Sm as obtained using the Clemex digital imaging system with a 48X magnification lens. The CPDs based upon the Hybrid Width (HW) and sieve size (Sieve) are presented in , and the associated PDDs are shown in Supplementary Figure 10. Supplementary Figure 11 presents the CPDs for particle length for each of the samples featured in . The statistics of the particle size and shape distributions from the image and sieve analyses are summarized in . Supplementary Figure 12 graphically portrays the Hybrid Width and sieve parameter information from
Figure 3. Cumulative particle width distributions (CPDs) for two ground samples and two chopped samples as measured using a Clemex digital image analyzer (cam) and sieve analysis (sieve). Horizontal dashed lines indicate the 10, 50, and 90% cumulative passing percentiles. Hybrid Width (HW) and sieve side width were used as the width parameters for the digital imaging and sieve analyses, respectively. For digital imaging analyses, repeatability bars indicate the standard deviation of three replicates; for sieve analyses repeatability bars indicate the difference between duplicate tests.
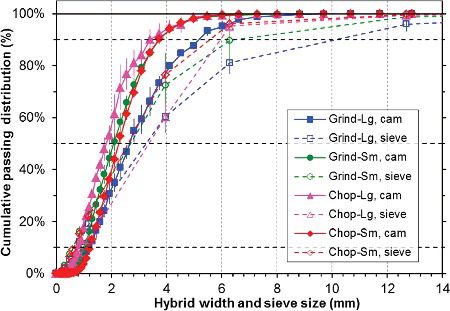
Table 2. Particle size distribution statistics from the image and sieve analyses. Sieve results are the average of two separate measurements. For digital imaging analyses, values in parenthesis indicate the standard deviation of three replicates; for sieve analyses, values in parenthesis indicate the difference between duplicate analyses.
In general, the sieve method reports larger particle widths than the image method, and the deviation between the two methods increases with increasing particle size, as illustrated by the large differences between the Sieve90 and the HW90 results. This is expected because, for large particles with high aspect ratios, the particle separation of the sieve method is strongly affected by particle length in addition to width because long particles can span the sieve opening and prevent them from falling to smaller sieves that more closely match the particle's diameters. From the image method, the 50% cumulative passing percentile for particle width (HW50) for the Grind-Lg and Chop-Lg are both larger than the same values for Grind-Sm and Chop-Sm. The same is true for the 90% and 10% cumulative passing percentiles. The cumulative passing percentile statistics from the sieve analyses exhibit similar trends and indicate that the order from largest to smallest of the samples in terms of particle size is: Grind-Lg, Chop-Lg, Grind-Sm, and Chop-Sm.
Supplementary Figure 13 graphically portrays the image length parameter information from . The results indicate that the lengths of the ground samples are interspersed with the lengths of the chopped samples, such that the ground samples do not exhibit a consistent particle length difference compared to the chopped samples, although Grind-Lg appears to have a higher percentage of long particles compared to the other samples. It is clear from that the ground samples have slightly higher aspect ratios (significantly greater than 3.5 compared to less than 3.2 for the chopped samples), and the roughness of all samples is approximately 0.95.
Fine particle image analysis (Keyance digital microscope)
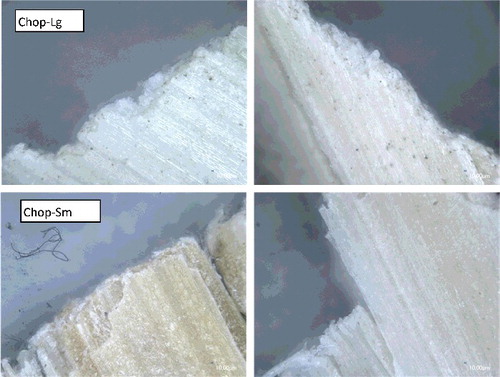
presents representative images obtained from a Keyance digital microscope of particles from samples Grind-Lg and Grind-Sm, while contains digital micrographs of particles from samples Chop-Lg and Chop-Sm. Additional micrographs can be found in Supplementary Figures 14–17. It can be seen that edges of the ground samples are rough and have protruding split-ends compared to the chopped samples, which have relatively smooth edges.
Figure 4. Representative images obtained from a Keyance digital microscope (2500X magnification) of particles from samples Grind-Lg and Grind-Sm (both ground).
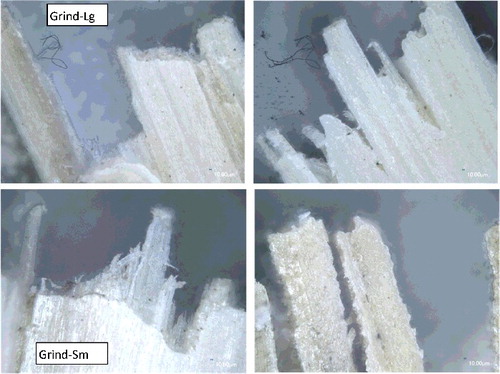
Figure 5. Representative images obtained from a Keyance digital microscope (2500X magnification) of particles from samples Chop-Lg and Chop-Sm (both chopped).
Shear (unconfined yield strength) tests
Shear tests using the Schulze automated ring shear tester (20 cm outer diameter) were conducted using preshear compressive stresses of 0.5, 1.0, and 7.0 kPa, and the resulting yield locus curves are displayed in and Supplementary Figures 18 and 19 (for a discussion of shear testing procedures and data interpretation see [Citation32]). Mohr stress semi-circles are also included in the figures to enable determination of the major principal stresses of the samples during the preshear step and the unconfined yield stresses for the preshear conditions. The large Mohr semi-circles pass through and are tangent to the preshear point and their centers lie on the principal stress axis so that their maximum intersection with the stress axis marks the major principal stress, referred to as σ1. The small Mohr semi-circles are tangent to the yield locus and pass through the origin (which is an unconfined or zero stress condition). The maximum intersection of the small Mohr semi-circles with the stress axis marks the measured unconfined yield stresses, labeled as fc. The unconfined yield stress fc can be difficult to determine for samples that are highly compressible and elastic, resulting in irregularly shaped yield loci curves. The effect is especially pronounced at low compressive stresses for which the effects of compressibility and elasticity are greatest, resulting in a high degree of uncertainty in the determination of fc. An important note regarding is that the shear test for sample Grind-Lg must be viewed with an element of doubt because a large portion of the particles of the sample are too large to allow for accurate tests in the Schulze shear tester. In order to obtain approximate results, particles longer than approximately 80 mm were removed from Grind-Lg by hand (approximately one-quarter of the sample by mass) to obtain the results in . Some of the longer particles of Grind-Sm were also removed, however, less than 10% of the particles were removed by mass, so removing the large particles is not likely to have affected the shear results.[Citation27]
Figure 6. Measured shear stresses at incipient flow as functions of compressive stress for two ground and two chopped samples. Preshear normal stress is 0.5 kPa for all measurements. Data was obtained using an automated Schulze ring shear tester (25.4 cm outer diameter).
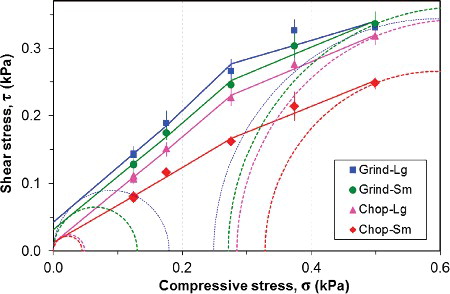
Supplementary Figures 18 and 19 display shear strength data similar to , except the preshear stress for the measurements are 1 kPa and 7 kPa, respectively. The results at higher preshear stress are similar with the shear strengths of Chop-Sm being lower than that of the other samples. In general, the yield locus curves of all of the material follow an approximately linear trend with shear strength increasing with compressive stress and preshear stress.
To verify that the size of the shear cell did not substantially affect the shear results of the samples with large particles, additional shear tests were also performed using a custom-built large shear cell that is approximately 2.5 times the size of the Schulze shear cell. Results from the large shear cell for a preshear compressive stress of 7 kPa are included in Supplementary Figure 19. The results from all four samples at 7 kPa using the large shear tests are very similar, which indicate that the shear strength results are not strongly dependent upon the size of the shear cell. summarizes the rheological properties obtained from shear tests. An important conclusion from these tests is that shear testing using an automated ring shear tester or a larger ring shear tester was not able to definitely demonstrate that the chopped material possess superior flowability characteristics compared to the ground materials as had been observed in bulk handing operations.[Citation30,Citation31] Two significant limitations of uniaxial compression shear testers, including ring shear testers, are that they cannot measure the effect of compressibility and elasticity or the effects of complex multi-dimensional flow patterns, both of which are important for switchgrass particles flowing in bulk equipment. Results described below from hopper flow tests and also compressibility tests provide additional insight into the flow behavior of these materials.
Table 3. Summary of rheological properties obtained from a Schulze automated shear tester and a larger custom-built shear cell. FFC = σ1/fc. NA = Not available (extrapolation of yield locus to shear stress axis resulted in a negative value). Numbers in parenthesis in column 2 (“Sample”) indicate the number of tested samples. Numbers in parenthesis in other columns indicates the standard deviation of the test result.
Hopper flow tests using a hopper with adjustable outlet
displays the results of the hopper flow tests, which measure critical bridging widths of the samples as functions of the measured force on the central board placed at the bottom of the hopper. Applying different amounts of weight on material in the hopper as described previously affected the compressive stress in the material and the vertical force transferred to the boards in the bottom of the hopper. The measured critical arching widths of the ground samples appeared to be independent of the amount of weight applied on the material, while for chopped samples the measured critical arching width increased with increasing weight on the material but was always less than the critical arching widths measured for ground samples. Consequently, there are two important results displayed in . First, the chopped samples flowed through narrower openings than the ground samples, and second, the chopped samples transferred the applied force from the weights at the top of the hopper to the boards at the bottom of the hopper, while the ground samples transferred the force from the weights to the hopper walls above the boards, rather than the boards.Footnote The second result is particularly important because the downward force at the bottom of the hopper provides the driving force to break the arch and cause material to flow. The fact that the ground samples transferred the force from the weights to the hopper walls is a strong indication of poor flowability.
Figure 7. Measured critical arching widths of two ground and two chopped samples as functions of the measured force on the central board placed at the bottom of the hopper. Results from tests without boards are also included as hollow symbols, and for these tests abscissa values were set equal to the average value of similar tests conducted with boards.
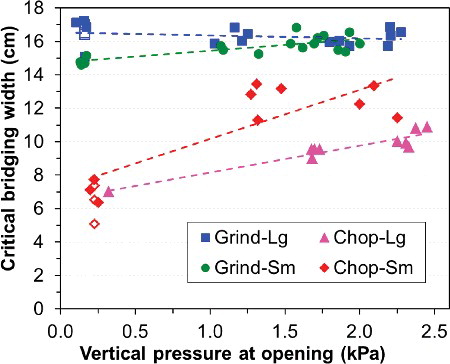
Tests were also performed on Chop-Sm and Grind-Lg without boards and without weights, and those results are shown as hollow symbols in . For plotting purposes, the tests without boards were assigned abscissa values equal to the average value of similar tests conducted with boards. Because similar values of critical arching width were measured with and without boards, it appears that the presence of the boards did not substantially impact the test results. Notably, the results from the hopper tests are in good agreement with observations from bulk handing operations using these materials [Citation30,Citation31] and appear to provide a much better laboratory method to predict flow behavior in automated bulk flow handling equipment. The design of the V-shaped hopper naturally allows the effects of material compressibility and the two-dimensional flow field to be clearly observed in the flow behavior through the adjustable outlet.
A final comment is in order regarding flow tests using the hopper. The critical bridging width is sensitive to particle size, particularly for bridging widths that approach the lengths of the particles, so particle size effects must be considered in interpreting the results of . and Supplementary Figures 11–13 as well as demonstrate that Chop-Sm (chopped) has particle width and length distributions that are intermediate between samples Grind-Lg and Grind-Sm (ground samples), so the difference in flow behavior between the ground and chopped materials is not likely due to strictly particle size effects. It is true, however, that the aspect ratios of the chopped samples is significantly less (approximately 3) than that of the ground samples, which was approximately 4, so that aspect ratio may be partially responsible for differences in the observed flow behaviors. The results from the hopper tests are further augmented by direct measurements of material compressibility presented below.
Bulk density and compression tests
As described in the methods section, samples were loaded into a cylindrical vessel and subjected to monotonically increasing applied stress. Each level of applied stress was maintained a time period between 90 and 360 minutes. Measured stress-time and density-time curves for sample Chop-Lg is shown in Supplementary Figure 20. The sample density for Chop-Lg was calculated at the times indicated by the vertical gray lines to estimate the rate at which the density increased and the time required for further increases of the density to be negligible. Measurements for which the applied stress was applied for 360 minutes indicated that the change in density of the samples was quite slow after 90 minutes of constant applied stress. In fact, in all cases the increase in density after 90 minutes of compression was 95% or more of the total increase in density measured after 360 minutes (compared to the uncompressed state). Consequently, for most of the measurements, the applied stress was maintained constant for only 90 minutes to reduce the amount of time required to complete each full test, which could incur excessive changes in moisture content or instrument operating conditions. The mass of the samples was measured before and after each test, demonstrating that the moisture content of all samples remained at approximately 9% during the tests.
Supplementary Figure 18 and Supplementary Table 2 contain the measured bulk densities of the ground samples and chopped samples as functions of applied compressive stress. The measured bulk density values for all measurements have been prorated to values that would be expected if the applied compressive stress had been applied for 360 minutes. Appropriate prorating factors were determined by fitting the time compression history for the measurements for which the compressive stress was held constant for 360 minutes. The inset in Supplementary Figure 21 shows that in some cases replicated experiments resulted in slightly different measured values, but in all cases, replicated measurements yielded reasonably similar values. Note that sample Grind-Lg, which had the largest particles, exhibited the lowest bulk densities, and that sample Chop-Sm, which had the smallest particles, was the least compressible.
The loose and tapped bulk density measurements are further used to determine Carr's compressibility index, which is defined as the percent change in bulk volume (or density) upon tapping. In poorly flowing materials, there are frequently large interparticle interactions leading to a greater difference between the loose and tapped densities. A Carr's index of less than 15% generally indicates a freely flowing material. A compressibility index was also calculated based on the percent change of volume from the tapped condition to the condition compressed to 7 kPa. The calculated values of Carr's index and the compressibility index are tabulated in Supplementary Table 2. Based upon the compressibility Carr's index, the chopped samples are much less compressible than ground samples. Similar to the results from the hopper tests, the compressibility results are in good agreement with observations from bulk handing operations using these materials. Comparing the compressibility index to the Carr's index indicates that materials with compressibility index values greater than 15% would be expected to exhibit greater flow challenges than materials with lower compressibility indices. Another consideration is that in order to employ the compressibility index as a flow metric, the compressive stresses in the compressed and relaxed states during the laboratory tests should be similar to those experienced by the materials in the bulk handling systems. The actual compressive stresses in the bulk tests [Citation30,Citation31] were likely greater than the 7 kPa employed in compressibility tests, so the compressibility indices of the materials in the bulk handling systems may have actually been greater than the values indicated in Supplementary Table 2.
Future perspective
Starting from the Jenike shear testers in the 1970s, shear testing has been the definitive approach to assess and predict the flowability performance of bulk powders in hoppers, bins, and feeders. However, uniaxial-compression shear testers are not always able to adequately assess the effects of compressibility and elasticity of many biomass materials, which often have relatively large, irregularly shaped particles that may interlock, resulting in multi-dimensional flow phenomena. Handling and feeding performance of a wide range of feedstocks is important to the developing biofuels industry because handling and feeding behavior directly impact biorefinery performance. Most plants today that handle bulk solids only handle a limited number of materials with similar rheological properties; however, in order to meet quantity and cost targets, future biorefineries will likely need to accept woody, herbaceous, and waste materials with wide range of feeding and handling behaviors. Consequently, new, improved methods will be needed to reliably assess and control the feeding and handling properties of different biomass feedstock materials. In this effort, understanding how supply chain operations, including comminution, handling, and storage, impact material properties will be key in optimizing the production of large quantities of biofuels from raw biomass feedstocks.
Supplemental data and research materials
Supplemental data for this article can be accessed at http://dx.doi.org/10.1080/17597269.2015.1091189.
Westover-etal_2015_Biofuels__Supplementary-Figs.pptx
Download MS Power Point (13.8 MB)Supplementary Tables
Download MS Word (27.1 KB)Acknowledgements
This manuscript has been authored by Battelle Energy Alliance, LLC under Contract No. EE0001034 with the US Department of Energy. The United States Government retains and the publisher, by accepting the article for publication, acknowledges that the United States Government retains a nonexclusive, paid-up, irrevocable, world-wide license to publish or reproduce the published form of this manuscript, or allow others to do so, for United States Government purposes. Collin Dickson (Brigham Young University-Idaho) and Philip Petersen (University of Idaho) assisted in splitting the samples and performed many of the hopper and shear tests.
Disclosure statement
No potential conflict of interest was reported by the authors.
Notes
1. The second conclusion is not stated clearly and is not obvious from the results in . As material is loaded into the hopper and compressed layer by layer as explained above, the stress field is primarily vertical, such that the vertical force on the boards at the bottom of the hopper increases in a similar manner for the chopped and ground samples. However, as the walls are raised and lower levels of material exit the hopper, a radial stress field develops in the upper levels of material to support an arch. indicates that the ground materials are more successful in transferring the vertical force to the walls to support the arch than are the chopped materials.
References
- U.S. Department of Energy. U.S. Billion-Ton Update: Biomass Supply for a Bioenergy and Bioproducts Industry. R.D. Perlack and B.J. Stokes (Leads), ORNL/TM-2011/224. 2011. Oak Ridge National Laboratory, Oak Ridge, TN. 227.
- Hess JR, Wright CT, Kenney KL. Cellulosic biomass feedstocks and logistics for ethanol production. Biofuels. Bioprod. Bioref. 2007;1(3):181–190.
- DOE (U.S. Department of Energy). Roadmap for Agriculture Biomass Feedstock Supply in the United States. DOE/NE-ID-11129. U.S. Department of Energy, Washington DC, USA: November 2003.
- Carpenter D, Westover TL, Czernik S, et al. Biomass Feedstocks for Renewable Fuel Production: A review of the impacts of feedstock and pretreatments on the yield and product distribution of fast pyrolysis bio-oils and vapors. Green Chem. Adv. Art. 2015; 16(2):384–406. DOI: 10.1039/C3GC41631C.
- Dia J. Biomass granular feeding for gasification and combustion [Ph.D. Thesis]. Vancouver, BC, Canada; 2007.
- Tumuluru JS, Hess JR, Boardman RD, et al. Review: formulation, pretreatment, and densification options to improve biomass specifications for co-firing high percentages with coal, Ind. Biotechnol. 2012;8(3):113–132.
- Dia J, Sokhansanj S, Grace JR, et al. Overview and some issues related to co-firing biomass and coal. Can. J. Chem. Eng. 2008;86:367–386.
- Ganesan V. Rosentrater KA. Muthukmarappan K. Flowability and handling characteristics of bulk solids and powders – a review with implications for DDGS. Biosyst. Eng. 2008;101:425–435.
- Kenney KL, Smith WA, Gresham GL, et al. Understanding biomass feedstock variability. Biofuels. 2013;4:111–127.
- Shinners KJ, Binversie BN. Whole-plant corn harvesting for biomass: comparison of single-pass and multiple-pass harvest systems. Presented at: The ASABE Annual Meeting. Las Vegas, NV, USA, 27–30 July 2003.
- Yancey NA, Wright CT, Conner CC, et al. Preprocessing moist lignocellulosic biomass for biorefinery feedstocks. Presented at: The ASABE Annual Meeting; 2009 July 27–30; Las Vegas, NV, USA.
- Darr MJ, Shah A. Biomass storage: an update on industrial solutions for baled biomass feedstocks. Biofuels. 2012;3(3):321–332.
- Shinners KJ, Binversie BN, Muck RE, et al. Comparison of wet and dry corn stover harvest and storage. Biomass Bioenerg. 2007;31(4):211–221.
- Shinners KJ, Boettcher GC, Muck RE, et al. Harvest and storage of two perennial grasses as biomass feedstocks. Trans. ASABE 2010;53(2):359–370.
- Sokhansanj S, Mani S, Turhollow A, et al. Large-scale production, harvest and transport of switchgrass (Panicum virgatum L.)—current technology and visioning a mature technology. Biofuels, Bioprod. Bioref. 2009;3:124–141.
- Merrow EW. Problems and progress in particle processing. Chem. Innov. January, 2000;30(1):35–41.
- Jenike AW. Storage and flow of solids. Salt Lake City, Utah: University of Utah Bulletin Number 123; 1964.
- Gere JM, Goodno MJ. Mechanics of Materials 8th ed. Stanford, CT, USA: Cengage Learning; 2013.
- Calvert F, Ghadiri M, Dyson M, et al. The flowability and aerodynamic dispersion of cohesive powders. Powder Technol. 2013;240:88–94.
- Fitzpatrick JJ, Barringer SA, Iqbal T. Flow property measurement of food powders and sensitivity of Jenike's hopper design methodology to the measured values. J. Food Eng. 2004;61:399–405.
- Opaliński I, Chutkowski M, Stasiak M. Characterizing moist food-powder flowability using a Jenike shear tester. J. Food Eng. 2012;108(1):51–58.
- Chevanan N, Womac AR, Bitra VSP, et al. Flowability parameters for chopped switchgrass, wheat straw and corn stover. Powder Technol. 2009;193:79–86.
- Wu MR, Schott DL, Lodewijks G. Physical properties of solid biomass, Biomass Bioenergy. 2011;35:2093–2105.
- Guan W, Zhang Q. The effect of moisture content and compaction on the strength and arch formation of wheat flour in a model bin. J Food Eng. 2009;94:227–232.
- Ganesan V, Muthukumarappan K, Rosentrater KA. Effect of flow agent addition on the physical properties of DDGS with varying moisture content and soluble levels. Trans. ASABE, 2008;51(2):591–601.
- Jensen PD, Mattsson JE, Kofman PD, et al. Tendency of wood fuels from whole trees, logging residues and roundwood to bridge over openings. Biomass Bioenergy. 2004;26:107–113.
- Shastri YN, Hansen AC, Rodriguez LF, et al. Switchgrass - practical issues in developing a fuel crop. CAB Rev. 2012;7(37):1–14.
- GRAINNET. DOE Grants Genera Energy and University of Tennessee Biofuels Initiative Cellulosic Ethanol Project $4.9 Million, Available from: http://www.grainnet.com/articles/doe_grants_genera_energy_and_university_of_tennessee_biofuels_initiative_cellulosic_ethanol_project__4_9_million-81578.html. Accessed Nov. 25, 2013
- Womac A. Development of a bulk-format system to harvest, store, and deliver high-tonnage low-moisture switchgrass feedstock, 2013 DOE Bioenergy Technologies Office (BETO) Project Peer Review, Alexandria VA, May 19–23, 2013. Available from: https://www2.eere.energy.gov/biomass/peer_review2013/Portal/Feedstock/#. Accessed Nov. 25, 2013.
- Womac AR, Groothuis MD, Dye C, et al. Reclam and flow performance of bulk switchgrass in automated handling and storage facility. Appl. Engin. Agric. 2015;31(3):513–522.
- Westover TL, Matthews A. Particle size and shape distributions of hammer milled pine INL/EXT-15-35033. INL milestone completion report, Dec. 31, 2014.
- Schulze D. Powder and Bulk solids. Berlin, Germany: Springer Press; 2008.