
 ?Mathematical formulae have been encoded as MathML and are displayed in this HTML version using MathJax in order to improve their display. Uncheck the box to turn MathJax off. This feature requires Javascript. Click on a formula to zoom.
Abstract
A few industries, such as the beverage industry, have experienced some growth in sales during the COVID-19 pandemic. Globally, beverage companies alone generate over 200 million tonnes of biomass annually, which largely ends up as animal feed or in landfills. With the UK government’s commitment to reduce its carbon footprint by at least 68% in 2030, many companies, especially small and medium enterprises (SMEs), are exploring options to reduce carbon emissions and develop roadmaps to become carbon neutral. It has thus become imperative for beverage companies to find value in or repurpose their waste. This paper unlocks the potential for improving the fuel properties of beverage waste through a blending process and explores the determination of optimal fractions for the blends via characterization. With an initial moisture content of 82 and 58 wt.% brewery spent grain (BSG) and spent coffee grounds (SCG), respectively, the pre-treatment process reduced moisture content by approximately 10–15 wt.%. The study concludes that biomass blending improved the fuel properties of the biomass, providing a competitive comparison with coal for energy applications.
Introduction
Oil prices witnessed significant stagnation during the current year, for two main reasons: an oil price war between two of the world’s strongest oil producing countries, Saudi Arabia and Russia, in early 2020; and the COVID-19 pandemic, which dramatically reduced the demand for oil [Citation1, Citation2]. The SARS COV-2 pandemic worsened the looming issues with the fall in demand, affecting an extensive range of energy markets. A further impact on the oil was the world lockdown in March 2020 and governments’ requirement for the general public to stay at home and social distance; for instance, the losses of the oil industry in Africa could worsen by at least 35.0% from the levels achieved in 2019, equivalent to about $27 billion [Citation3]. Generally, economic studies demonstrate that the COVID-19 crisis shrunk the growth of the global economy, during the first 6 months of 2020, by 0.4% or about $3,500 billion [Citation4], and caused significant drops in gross domestic product (GDP) growth. For instance, it decreased the GDP in industrial and developing countries by 1.8% and 2%, respectively. Some developed countries witnessed much worse scenarios; GDP growth in Australia and South Africa deeply contracted by about 15.0% and 10.0%, respectively [Citation5, Citation6]. However, a global review of the economic impact of the COVID-19 epidemic indicated that some industries, such as the beverage and personal protection equipment industries, experienced substantial sales in 2020. Due to staying at home and social distancing, alcohol consumption and purchase of liquor have soared, with sales increasing by 240%, including sales of spirits by 75.0%, wine by 66.0%, and beer by 42.0% [Citation7]. The rise in sales for some alcoholic beverage companies suggests they may be generating more biomass waste. In contrast to the rise observed in the alcohol beverage companies, coffee shops, bars, and restaurants were closed, which has caused a fall in sales of coffee. For instance, in February 2020, Starbucks sales in China decreased by 78.0% from the levels achieved in February 2019; globally, Starbucks lost about $915 million in sales during its fiscal second quarter because of store closures [Citation8, Citation9].
These commodities – coffee beans and brewery grains – are both well traded in the commodity market, with coffee being second most traded commodity next to oil and brewery grains being fifth [Citation10, Citation11]; the global production of coffee reached more than 9.513 billion kg in 2017–2018 [Citation12]. Hence, processing these products generates large amounts of waste in the beverage industry. Recovering these wastes (biomass) for energy use, enhancing their fuel properties and reducing the amount sent to landfills would contribute significantly to the renewable energy directives EU 2030 targets. Presently, biomass contributes a large percentage of the UK’s renewable energy production compared to solar, hydro and turbines. Recovering and unlocking the potential for blending brewery spent grain (BSG) and spent coffee grounds (SCG) as a pre-treatment for enhancement of their biomass properties for energy use would contribute to achieving the renewable energy directives EU 2030 targets for the UK.
Carbon emission pollution continues to grow while energy demand remains a challenge. The need to balance these related issues presents a challenge for the UK government with respect to meeting the renewable energy directive EU2030 targets for the UK and the carbon-neutral targets in 2050. Wood, a readily available biomass, remains the primary energy source for a large proportion of the world’s population. Hence, practices such as deforestation are increasingly popular in many regions in the developing world. However, in developed countries and low-middle-income countries, the increasing growth in industrialization begs the review of some of the waste materials from manufacturing processes, such as beverage production, for recycle, upcycle or reuse. Therefore, it becomes imperative to address and repurpose the rich biomass waste resources from industries such as the beverage industry and to channel these resouces for energy use. In addition, the calorific value for wood is low compared to these rich biomass sources and compared to coal. Some biomass types compete favourably with wood and are often slightly higher in calorific value than wood. However, the major drawback to this type of biomass is its high moisture content. Hence, reducing the moisture content requires densifying these biomass types. Densification of biomass in the form of pellets or briquettes is an important process in the production of innovative fuels. In addition, in selecting the right materials for good pellets or briquette production, it is paramount to ensure qualities such as eco-friendliness and non-toxicity.
A good number of small and medium enterprises (SMEs) in the beverage industry have process lines and consequently produce waste on a daily basis, and are unsure of how to repurpose these resources. Kerby and Vriesekoop [Citation13] reported on the utilization of brewery by-products and suggested that breweries located rurally essentially dispose of their brewery waste as animal feed, whilst breweries located in urban areas could explore a much wider range of applications. A preliminary survey on the spatial distribution of the brewery companies and coffee shops situated in the Baltic Triangle in Liverpool identified over 20 brewery companies and approximately 100 coffee shops. The survey found that the most common practice for disposal of BSG is as animal feed while SCG is disposed of as municipal solid waste. It is necessary to redress this practice by repositioning waste resources at the centre of the argument to recover and reclaim these waste streams. In recent years, the number of publications has increased on the application of coffee waste (coffee husk, coffee chaff and SCG) as individual or combined biomass explored for energy use [Citation14, Citation15]. Similarly, researchers have reported on the various applications of BSG [Citation13, Citation16, Citation17]. This paper presents, for the first time, a unique exploration of biomass composite from these two waste streams: BSG and SCG. The challenge to reduce the carbon footprint within the SMEs, which includes reduction of waste being sent to landfills, inspired this study to explore the potentials of the two waste types as a biomass composite for energy use application.
This study explores an innovative approach to add value to the beverage industry, in particular via coffee and brewery waste. Characterization of individual biomass and biomass composite product was investigated by carrying out proximate, ultimate elemental, and calorific value analyses. The resulting product is an inexpensive lignocellulosic biomass with enhanced fuel properties, which may find application in the production of char pellets or briquettes for energy use.
Materials and methodology
Samples
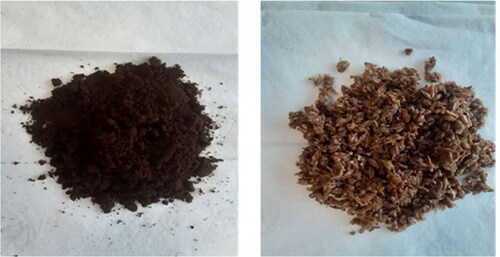
The biomass materials were obtained from the beverage industry. brewery spent grains (BSG) and spent coffee grounds (SCG) were supplied by Love Lane Brewery Liverpool and Coffee Bean Shop Liverpool, UK, respectively. The brewery samples were provided in the form of the shaft while the coffee waste was provided in the form of particulate powder. The appearance of the samples as received is shown in . The samples when collected were immediately stored in a freezer box to prevent microbial growth prior to analysis.
Figure 1. (a) spent coffee ground (SCG) (b) brewery spent grain (BSG).
Proximate analysis of biomass material
Proximate analysis is a widely acceptable method for biofuel characterization, and it is cost effective. It presents the moisture, fixed carbon, volatile matter, and ash contents of biomass. The fixed carbon content was evaluated using an empirical expression as indicated in the section ‘Fixed carbon percentage’.
Moisture content
The moisture content of the biomass materials was determined using British Standard BS EN 14774-3:2009. The prepared sample is dried at a temperature of 105 ± 2 °C in an air atmosphere until a constant mass is achieved. Subsequently, the percentage moisture is calculated from the loss in mass of the sample. Heating value decreases with increasing moisture content, so excessive levels of moisture can reduce combustion temperature and quality.
The experimental process involves a weight difference measured in a hot air oven, using 1 g of biomass sample (with similar particle sizes not finely ground) and crucibles, fixing temperatures at 105 °C for 1.5 h. Weight loss represents the moisture content. Moisture was calculated using the following equation:
(1)
(1)
where
represents the combination of the weight of the crucible and the original weight of sample;
presents the consequential dry weights dry sample and crucible; and
is the original sample weight.
Ash content
The ash content of the biomass material was determined using BS EN 14775-2:2009, by calculating the mass of the deposit after the sample was heated in a furnace at temperature of 550 ± 10 °C in the air under controlled conditions of 1.0 h, sample weight, and equipment specifications. Then the crucible and the residue were taken out of the furnace and placed in a desiccator to cool down at room temperature. The crucible and the residue were weighed again. The ash content was calculated using the following equation:
(2)
(2)
The inorganic part of the fuel residue after complete combustion is referred to as the ash content, varying from 1% to 40%. At high temperatures ash melts, producing slag in the furnace during the combustion process. Slag production could be reduced by introducing favourable conditions and ensuring the ash content is higher than 10% [Citation18].
Volatile matter content
Volatiles and fixed carbon were determined according to the BS EN 15148:2009 standard. The volatile matter is evaporated during the heating, so the difference between the starting weight and the final weight represents the volatile matter. In determining the volatile matter, biomass samples were placed in a crucible with a lid, heated at 95 °C for 5 min, and then cooled in a desiccator at room temperature. After deducting the corresponding moisture content, the difference in weight was attributed to the loss of volatile matter, as follows:
(3)
(3)
The volatile matter equation is rearranged as follows:
(4)
(4)
where
(5)
(5)
Fixed carbon percentage
This is the mass of the residue left after the release of volatile matter (ash and moisture contents excluded). This may be calculated as %FC= 100 − (%m + %a + %VM), where %FCis the percentage value of fixed carbon and %VMand %m are the percentages of volatile matter and moisture content, respectively, that were previously calculated.
Ultimate elemental analysis
The elemental analysis was carried out using a Perkin–Elmer 2004 Elemental Analyzer, to measure the different elements. Carbon, hydrogen, nitrogen, and sulphur contents are elements of interest while oxygen content is derived as the difference. The Pregl–Dumas method was used in analysing samples burnt in a pure oxygen atmosphere while combustion gases are automatically measured. Subsequently, complete combustion is achieved and the sample is converted into gases such as CO2, H2O, N2, and SO2. This study applied the carbon–hydrogen–nitrogen–sulphur mode, which permits the calculation of these four elements in organic materials, while the amount of oxygen was determined by subtracting the sum of the other element contents from 100%. Many researchers, such as Garcia-Perez et al. [Citation18], Strezov et al. [Citation19] or Obernberger et al. [Citation20] have suggested a similar procedure. The oxygen percentage was determined as follows:
(6)
(6)
Calorific value analysis
A calorimetry procedure was used to evaluate the higher heating value (HHV) of the biomass material. The IKA Werke C5000 Control calorimetric bomb equipment is completely adequate for repetitive assessments of the HHV. The American Society for Testing and Materials (ASTM) E-711 [Citation21] standard was followed for the analysis, which required the combustion to be established under certain defined conditions for determining the HHV.
The samples as received were crushed and filtered to 1 mm prior to feeding into the calorimeter. Samples were pressed into capsule form to avoid incomplete combustion and inconsistency in terms of weight. Using the bomb calorimeter, the HHV or gross calorific value for each substrate was analysed.
Phenolic content analysis
The phenolic compounds were measured using the method detection limit (MDL). The method detection limit is the minimum detection limit of a substance that can be measured and reported with 99% confidence that the analyte concentration is greater than zero and is determined from analysis of a sample in a given matrix containing the analyte. The MDL was raised to test the sample matrix causing interference, while interference was reduced by dilution to improve the signal-to-noise ratio. Samples were analysed by Socotec Energy Services based on United State Environmental Protection Agency (USEPA) method 8270.
Densification of biomass composite into pellets or briquettes
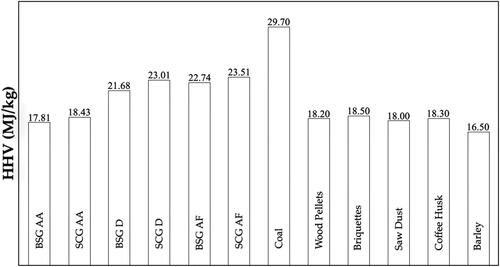
The decision to utilize biomass for energy application depends on the energy profile, moisture content, calorific value (higher heating value), and density. The use and the actual application of certain types of biomass are dependent on these variables [Citation22, Citation23]. A high HHV for a biomass material suggests the biomass releases large quantities of energy per kilogram biomass material during combustion (). In comparison with coal, these values are slightly lower. However, in order to optimize the available varied biomass and likewise harness the advantages of this potential energy, it becomes imperative to consider densification. A ‘substance with higher density and higher heating value has much more energy per occupied volume, which becomes one of the main features in the design of equipment for biomass energy usage’ [Citation23, Citation25]. The different types of agricultural wastes presented in , as reported by Singh and Zondlo [Citation24], show similar heating values (between 12 and 28 MJ/kg) for biomass materials they investigated. Pelletized biomass materials have slightly higher values (20 MJ/kg), suggesting that they are good potential sources for energy production in comparison with wood, briquettes, or coal [Citation26]. Nunes et al. [Citation27] identified the need for the pellet industry to explore other types of waste biomass due to the incapacity of logging companies to generate adequate wood biomass for the pellet industry.
Table 1. The higher heating value (HHV) of some substrates.
Torrefaction process for biomass composite products
Torrefaction is a thermochemical process involving the interaction between drying and incomplete pyrolysis. The different parameters that influence the torrefaction process are (a) reaction temperature, (b) heating rate, (c) absence of oxygen, (d) residence time, (e) ambient pressure, (f) flexible feedstock, (g) feedstock moisture, and (h) feedstock particle size. The torrefaction process can be either a dry or a wet process, each of which has its challenges and drawbacks. Biomass feedstock is typically pre-dried to ≤10% wt. moisture content prior to the dry torrefaction process, while the wet torrefaction process is suitable for biomass with higher moisture content. Bach and Skreiberg [Citation14] compared dry and wet torrefaction and concluded that the wet torrefaction process is superior in terms of the overall cost of biomass hydro char production.
The present study explored two streams of biomass feedstock, with 82 and 58% wt. moisture content, respectively. The moisture content requires at least 60% wt. reduction prior to loading in a dry torrefaction process. The wet torrefaction process was investigated for comparison. Particle size plays an important role in both dry and wet torrefaction as this influences certain parameters such as the reaction mechanisms, reaction kinetics, and duration of the process, given a specific heating rate. The duration of the process varies with the need to produce pulverulent, hydrophobic, or energy-rich enhanced biomass fuel. The dry torrefaction process utilizes the microwave atmospheric plasma (MAP) torch, which has been extensively reported upon [Citation28–30]. It offers advantages over the conventional thermochemical processes, such as fast heating, ease of control, and low power consumption. This study explored different blends of feedstock fractions as a method to reduce the moisture content of the biomass composite, prior to using the MAP torch as a unique torrefaction process to handle biomass feedstock with high moisture content.
Results and discussion
The decision to use biomass for energy use depends on the energy profile, moisture content, and calorific value (HHV). This characterization involved proximate, elemental/ultimate, and calorimetric analyses.
The matrix of this sample has been found to interfere with the result of this test. The sample was therefore diluted by 20× to improve the signal-to-noise ratio, and in doing so the detection limit for this test was also evaluated.
Comparison of fuel properties of biomass and biomass blend
Moisture content
The high moisture content in biomass is one of the drawbacks of using biomass waste materials. Moisture in biomass is a mineralized aqueous solution containing anions, cations, and neutral species. AS shown in , 100% wt. SCG and BSG have high moisture levels, of 58 and 82% wt., respectively. These moisture contents are too high in the present state and will not produce optimum energy release for biomass combustion. These potential biofuels would be considered unsuitable for use in heating as a result of their high moisture content. the high moisture content in biomass materials implies there is less dry material per mass unit, and therefore less released heat. Blending the BSG and SCG into biomass composite, however, reduced the moisture content by 10–15% wt.
Table 2. Proximate analysis results for biomass substrates.
Ash content
A low ash content is required and beneficial for higher fuel quality, providing increased heating value, less fouling and slagging, reduced corrosion, etc. As shown in , 100% wt. BSG and SCG samples have ash contents of 3.8 and 0.9% wt., respectively. Similarly, the biomass composites (BSG60SCG40, BSG50SCG50, BSG40SCG60), as shown in reduced ash content values (0.9–2.4% wt.) that fall within the range recorded in the literature (0.1–34.3% wt.) for biomass substrates [Citation31]. The ash contents recorded for coal (5–48.9% wt.) in other studies were higher [Citation31, Citation32] compared to biomass.
Volatile matter, combustion temperature, and fuel ratio
The volatile matter content is an important determinant of ignition and flame stability for most biomass. Using biomass with higher volatile matter contents can be beneficial for combustion. The volatile matter contents for 100% wt. BSG and SCG were 13.8 and 35.1% wt., respectively, as indicated in . The volatile matter content for the biomass composite slightly improved and was consistent across all fractions, with values ranging from 29.7 to 18.31% wt. In contrast, volatile matter contents of biomass as reported in the literature, and presented in and , were higher (30.4–79.7% wt.) than the values observed in this study. However, these observed differences might be attributable to the initial moisture content, which was relatively low for the substrates reported in the previous studies [Citation33, Citation36]. Interestingly, the volatile matter content reported for coal in the literature is low (12.2–44.5% wt.), and values were close in range to those of the biomass blends and individual biomass studied here.
Table 3. Comparison of data from the proximate analysis of spent coffee grounds (SCG) and brewery spent grain (BSG) with values reported in the literature.
Fuel ratio is the ratio of fixed carbon content to volatile matter content, which indicates the combustion characteristic of coal and biochar [Citation45–47]. The present study showed that the fuel ratios of BSG and SCG are 0.2 and 0.1, respectively. Both values are below 1.5, which is defined as the threshold for combustion characteristics [Citation48]. Combustion is difficult when the ratio is higher than 1.5 and easy when the ratio is lower than 1.5.
Fixed carbon, carbon, and hydrogen
The results obtained for fixed carbon content indicated low values for 100% wt. BSG and SCG. This was consistent with the biomass composite/blend. These values range between 4.46 and 10.3% wt., as shown in . Özçimen and Ersoy-Meriçboyu [Citation49] recorded a range of values for the fixed carbon content (6.5–35.3% wt.) in some biochar, which agrees with our study. In comparison with coal (17.9–70.4% wt.), the fixed carbon content is higher. The carbon content and fixed carbon play a substantial role in reducing CO2 emissions during biomass conversion. Carbon dioxide is the main product from the combustion of biomass fuels and its emissions are rendered CO2 neutral. The low carbon and fixed carbon are responsible for the reduced energy value of biofuels, leading to lower energy contained in C-O, C-H, and C-C bonds [Citation50]. The fixed carbon, carbon (C), and hydrogen (H) have a positive relationship with calorific value.
The elemental analysis of biomass presented in suggests the dried and dry ash-free samples of the BSG & SCG blend had a carbon content of 51.2–55.5% wt. at a 95% confidence level (p ≤ 0.05), which competes well with the vegetal coal carbon content (79.34% wt.) reported by García et al. [Citation51]. In contrast, the 100 wt.% BSG and SCG (42.7–43.4 wt.%) samples analysed as received were low at a 95% confidence level (p ≤ 0.05) in comparison to values reported for coal. This further confirms that the pre-treatment of biomass (i.e. biomass blending) improves the combustion properties of biomass fuels. Conversely, hydrogen contents were higher for the biomass blend and the individual biomass types (4.5–5.9% wt.) at a 95% confidence level (p ≤ 0.05), in comparison with coal (2.74% wt.), as depicted in .
Table 4. Elemental analysis of dried, and dry ash-free samplesof biomass substrates, compared with commercially available biomass substrate/fuels.
Alkaline earth compound and mineral composition
Low nitrogen and sulphur contents in converted biomass and coal are desirable to reduce emissions such as NOx and SOx, slag, smog, corrosion, and acid precipitation [Citation31, Citation50, Citation52]. The alkaline earth compounds such as nitrogen produced values of 2.7 and 2.0% wt. at a 95% confidence level (p ≤ 0.05) for BSG and SCG biomass,respectively, in comparison with coal at 0.65–2.8% wt., as presented in . Conversely, the sulphur contents in BSG and SCG were relatively lower (0.18 and 0.12% wt.) at a 95% confidence level (p ≤ 0.05) compared to coal (0.30% wt.). High potassium, chlorine, and sulphur contents in biomass fuels are contributing factors to corrosion problem in biomass-fired boilers. The major ash-forming elements (Al, Si) and the composition of the gas (O2, N2O, H2O) phase have a significant influence on the behaviour of chlorine and alkali metal and the formation of corrosion in heating units. Consequently, the flue gas generated per kg of fired fuel is dependent on both the carbon and the hydrogen contents of the fuel.
Low heating value and high heating value
The low bulk density and heating energy value are significant disadvantages for biomass conversion. The lower energy density requires biomass resources close to the processing facility, while the bulk density of the biomass particle makes it prone to adhesion due to the build-up of static electric charges [Citation53]. Available pre-treatment processing such as drying, bailing, chopping, milling, screening, pelletization, briquetting, and torrefaction could address this challenge by increasing the energy density, depressing self-ignition, improving grindability and storage, etc. [Citation52, Citation54]. The results presented in and show HHVs (17.81–23.51 MJ/kg) for BSG, SCG, and BSG & SCG blends in comparison with other biomass substrates, such as barley. The BSG & SCG blend (23.5 MJ/kg) competed favourably with coal (29.7 MJ/kg), while BSG competed favourably with other biomass types, with the lowest values recorded (17.8 MJ/kg) other than barley (16.5 MJ/kg). Similarly, the gross calorific value for the BSG & SCG blend competed well with those of briquette and wood pellets, as recorded in the literature [Citation51].
Figure 2. BSGAA- brewery spent grain sample as analysed SCGAA-spent cofee ground sample as analysed BSGD-brewery spent grain sample dried SCGD-spent coffee ground sample dried BSGAF-brewery spent grain sample ash-free dried SCGAF-spent coffee ground sample ash-free dried.
Toxic material and emission
Phenolic content was evaluated to determine the quality and quantity of phenolic compounds present in the biomass substrates. The total phenolic content for all samples was <62.2*20-time dilution = 1244 mg/kg (see . Murkovic and Pichler [Citation55] reported values of phenolic compounds in roasted coffee ranging between 300 and 2900 mg/kg. The value recorded for the present study falls within the range reported in the literature. The individual phenolic content in each substrate suggests that the quantity is well below the method for detection for each determinant analysed. Hence, the application of the biomass blend or individual substrate for heating would not cause harm to the environment.
Table 5. Phenolic content analysis for spent coffee grounds (SCG) and brewery spent grains (BSG).
By comparison of fuel properties, as presented in and , the biomass product investigated here can be characterized as having low ash content, moderate to low carbon, good fuel ratio, high heating value, low sulphur content, 10–15% wt. reduction as biomass blend, low toxic emissions, possible low corrosion influence, and potential as a solid fuel. The data from this study shows that the biomass blend improves the fuel properties, and blending the two waste substrates (BSG & SCG) from the beverage industry could be identified as a form of pre-treatment. The biomass blend can undergo a further pre-treatment process for various industrial applications as renewable energy and an alternative to solid fuel. Torrefied biomass from previous studies presents a higher calorific value [Citation24, Citation54], as shown in . The bio-oil products from the pre-treatment process can be presented as biofuel candidates due to their high calorific values.
Conclusions
The challenge to reduce the carbon footprint of SMEs, which includes the reduction of waste being sent to landfills, inspired this study to explore the potential of two waste types as a biomass composite/blend for energy use application. Globally, the beverage companies alone generate over 200 million tonnes annually of untapped biomass resources. The results of this study provide useful data in the exploration of BSG, SCG, and BSG & SCG composites/blends as potential biomass products, for biofuel in heating and energy applications. The results show that biomass blend improves the fuel properties, and the blending process could be identified as a form of pre-treatment to enhance fuel properties, with an emphasis on biomass wastes generated from SMEs. The analysis shows a 10–15% reduction in the initial moisture content, ash content, and mineral composition such as nitrogen content for the biomass composite/blend, in comparison with 100% wt. BSG or 100% wt. SCG. Conversely, the sulphur content in BSG and SCG was relatively lower compared to the sulphur content of coal. Similarly, the phenolic content analysis for BSG and SCG suggests the results for both were below the detection limit of the selected method, suggesting they are more environmentally friendly fuels in comparison to coal. The gross calorific value for the BSG and SCG ranged between 17.8 and 23.5 MJ/kg, in comparison with coal at 29 MJ/kg. Further research work is required on BSG & SCG biomass composite/blend densification and torrefaction (wet and dry) processes. However, wet torrefaction has already demonstrated high potential to convert a wide range of biomass, with emphasis on biomass with higher moisture content, to energy-dense solid biofuels.
CRediT author statement
Ibijoke Idowu: conceptualization, methodology; Ibijoke Idowu: data curation, writing – original draft preparation; Khalid Hashim: visualization, referencing; Andy Shaw: supervision; Leonel Nunes: writing – reviewing and editing.
Acknowledgements
The authors appreciate the support from Love Lane Brewery and Bean Coffee Shop Liverpool UK. This article reflects only the authors’ views and the EuropeanCommission is not liable for any use that may be made of the information contained therein.
Disclosure statement
The authors declare that there is no conflict of interest regarding the publication of this paper.
Additional information
Funding
References
- Cardona-Arenas CD, Serna-Gómez HM. 2020. COVID-19 and oil prices: Effects on the Colombian peso exchange rate. Available at SSRN 3567942.
- Rakov D, Guzansky Y, Fadlon T. 2020. INSS Insight No. 1276, March 18, 2020 The economic-political struggle behind the energy market crash.
- Idris M, Oruonye E. Socioeconomic impact of COVID-19 in oil exporting countries: an analytical review of the macroeconomic indicators in Nigeria. Int J World Policy Dev Stud. 2020;6(5):44–50.
- Danylyshyn B. The peculiarities of economic crisis due to COVID-19 pandemic in a developing country: case of Ukraine. Probl Perspect Manage. 2020;18(2):13–22.
- Ataguba JE. COVID-19 pandemic, a war to be won: understanding its economic implications for Africa. Appl Health Econ Health Policy. 2020;18:325–328.
- Romano F. An estimate of the economic impact of COVID-19 on Australia. SSRN Electron J. 2020;14:1–5.
- Chodkiewicz J, Talarowska M, Miniszewska J, et al. Alcohol consumption reported during the COVID-19 pandemic: the initial stage. IJERPH. 2020;17(13):4677.
- Forsido SF, Mitiku F, Lemessa F, et al. 2020. COVID-19 probable impacts on Ethiopian agriculture and potential mitigation and adaptation measures: no food-no health-no life. Ethiopia: Jimma University Press.
- Peña PJ. Modelling the economics of the new normal: a discussion paper on methodology and macro modelling for a post-coronavirus world. SSRN 3619942 2020:1–35.
- Gebrehiwet GA. 2019. Investigation of biogas production by co-digestion of brewery wastewater and brewery spent yeast [MS.c. thesis]. Addis Ababa: Addis Ababa University Ethiopia.
- Slavova G, Georgieva V. World production of coffee imports and exports in Europe, Bulgaria and USA. Trakia J Sci. 2019;17(Suppl.1):619–626.
- Gerpen JV. Biodiesel processing and production. Fuel Process Technol. 2005;86(10):1097–1107.
- Kerby C, Vriesekoop F. An overview of the utilisation of brewery by-products as generated by British craft breweries. Beverages. 2017;3(2):24. https://www.mdpi.com/2306-5710/3/2/24
- Bach Q-V, Skreiberg Ø. Upgrading biomass fuels via wet torrefaction: a review and comparison with dry torrefaction. Renew Sustain Energy Rev. 2016;54:665–677.
- Bougrier C, Dognin D, Laroche C, et al. Anaerobic digestion of brewery spent grains: trace elements addition requirement. Bioresour Technol. 2018;247:1193–1196.
- Celus I, Brijs K, Delcour JA. The effects of malting and mashing on barley protein extractability. J Cereal Sci. 2006;44(2):203–211.
- Haile M. Integrated volarization of spent coffee grounds to biofuels. Biofuel Res J. 2014;1(2):65–69.
- Garcia-Perez M, Chaala A, Pakdel H, et al. Characterization of bio-oils in chemical families. Biomass Bioenergy. 2007;31(4):222–242.
- Strezov V, Moghtaderi B, Lucas JA. Computational calorimetric investigation of the reactions during thermal conversion of wood biomass. Biomass Bioenergy. 2004;27(5):459–465.
- Obernberger I, Brunner T, Bärnthaler G. Chemical properties of solid biofuels—significance and impact. Biomass Bioenergy. 2006;30(11):973–982.
- Soler A, Torres MR, Pérez DG. Caracterización de residuos agrícolas del sureste español como biomasas energéticas: 2. Estimación de su potencial. Ingeniería Química. 1983;(176):137–143.
- Čuček L, Klemeš JJ, Kravanja Z. Carbon and nitrogen trade-offs in biomass energy production. Clean Technol Environ Policy. 2012;14(3):389–397.
- Čuček L, Varbanov PS, Klemeš JJ, et al. Total footprints-based multi-criteria optimisation of regional biomass energy supply chains. Energy. 2012;44(1):135–145.
- Singh K, Zondlo J. Characterization of fuel properties for coal and torrefied biomass mixtures. J Inst Energy. 2017;90(4):505–512.
- Saidur R, Abdelaziz E, Demirbas A, et al. A review on biomass as a fuel for boilers. Renew Sustain Energy Rev. 2011;15(5):2262–2289.
- Nunes L, Matias J, Catalão J. A review on torrefied biomass pellets as a sustainable alternative to coal in power generation. Renew Sustain Energy Rev. 2014;40:153–160.
- Nunes LJR, Matias JCO, Catalão JPS. Mixed biomass pellets for thermal energy production: a review of combustion models. Appl Energy. 2014;127:135–140.
- Khongkrapan P, Thanompongchart P, Tippayawong N, et al. Microwave plasma assisted pyrolysis of refuse derived fuels. Central Eur J Eng. 2014;4(1):72–79.
- Lynch KM, Steffen EJ, Arendt EK. Brewers' spent grain: a review with an emphasis on food and health. J Inst Brew. 2016;122(4):553–568.
- Martinez-Saez N, García AT, Pérez ID, et al. Use of spent coffee grounds as food ingredient in bakery products. Food Chem. 2017;216:114–122.
- Vassilev SV, Baxter D, Andersen LK, et al. An overview of the composition and application of biomass ash. Part 1. Phase–mineral and chemical composition and classification. Fuel. 2013;105:40–76.
- Vassilev SV, Vassileva CG, Vassilev VS. Advantages and disadvantages of composition and properties of biomass in comparison with coal: an overview. Fuel. 2015;158:330–350.
- Jang H, Ocon JD, Lee S, et al. Direct power generation from waste coffee grounds in a biomass fuel cell. J Power Sources. 2015;296:433–439.
- Mussatto SI, Carneiro LM, Silva JP, et al. A study on chemical constituents and sugars extraction from spent coffee grounds. Carbohydr Polym. 2011;83(2):368–374.
- Mussatto SI, Dragone G, Roberto IC. Brewers' spent grain: generation, characteristics and potential applications. J Cereal Sci. 2006;43(1):1–14.
- Mathias TRdS, Alexandre VMF, Cammarota MC, et al. Characterization and determination of brewer's solid wastes composition. J Inst Brew. 2015;121(3):400–404.
- Mussatto SI, Roberto IC. Chemical characterization and liberation of pentose sugars from brewer's spent grain. J Chem Technol Biotechnol. 2006;81(3):268–274.
- Park J, Kim B, Lee JW. In-situ transesterification of wet spent coffee grounds for sustainable biodiesel production. Bioresour Technol. 2016;221:55–60.
- Robertson JA, I'Anson KJ, Treimo J, et al. Profiling brewers' spent grain for composition and microbial ecology at the site of production. LWT Food Sci Technol. 2010;43(6):890–896.
- Shie J-L, Tsou F-J, Lin K-L, et al. Bioenergy and products from thermal pyrolysis of rice straw using plasma torch. Bioresour Technol. 2010;101(2):761–768.
- Tian T, Freeman S, Corey M, et al. Chemical characterization of potentially prebiotic oligosaccharides in brewed coffee and spent coffee grounds. J Agric Food Chem. 2017;65(13):2784–2792.
- Tosun A, Dieste O, Fucci D, et al. An industry experiment on the effects of test-driven development on external quality and productivity. Empir Softw Eng. 2017;22(6):2763–2805.
- Vardon DR, Moser BR, Zheng W, et al. Complete utilization of spent coffee grounds to produce biodiesel, bio-oil, and biochar. ACS Sustain Chem Eng. 2013;1(10):1286–1294.
- Zarrinbakhsh N, Mohanty AK, Misra M. Fundamental studies on water-washing of the corn ethanol coproduct (DDGS) and its characterization for biocomposite applications. Biomass Bioenergy. 2013;55:251–259.
- Kurose R, Ikeda M, Makino H, et al. Pulverized coal combustion characteristics of high-fuel-ratio coals. Fuel. 2004;83(13):1777–1785.
- Park S-W, Jang C-H. Characteristics of carbonized sludge for co-combustion in pulverized coal power plants. Waste Manage (Oxford). 2011;31(3):523–529.
- Sahu SG, Sarkar P, Chakraborty N, et al. Thermogravimetric assessment of combustion characteristics of blends of a coal with different biomass chars. Fuel Process Technol. 2010;91(3):369–378.
- Nyakuma BB, Oladokun O, Jauro A, et al. 2017. Fuel Characterization of Newly Discovered Nigerian Coals. Paper presented at the IOP Conference Series: Materials Science and Engineering (Vol. 217, No. 1, p. 012012). IOP Publishing, England,UK.
- Özçimen D, Ersoy-Meriçboyu A. Characterization of biochar and bio-oil samples obtained from carbonization of various biomass materials. Renew Energy. 2010;35(6):1319–1324.
- Lynch D, Henihan AM, Bowen B, et al. Utilisation of poultry litter as an energy feedstock. Biomass Bioenergy. 2013;49:197–204.
- García R, Pizarro C, Lavín AG, et al. Characterization of Spanish biomass wastes for energy use. Bioresour Technol. 2012;103(1):249–258.
- Koppejan J, Van Loo S. 2012. The handbook of biomass combustion and co-firing. Routledge.
- Kwok Q, Jones D, Nunez G, et al. Characterization of bio-fuel and bio-fuel ash. J Therm Anal Calorim. 2004;78(1):173–184.
- Van der Stelt M, Gerhauser H, Kiel J, et al. Biomass upgrading by torrefaction for the production of biofuels: a review. Biomass Bioenergy. 2011;35(9):3748–3762.
- Murkovic M, Pichler N. Analysis of 5‐hydroxymethylfurfual in coffee, dried fruits and urine. Mol Nutr Food Res. 2006;50(9):842–846.