Abstract
Biodiesel is one of the most important alternate fuels that is clean and has no negative environmental effects. Transesterification and lipid production are the main unit operations in biodiesel production. It is important that both these processes are conducted in the most efficient manner ensuring that the best possible product is obtained. A rigorous multiobjective nonlinear model predictive control strategy for the transesterification and lipid production processes is presented. The objective is to maximize the concentration of the required products while minimizing the impurities. This is very significant for biochemical engineers as it will provide strategies to get the best possible product while minimizing the cost of purification. The simultaneous maximization of the required product and the minimization of the impurities is novel and will be instrumental in preventing equipment damage in addition to reducing the purification expenses. The optimization language pyomo is used in conjunction with the global optimization solver BARON. A comparison of the performances of the single objective optimal control and the multiobjective nonlinear model predictive control is made and it is seen that the latter is effective in maximizing the quantity of the required product while minimizing the amount of the other chemicals and thus reducing the cost of purification and demonstrates that the multiobjective approach is more beneficial than the single-objective strategy.
Disclosure statement
No potential conflict of interest was reported by the authors.
Figure 6a. SOOC for transesterification Cgl vs t
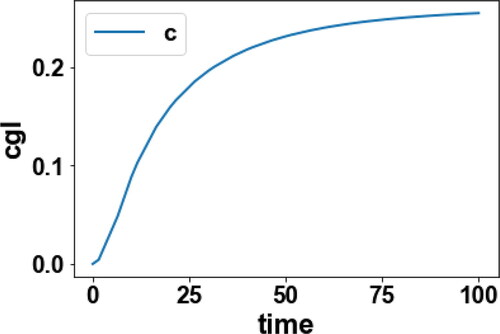
Figure 6b. MNLMPC for transesterification Cgll vs t.
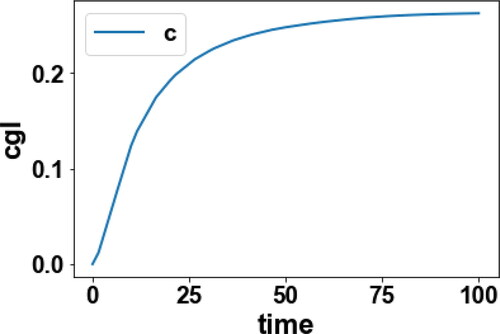
Figure 7. Pareto curve transesterification CE vs CGl.
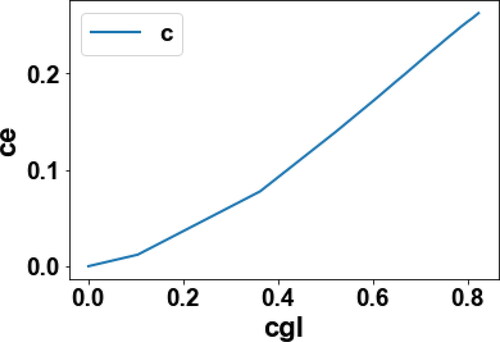
Figure 8. Pareto curve transesterification CE vs CA.
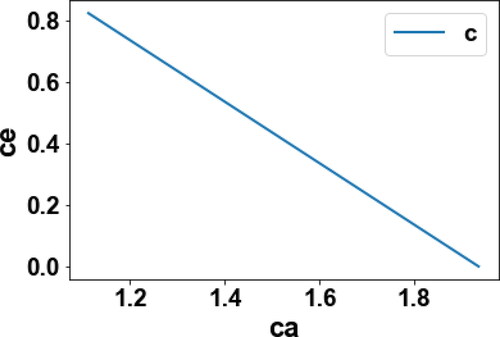
Figure 9. Pareto curve transesterification CE vs Ctg.
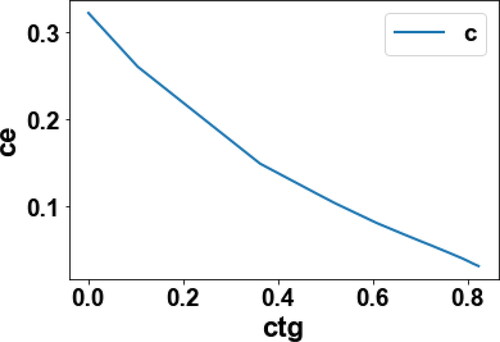
Figure 15a. SOOC lipid production S2 vs t.
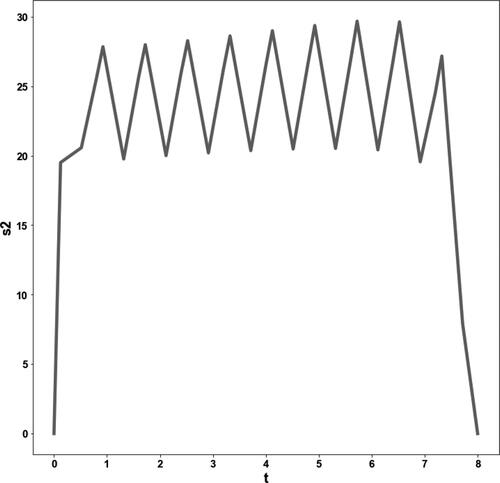
Figure 15b. SOOC lipid production S2 vs t.
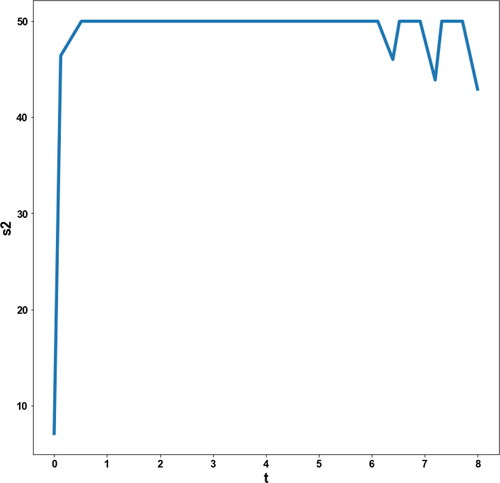
Figure 16. p-d-t pareto surface lipid production.
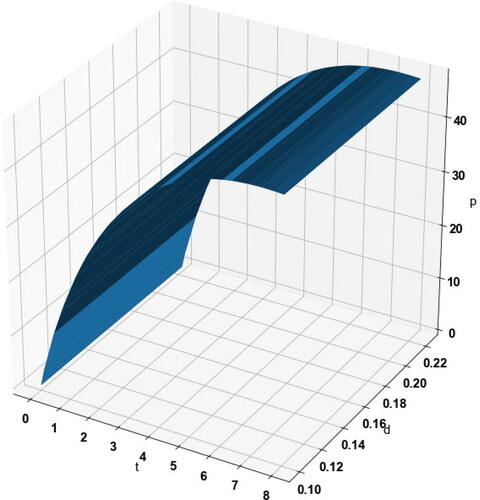
Figure 17. x-d-t pareto surface lipid production.
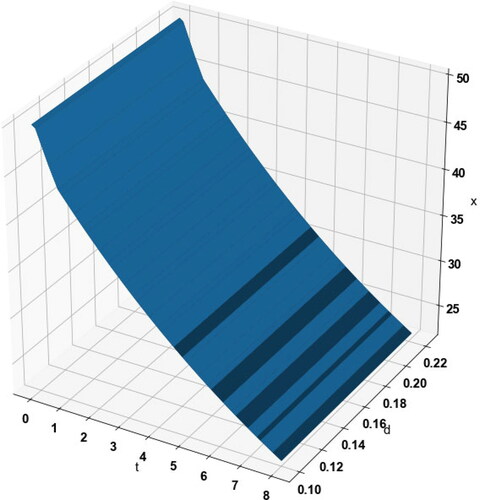
Figure 18. x-p-t pareto surface lipid production.
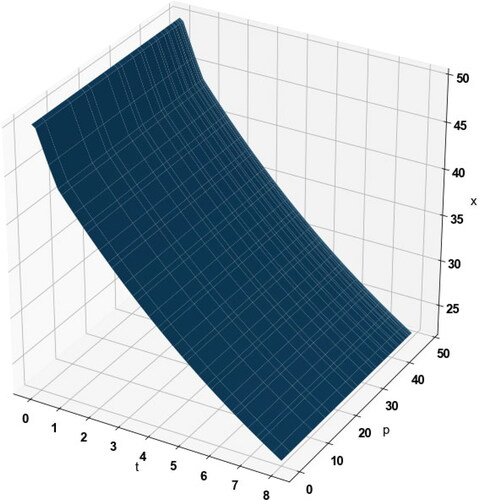
Figure 19. S1-S2-t pareto surface lipid production.
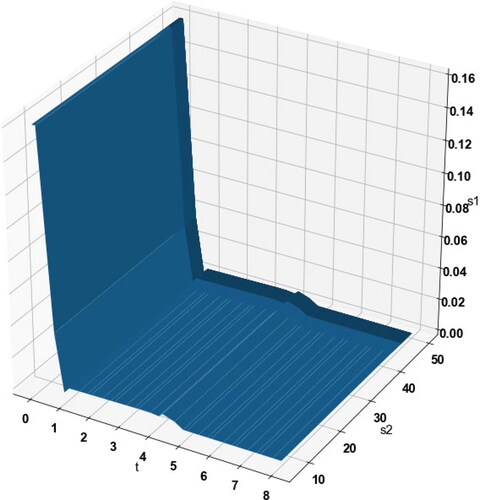
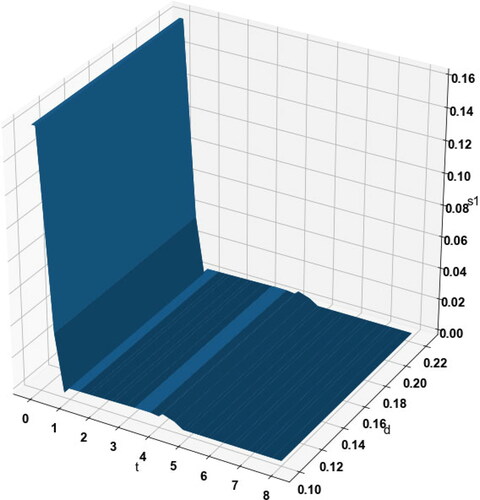
Figure 20. S1-d-t pareto surface lipid production.