
 ?Mathematical formulae have been encoded as MathML and are displayed in this HTML version using MathJax in order to improve their display. Uncheck the box to turn MathJax off. This feature requires Javascript. Click on a formula to zoom.
Abstract
The liquid fuel breakup mechanism in spray injection with ambient air for diesel and biodiesel at different fuel temperatures is studied numerically. We find that biodiesel fuel type injection with low fuel temperature induces more air entrainment volume to the boundary of the spray than diesel fuel injection and higher fuel temperature. Meanwhile, the normalized parcel density for biodiesel is 12% larger than that of diesel and peaks at a shorter distance along the spray line from the injection point (42 vs. 46 mm). Biodiesel fuel demonstrates a maximum 0.395 mg/s of air mass flow while diesel max mass flow is 0.279 mg/s. As a result, the air entrainment volume of biodiesel to the moving spray area at 1.4 ms reaches 3723.98 mm3 while for diesel the amount is 3151.27 mm3. However, the absorbed y-direction air velocity into the spray core for diesel fuel is dominant. The results give new insights into air exchange to spray boundary in the near nozzle and spray tip area: towards the tip of spray the air pushout is remarkable. Higher fuel temperature leads to slightly lower air exchange flow and entrainment (5.2%), cone angle reduction from 300 to 325 K fuel temperature, and increased surface area:volume ratio for diesel.
Introduction
The prime societal and environmental concerns over the ongoing climate change stemming from the combustion aftermath of fossil fuels are not yet fully resolved. The main challenge is to convert as much as possible of the chemical potential of fuel with an oxidizer, which is achievable by an ideal fuel jet atomization that allows the surrounding air to access the droplets. The stoichiometric air–fuel mixture in the chamber allows the utmost energy output and ultimate low gas emission from the exhaust valve [Citation1]. Renewable fuels are known as a potential alternative for conventional fossil fuels since they originate from plants in nature and have alcohol content, which has proven to be more environmentally friendly. As a result, the spray and injection characteristics of such fuels (e.g. biodiesel) have been in the spotlight in recent relevant studies [Citation2, Citation3]. The use of biodiesel fuels has been highly promoted, as it helps with low-emission combustion [Citation4, Citation5].
The liquid breakup process in fuel sprays is of great importance. Several studies have examined the penetration, breakup length and characteristics of the fuel spray considering liquid and gas properties [Citation6–12]. Fuel spray and combustion characteristics have been studied under different breakup models and mostly indicate similar patterns, with slight differences [Citation13, Citation14]. Spray breakup length and time can be affected by several factors. Higher injection pressure and smaller nozzle diameter lead to shorter breakup length [Citation15]. Liquid surface tension plays an important role in slowing droplets’ breakup [Citation16]. Gao et al. [Citation17] studied the evaporating fuel spray breakup under the wave breakup model, considering different breakup constant values. Having formulated a model coefficient based on ambient temperature, their new results gave better accuracy in comparison to the resuts with a constant value of the coefficient.
Fuel injection temperature can affect nozzle flow cavitation and also the spray atomization process inside the chamber [Citation18]. It has been found that the injection rate at different pressures is decreased by an increase in fuel temperature, and the resulting spray penetration length grows slowly in comparison to the fuel of ambient temperature [Citation19]. The spray droplet's diameter at selected distances from the nozzle tip in the radial direction decreases with increasing temperature of the fuel. The discharge coefficient and droplet velocity are also decreased with an increase in the fuel temperature [Citation20].
Spray characteristics of gasoline–diesel blends showed longer penetration length and higher average droplet diameter for neat diesel, and the shortest penetration and lowest value of droplet diameter for the fuel with the maximum gasoline fraction. The opposite trend was observed in spray cone angle [Citation21]. Alternative fuels and biodiesels and their blends with diesel fuel were investigated in several studies [Citation22, Citation23]. Blending pine oil biodiesel with diesel fuel to reduce soot emissions from combustion was reported to be beneficial, and it also increased the penetration length and spray angle to enhance the atomization process [Citation24].
Methyl ester biodiesels have been studied as an alternative to fossil fuels [Citation25, Citation26]. It has been shown that the ambient temperature, compared to the fuel temperature, has a larger effect on soybean methyl ester (SME) fuel Sauter mean diameter (SMD) and penetration length, which were slightly different at higher fuel temperatures [Citation27]. The effects of methyl ester biodiesels on internal flow and injection rate were numerically investigated by Mohan et al. [Citation28]. Park et al. [Citation29] studied spray and combustion characteristics of SME biodiesel and diesel fuels. Their results revealed a serious difference in terms of soot and CO emissions between the two fuels. Diesel fuel spray showed a larger cone angle in comparison to biodiesel. It was also found that the two fuels’ sprays have penetration lengths in the same range, fluctuating with the energizing time. In an experimental investigation of soybean biodiesel and n-butanol spray and their combustion characteristics, Liu et al. [Citation4] reported that biodiesel had a longer penetration length in the same injection conditions and n-butanol had a lower soot concentration.
However, there is a lack of numerical studies that have investigated microscopic characteristics and properties of fuel sprays to provide a more precise insight into the fuel breakup and atomization process. The present study explores the airflow field and spray–air interaction for diesel and SME biodiesel with different fuel temperatures and breakup methods. The distinctive feature of this investigation is that the air entrainment and pushout from the spray zone are determined for both fuels. Unlike other studies that focused on the fuel spraying, this work presents the hydrodynamic spray and air interface flow exchange in two frameworks of moving/adaptable control volume and fixed boundary encompassing the fully developed spray. To this end, the transient and cumulative air volume and air mass flow exchange as the spray evolves are considered, and it is discovered that in different zones of spray coordinates, we can observe the dominant entrainment and gas pushout.
The y-component air velocity to spray at different layers along the spray developed segment is investigated; research on this topic is scarce in the literature. Different fuels, fuel temperatures and breakup models are chosen for the liquid spray–air interaction and spray structure analysis in the current work. The air y-velocity corresponding to diesel spray is comparatively higher than that of biodiesel. In addition, the spray cone angles for diesel and biodiesel are compared as a result of air entrainment and air mass flow to boundary of the spray.
Mathematical modeling
Spray modeling
The Eulerian–Lagrangian approach was used to evaluate the gas/liquid momentum exchange inside the combustion chamber. Simulations were carried out employing the AVL FIRE computational fluid dynamics (CFD) code. The drag function, as the most important component of the momentum equation, is defined by the drag coefficient equation [30]:
(1)
(1)
Parameters in the nozzle discharge are the initial conditions for in-chamber spray simulation. The initial perturbations on the fuel/gas interface, induced by the cavitation phenomenon and the shear stress on the orifice internal wall, facilitate primary breakup and are the main reason for it [Citation31]. This in turn generates fluctuations on the liquid surface, which grow until the liquid core detachment. The turbulent length scale, which is calculated by the local values of turbulent kinetic energy and turbulent dispersions, defines the primary breakup rate of the liquid jet [Citation32].
Wave and Kelvin-Helmholtz and Rayleigh–Taylor (KH-RT) breakup models were used in this study to predict the atomization process and droplet diameters. The wave or KH model [Citation33] in high-velocity liquid jets results in the child droplets having a diameter lower than that of parent droplets and equal to the wavelength of the most unstable surface wave or the fastest growing one. In this model the surface wavelength is multiplied by the constant corresponding to 0.61, to match the resulting stable radius of the droplet. In the dominant stripping breakup mechanism of diesel sprays, the Webber number (We) and Ohnesorge number (Oh) are of great importance.
The characteristic breakup time for this model is calculated by:
(2)
(2)
which is corrected by setting the constant
according to different injector nozzles. Different values for this constant may lead to totally different results in atomization length or droplet diameters [Citation34]. In fact, this constant determines the breakup length for the liquid jet. The smaller the aforesaid constant, the shorter the penetration length and the breakup length. The recommended range for the constant is between 5 and 60.
The wavelength () and the wave growth rate (
) are defined as follows:
(3)
(3)
and
(4)
(4)
In the KH-RT model the Kelvin-Helmholtz surface instability is accompanied by Rayleigh-Taylor disturbances that break up the liquid jet. The RT mechanism is characterized by the growth of surface waves on the droplet under rapid deceleration, mainly under resistant drag forces. In penetration lengths with higher values compared to the breakup length, liquid jet breaks up under the effect of both mechanisms, whereas with lower values the KH mechanism is dominant. The breakup length is given as follows:
(5)
(5)
Employing the RT breakup model for the nozzle inlet area will result in a rapid breakup as this type is suitable for relatively low velocities [Citation35]. Liquid droplets undergoing drag forces on their trajectory after decreasing of velocities fit within the range of the RT-type breakup mechanism, which may result in droplets with relatively larger size. The simulation approaches and parameters are presented in .
Table 1. Simulation parameters.
Air entrainment into the spray plume
The spray volume and consequent air entrainment can be interpreted according to the schematic given in . To calculate the spray plume volume, the spray plume is supposed to have been formed from consecutive cone sections with a precision of 0.5 mm. The cumulative air entrainment was obtained using the values of cone volumes.
Figure 1. Air volume entrainment computations by subdivided conical segments.
r(i): integral element's inner radius: r(i+1): integral element's outer radius: ΔX: integral element's thickness.
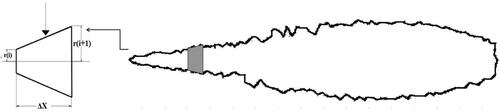
The air entrainment is calculated by spray volume evaluation:
(6)
(6)
where L is the spray length.
The entrainment rate is calculated using the spray volume values of the two consecutive instances [Citation36]:
(7)
(7)
The spray air entrainment is an underlying characteristic that defines the air mass flow rate across the spray plane boundary. This air is then mixed with spray droplets to form the air–fuel mixture.
Air mass exchange computation across the conical surface
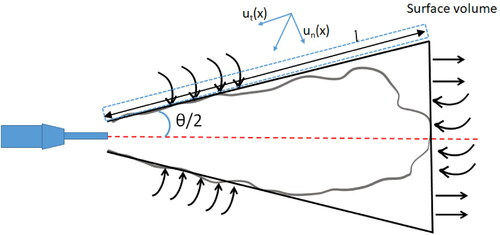
In addition, for a better understanding of the considered research variables’ effect on the flow condition within the spray chamber, a circumferential cone covering the spray at its largest evolution is taken to analyze the mass flow across the cone segment. This parameter computes the mass flow across those faces within the specified cell selection that corresponds to the surface of a cone given by two axis points and corresponding radii.
In this context, to quantify the air mass flow across the conical surface volume, the schematic of the enclosed spray surface and airflow is depicted in . To this end, the surface plane enclosing the spray is defined, then the air mass across the plane is calculated using the formula development section of the numerical tool. The air mass flow crossing the surface boundary is estimated using the following equation:
(8)
(8)
where un(x) indicates the normal air velocity to a surface plane covering the spray, ρa is the ambient air density and θ/2 is the half spray cone angle.
Figure 2. A schematic of the air mass flow exchange from the cone surface area.
Geometrical modeling and numerical implementation
Numerical simulation for a non-reacting fuel spray was carried out in a constant volume combustion chamber (CVCC). The computational volume was discretized and the cell number was increased to 108,000 cells to acquire grid independence. The cylinder is 100 × 100 mm2 in diameter in height where the spray is injected via an injector with a 0.3 mm orifice and 0.8 mm in length. The discretized (meshed) domain used for the spray simulation and subsequent airflow calculations is illustrated in . The simulation properties applied for the numerical investigation are listed in .
Figure 3. Discretized geometry of the combustion chamber.
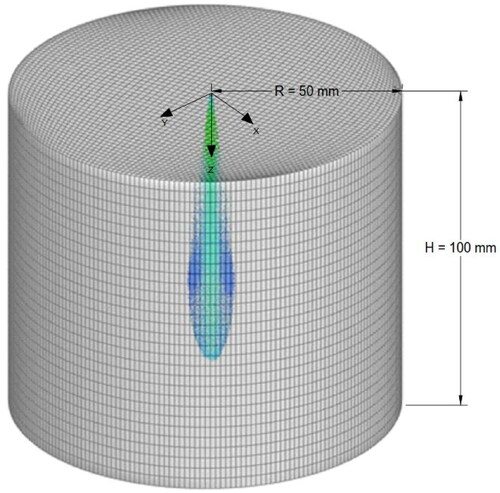
Table 2. Numerical simulation conditions.
To ensure the reliability of the numerical setup and modeling procedure by AVL FIRE and its respective computational codes, the validation is implemented using experimental data available in the literature. The penetration of both fuels (diesel and biodiesel; in the numerical frame) and the experimental data (in the marked lines) are plotted in during the injection time.
Figure 4. Comparison of experimental [Citation37] and calculated results for (a) biodiesel penetration length and (b) biodiesel SMD.
![Figure 4. Comparison of experimental [Citation37] and calculated results for (a) biodiesel penetration length and (b) biodiesel SMD.](/cms/asset/c3eb1c4e-ddf6-429e-b306-7a73c4164374/tbfu_a_2105867_f0004_c.jpg)
The figure shows that the trend of higher biodiesel penetration compared to diesel is accurately predicted and the numerical lines follow the experimentally measured penetration values, particularly in the late injection process. The slight discrepancy of data in penetration is attributed to initial breakup model coefficient adjustment and air drag resistance with jet momentum uncertainty. As seen in the SMD results, the stabilized simulation data fall within ±2% standard deviation of the experimentally measured data, which is an acceptable range to confirm the robustness of the numerical model.
Diesel and biodiesel (SME) fuels were used in this study, and the properties of both fuels are defined in . These properties are especially significant in liquid dynamics and hydrodynamics in the breakup process and spray structure in later evaluations.
Table 3. Fuel properties of diesel and SME biodiesel in a continuous phase spray simulation [Citation38].
Results and discussion
The factors that mostly affect the spray structure are the liquid specification of the spray such as cohesion force (We number: wavelength that led to liquid film rupture), density, fuel temperature, and viscosity, which contribute to the spray breakup mechanism. On the other hand, the ambient air mass flow and entrainment were also found to be influential in the spray shape and morphology in the big picture. The increase in the entrainment rate leads to better provision of the combustion air and affects the air/fuel ratio. Also, the distinctive findings in terms of ambient air velocity to the spray plume can specify the locations where the best mixture is provided before combustion. The droplet distribution is also of great importance when investigating the wall impingement probability and liquid diffusion inside the chamber. Air entrainment and fluid velocity into the spray plume at spray borders are two prime factors that account for the spray atomization quality and can be used to evaluate the penetration length and the resisting drag forces across the spray flow.
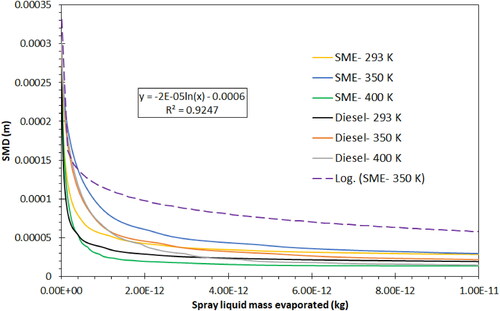
demonstrates the developed initial spray phase SMD against the spray liquid evaporation for different fuels at the considered temperature levels. Smaller spray droplets tend to be evaporated faster. The rate of primary spray breakup is intensified at the higher temperature of 400 K for both fuels, since the high-temperature fuel can be disintegrated easily with low surface tension and molecular bonds. Moreover, the SMD-liquid spray follows a logarithmic trend with R2 = 0.92, and the approximate equation is as follows: Due to SME biodiesel’s higher viscosity and density, the droplet defragmentation is implemented more slowly than that of diesel; as a result, its evaporation is sluggish. shows SMD versus the evaporated mass of the spray (not the injection time). As a result, according to the different evaporation rates of the spray, the corresponding droplet size is demonstrated.
Figure 5. SMD vs. liquid mass evaporation for different fuels at 293, 350 and 400 K fuel temperatures.
Air entrainment parameters
In the current investigation, the airflow has been measured using two methods to capture the flow field when different fuels at different temperatures are injected into the cylindrical spray chamber. The first parameter is the air entrainment into the spray boundary in volume in either an instantaneous or an accumulative manner.
Entrained air values for diesel and biodiesel fuels relative to time are shown in . The spray volume for biodiesel fuel is larger than that of diesel fuel. After 0.5 ms from injection initiation, the air entrainment for biodiesel starts to grow higher than the values for diesel fuel. It is found that the fuel temperature does not have a major effect on air entrainment as the values for the two temperatures are barely different from each other. However, a slightly higher air entrainment volume is detected for colder fuel (293 K), which is attributed to the larger spray droplet size in the low-temperature fuel. When the fuel temperature increases, the viscosity decreases, and subsequently, the surface tension also decreases and the breakup process generates smaller spray droplets/parcels. The higher accumulated air entrainment volume for biodiesel stems from its higher biodiesel density which gains momentum as it is injected downstream and the denser droplets take in more ambient air towards the spray central axis. The divergence between the air volumes entrained into the spray cone of diesel and biodiesel increases with the spray evolution, and at 1.4 s after start of injection (ASOI), there is a 13.5% gap.
Figure 6. (a) Accumulated air entrainment for biodiesel and diesel fuels; (b) air entrainment rate for different breakup models; (c) air entrainment rates for biodiesel and diesel fuels.
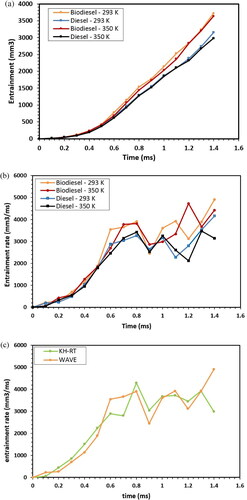
The entrainment rate has also been calculated from two consecutive plumes of spray. Results show that for the first 0.6 ms of spray evolution, the entrainment rate increases over time; after 0.6 ms of injection it starts to fluctuate and does not follow a specific trend. shows the ambient airflow rates into the spray plume. To investigate the effect of atomization on spray volume and air entrainment, two breakup models (wave and KH-RT) were used. shows the results of air entrainment from two different breakup models. It can be seen that there is no major difference in total entrained air, although during the primary breakup, the wave model causes higher air entrainment. In the KH-RT model, two factors – surface waves (KH) and disturbances (RT) – compete for the breakup, while in the wave model the initial growth perturbation and wavelength effects are set for surface liquid disintegration.
illustrates the average magnitude of the entrained air velocity, normal to the spray surface. It is seen that the overall trend is the same for different cases, i.e. at the beginning of injection, the average velocity has the highest value. As the spray evolution continues, the spray surface area grows and the entrainment velocity decreases. The velocity magnitudes for diesel fuel have relatively higher values in comparison to biodiesel fuel until 1 ms ASOI. After this time, the values for diesel and biodiesel fuel lie within a similar range. The fuel temperature has no significant effect on the overall velocity of the entrained air to the spray area. However, at the initial injection period, the entrained air velocity for the high-temperature fuel is higher. The higher temperature fuel is disintegrated easily due to low viscosity and density. Therefore, the surface of the spray is porous and lets the air enter with higher velocity.
Figure 7. Average normal velocity of entrained air, for biodiesel and diesel fuels.
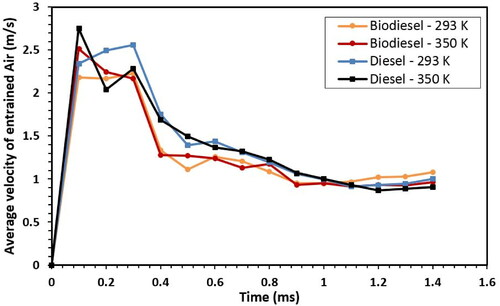
Increasing the fuel temperature decreases the fuel density and also viscosity in both diesel and biodiesel, and the two fuels show similar reactions to ambient air entrainment values by decreasing the ambient airflow into the spray. However, this trend is not the same in terms of the average ambient air velocity into the spray, and this may vary according to different surface tensions and viscosities.
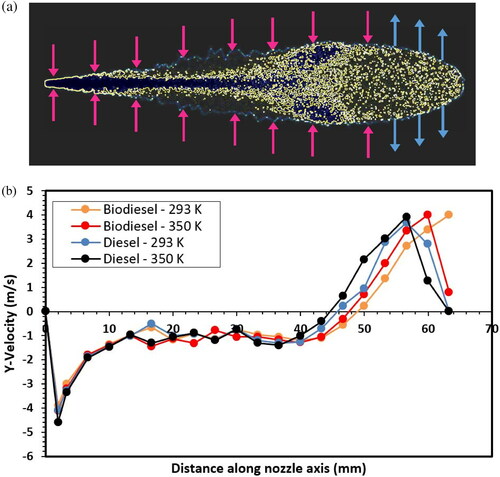
shows the spray plume and the local velocity component of Y normal to the spray boundary at 1.4 ms ASOI. The air output from the spray plume is obvious in the last part of the spray. This is the pushout zone for the spray characterized by the head vortex leading to the outward velocity vectors [Citation39]. illustrates the velocity magnitudes for the upper half of the spray plume considering that the positive values are the air velocity for the air output region of the spray.
Figure 8. (a) Two-dimentional spray plume and Y-velocity component of local entrained air, at spray plume surface at 1.4 ASOI; (b) Y-velocity component of instantaneous entrained air, for biodiesel and diesel fuels, with respect to the distance from nozzle tip.
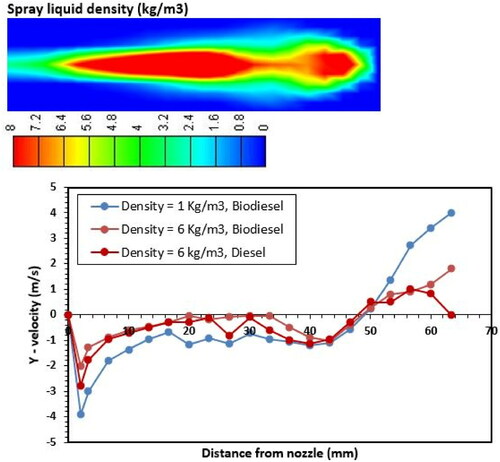
shows the Y component of local air velocity which is calculated considering two different surfaces that surround the spray plume. The two surfaces correspond to different liquid droplet densities. The velocity magnitude in the region with higher liquid density is an important factor for better atomization, as it penetrates directly to the liquid core. The values of velocity for the diesel fuel are higher than the values for biodiesel, which facilitates better atomization in diesel fuel.
Figure 9. Y-velocity component of locally entrained air, for biodiesel and diesel, in different surfaces corresponding to different liquid densities.
Air mass exchange values across the conical surface
The second parameter of interest is the air mass flow across the conical fixed boundary, which encloses the spray at its final developed status. In this way, the air fluctuation or air recirculation can be determined in the area close to the spray as an indication of hydrodynamic turbulence induced by the spray injection. The difference between the two methods is that the air entrainment just shows the amount of air that is sucked into the spray boundary as it grows, but the second exhibits the air exchange from a fixed boundary around the spray that is the best outlet for transient flow field variation.
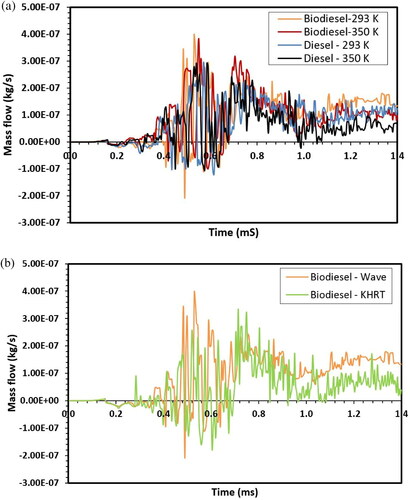
The temporal mass flow rate of air across the conical surface is plotted for different cases under investigation. During an interval of 0.4–0.7 ms, an average outflow of air from the conical surface can be observed, and after 0.7 ms onwards, the growing average air mass flow to spray is noticeable according to . The SME biodiesel spray at a subsequent stage of spray evolution absorbs more air mass than diesel, because of its denser liquid droplets with higher momentum that take in more air. The high-temperature fuel (either diesel or biodiesel), at the late injection period, has lower air mass flow and air velocity (see ). It can be inferred that at T = 350 K the spray has a smaller droplet size and a larger spray outer dimension since the fuel breakup occurs at a higher rate due to the lower viscosity and surface tension at a higher temperature. compares the wave and KH-RT breakup modeling effect on air mass across the boundary zone prediction. As shown, the wave model overestimates the air mass flow entrained towards the spray. Since, in the KH-RT model, the secondary breakup or atomization is taken into account (leading to tiny droplets), the liquid momentum causes less air to be taken inside the spray cone.
Figure 10. Temporal variation in the air exchange rate for (a) different fuels and temperatures, and (b) breakup models.
To determine the spray boundary region, the liquid droplets’ density contour is employed and the light blue region around the outer spray in with ρ = 3.0 kg/m3 is set for the ambient spray in calculations. To study the effect of ambient airflow inside the spray on the droplet atomization and the local dispersion, the air mass flow exchange across the control surface surrounding the plume, which corresponds to the contour of the fluid density of 3.0 kg/m3, was calculated. The instantaneous local airflow, across the control surface, is shown in . As clearly shows, from the start of the injection until 0.8 ms ASOI, sprays with higher injected fuel temperature have greater entrainment values and let relatively higher magnitudes of air into the spray plume. This can be accounted for by the lower diameters of spray droplets at higher fuel injection temperatures. At the early stages of injection, the air pushout rate, which corresponds to the negative values, is relatively higher in the case of the fuel temperature of 293 K, which conforms to the fact that the spray cone angle is larger for lower fuel temperature in both fuels under investigation. Diesel fuel spray has comparatively more zero airflow points, which show the tendency to push the air out of the plume surface which leads to better spreading of droplets in the ambient and larger cone angle. That is to say, biodiesel has more air entrainment than air outflow to the spray boundary, which implies a larger spray volume for biodiesel.
Figure 11. Scaled instantaneous air mass flow to spray boundary corresponding to ρl = 3.0 kg/m3 for diesel and biodiesel at different fuel temperatures of 293 and 350 K.
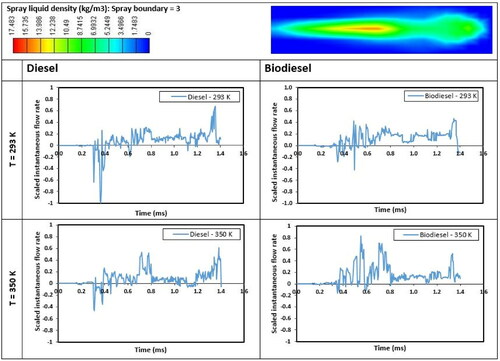
At T = 350 K, diesel has reached its flash point (see ), while for biodiesel a higher temperature is required for the flash point. As a result, the diesel evaporated region covers the spray circumference and provides resistance to air penetration. This is the reason that more air mass flow to the spray of biodiesel is observed in .
Spray characteristics
The parcel density distribution along the spray cone axis is shown in for different fuel types, liquid fuel temperatures, and breakup models. Since two different fuels with different physiochemical characteristics are applied for testing, ten the spray parcel density should be distinguishable and the fuel with a denser specification demonstrates a lagged trend in parcel density distribution since it takes more effort to cope with the atomization of this fuel. Once the injection has started, the initial droplet at the size of the nozzle hole diameter will be generated and the following droplets will be smaller. The maximum parcel density for SME biodiesel is delayed, and it has a lower density compared to its diesel counterpart. Biodiesel is a denser and more viscous liquid, hence its atomization and liquid jet disintegration are more difficult. As a result, the spray tip penetration is longer for the SME biodiesel and the peak normalized parcel density reaches its peak at 0.046 m, while this happens for diesel at 0.042 m.
Figure 12. Normalized parcel density distribution along spray plume axis: (a) fuel type effect; (b) fuel temperature effect; (c) breakup model effect.
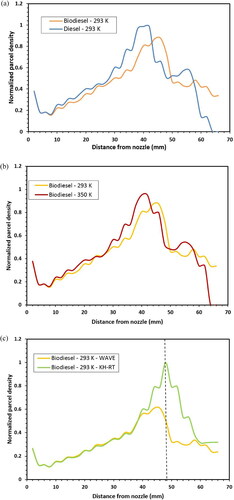
The effect of fuel temperature on parcel density along the spray for SME biodiesel is shown in . The high-temperature fuel has a lower surface force and is therfore prone to easier breakup with RT instability. As fuel temperature increases, shorter penetration of the spray and a lower breakup time is expected. According to , the wave breakup model significantly underestimates the normalized parcel density compared to the KH-RT model (about 50% at x = 0.049 m).
displays the spray penetration variation with fuel temperature for diesel and SME biodiesel. The biodiesel is denser than diesel, and thus the injected fuel from the injector gains more momentum under the same operational conditions; this trend is observed in all temperatures of fuel. Increasing the fuel temperature, however, caused a consistent penetration length. Increasing the fuel temperature leads to better breakup and atomization since the viscosity would decrease and the surface tension and Wecr would also subsequently decrease. As temperature increases from 293 K to 400 K, the penetration of spray declines by 6.1% and 5.9% for biodiesel and diesel, respectively.
Figure 13. (a) Penetration and (b) SMD vs. fuel temperature.
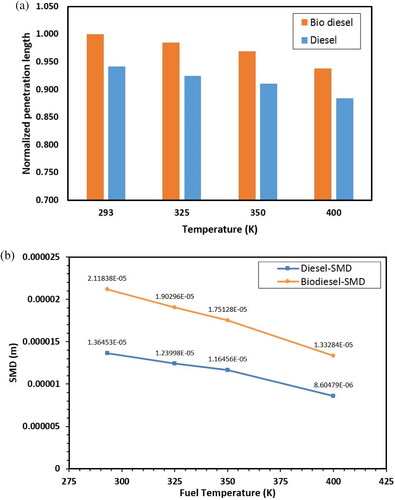
shows the SMD of the spray droplet with the fuel temperature for both diesel and biodiesel, where the mean droplet diameter consistently decreases with temperature. Since biodiesel has a higher density and viscosity than diesel, the breakup process of biodiesel is lengthier and it is more difficult to disrupt the surface cohesion of the liquid [Citation40, Citation41]. As a result, the biodiesel showcases higher droplet size characterized by higher SMD parameters for all fuel temperature cases. On the other hand, increasing the fuel temperature from 293 to 400 K leads to SMD reduction by as much as 37.2% for biodiesel and 36.7% for diesel. This is due to the weakened surface tension of the fuel liquid and the viscosity reduction that happens with fuel temperature and the subsequent loss of resistance against the flow oscillation.
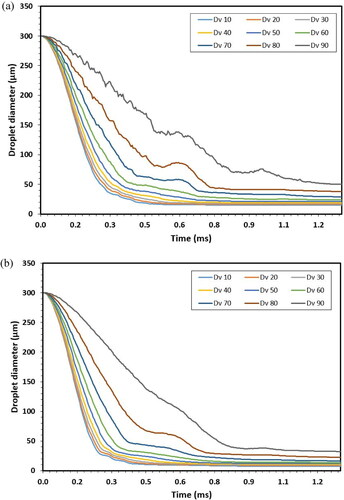
Spray droplet size distribution is illustrated in for the biodiesel fuel and in for diesel fuel. The figure shows that the volumetric diameter of spray droplets based on the time ASOI for biodiesel is relatively larger. The Dv parameter represents the volume-weighted cumulative size distribution below which the specified percentage of parcels are found.
Figure 14. Volume-weighted cumulative size distribution of (a) biodiesel and (b) diesel.
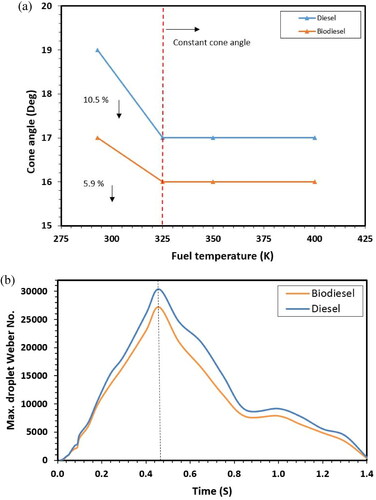
The spray cone angle trend with fuel temperature for the two fuels (diesel and biodiesel) is shown in . The cone angle of biodiesel is comparatively lower than that of diesel, and both fuels show no sensitivity to fuel temperature after 325 K of fuel temperature. Biodiesel resists breakup due to its higher viscosity, and droplets that are accelerated axially have less deviation radially. The findings show that diesel has greater spray angle reduction (10.5%) compared to biodiesel (5.9%) during the initial fuel temperature increase, i.e. from 300 to 325 K. Further fuel temperature increase from 325 K onwards causes no change in spray cone angle variation since this is the temperature that produces weakened viscosity of the fuel and extra fuel temperature increase does not affect spray cone angle. The critical We number is a criterion for the surface tension and liquid breakup threshold; the variation of this parameter with time is displayed in . As seen, the critical We of biodiesel is lower than that of diesel fuel; accordingly, diesel undergoes higher hydrodynamic instability and therefrom it is atomized more easily [Citation42]. This is why the SMD of diesel is lower than that of biodiesel. The results are also consistent with the cone angle difference between the two fuels, since the higher breakup rate of diesel results in higher droplet scattering and higher spray cone angle. It can be argued that biodiesel shows greater resistance against surface disturbances induced by the drag force of ambient air, which comes from the higher density and viscosity of biodiesel. According to the liquid fuel Weber number (WeL), equal to the lower surface tension (σ) leads to a higher We number. Diesel fuel, with its low surface tension, has a higher We number and the liquid structure disintegrates against air drag force more easily [Citation43].
Figure 15. (a) Variation of spray cone angle with fuel temperature and (b) maximum liquid We number with time.
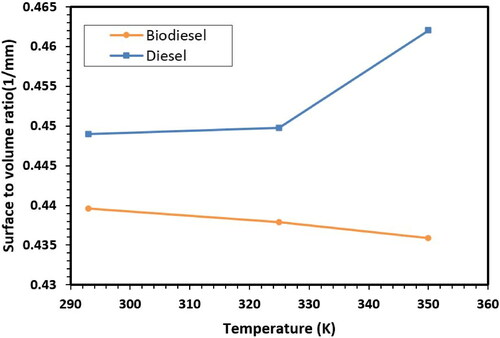
The ratio of the outer surface area to the entrained air volume of the spray is an indication of spray inflammation, which is shown with respect to fuel temperature in . This ratio follows a certain trend and decreases with the spray evolution. It is observed that by increasing the fuel temperature the ratio shows different behavior for diesel and biodiesel. Diesel fuel, due to its better atomization process and wider droplet scattering, has a higher spray-enclosed surface than biodiesel, while, on the other hand, biodiesel, because of its higher density compared to diesel, entrains more ambient air to the spray core. As a result, the ratio for diesel fuel is higher than that of biodiesel. In the biodiesel fuel, the higher temperature fuel has a slightly lower ratio since the effect of air entrainment is dominating the spray enlargement, so this causes spray deflation with the fuel temperature. The opposite pattern is noticed for diesel fuel, where lower air volume is entrained when the spray outer surface has been stretched with temperature.
Figure 16. Ratio of spray surface area to air entrainment volume.
Conclusion
A numerical investigation is carried out to analyze the spray and the entrained air for two fuels, diesel and biodiesel, at different temperatures. The air mass flow and entrained air are measured in two distinctive ways, i.e. the fixed conical volume around the fully evolved spray and the moving adaptable volume as the spray grows. The following are the highlights of our research findings:
It is determined that there is a logarithmic trend/approximation between the SMD of liquid droplets and the spray mass evaporation, with a confidence coefficient of R2 = 0.927, where the high-temperature fuels’ (400 K) gradient is stronger which means high-temperature fuel SMD decreases rapidly as evaporation occurs.
The biodiesel air entrainment and mass flow exchange in this work present new findings. The air mass instantaneous fluctuations around 0.4–0.6 are severe, and later on (towards the final spray evolution at 1.4 ms) they decrease. Biodiesel, compared to diesel, has larger peak and temporally averaged values since biodiesel’s denser droplets induce stronger momentum flow to entrain the surrounded air.
The entrainment volume rate and cumulative volume corresponding to biodiesel fuel in the low-temperature (293 K) case (4902 mm3/ms and 725 mm3, respectively) are the highest, and this means that denser, larger ligaments of spray allow more air to penetrate the spray cone, which can be interpreted as the permeable surface of the biodiesel spray area.
The entrained air mass flow contributes to the spray penetration length, and it takes more time when the air drag decelerates against larger biodiesel droplets.
| Nomenclature | ||
| ASOI | = | After start of injection |
| C1,2,3 | = | Breakup coefficients |
| CD | = | Drag coefficient |
| Cp | = | Cunningham correction factor |
| CFD | = | Computational fluid dynamics |
| CVCC | = | Constant volume combustion chamber |
| d0 | = | Droplets’ initial diameter |
| Dd | = | Particle diameter |
| KH | = | Kelvin Helmholtz |
| Lb | = | Breakup length |
| L(t) | = | Spray plume length |
| md | = | Particle mass |
| Oh | = | Ohnesorge number |
| r | = | Droplet radius |
| Red | = | Particle Reynolds diameter |
| RT | = | Rayleigh-Taylor |
| SMD | = | Sauter mean diameter |
| SME | = | Soybean methyl ester |
| u | = | Ambient flow velocity |
| ν | = | Parcel velocity |
| V | = | Spray volume |
| = | Entrainment rate | |
| We | = | Weber number |
| θ | = | Spray angle |
| = | Breakup time | |
| = | Droplet density | |
| = | Gas density | |
| = | Wavelength | |
| = | Wave growth rate | |
Disclosure statement
No potential conflict of interest was reported by the authors.
References
- Taghavifar H, Khalilarya S, Jafarmadar S. Computational and analytical measurement of air-fuel mixture uniformity and alternative fuels’ ignition delay in ICEs. Renew Energy. 2021;164:767–776.
- Kuti OA, Nishida K, Zhu J. Experimental studies on spray and gas entrainment characteristics of biodiesel fuel: implications of gas entrained and fuel oxygen content on soot formation. Energy. 2013;57:434–442.
- Bhikuning A, Sugawara R, Matsumura E, et al. Investigation of spray characteristics from waste cooking oil, bio-hydro fined diesel oil (BHD) and n-tridecane in a constant volume chamber. Case Stud Therm Eng. 2020;21:100661.
- Liu H, Huo M, Liu Y, et al. Time-resolved spray, flame, soot quantitative measurement fueling n-butanol and soybean biodiesel in a constant volume chamber under various ambient temperatures. Fuel. 2014;133:317–325.
- Cai G, Abraham J. Multidimensional simulations of non-reacting and reacting diesel and biodiesel sprays. Energy. 2017;119:1221–1229.
- Delacourt E, Desmet B, Besson B. Characterisation of very high pressure diesel sprays using digital imaging techniques. Fuel. 2005;84(7-8):859–867.
- Wakuri Y, Fujii M, Amitani T, et al. Studies on the penetration of fuel spray in a diesel engine. Bull JSME. 1960;3(9):123–130.
- Hiroyasu H, Arai M. Structures of fuel sprays in diesel engines. SAE Trans. 1990;1050–1061.
- Dent JC. A basis for the comparison of various experimental methods for studying spray penetration. SAE Trans. 1971;80:1881–1884.
- Zama Y, Ochiai W, Furuhata T, et al. Experimental study on spray angle and velocity distribution of diesel spray under high ambient pressure conditions. Atomiz Spr. 2011;21(12):989–1007.
- Arai M. Diesel spray penetration and air entrainment. Proceedings of the 13th ICLASS CDROM, 2015.
- Zhou X, Li T, Lai Z, et al. Modeling diesel spray tip and tail penetrations after end-of-injection. Fuel. 2019;237:442–456.
- Hossainpour S, Binesh AR. Investigation of fuel spray atomization in a DI heavy-duty diesel engine and comparison of various spray breakup models. Fuel. 2009;88(5):799–805.
- Li ZH, He BQ, Zhao H. Application of a hybrid breakup model for the spray simulation of a multi-hole injector used for a DISI gasoline engine. Appl Therm Eng. 2014;65(1-2):282–292.
- Wu S, Meinhart M, Petersen B, et al. Breakup characteristics of high speed liquid jets from a single-hole injector. Fuel. 2021;289:119784.
- Zhang W, Liu H, Liu C, et al. Numerical analysis of jet breakup based on a modified compressible two-fluid-LES model. Fuel. 2019;254:115608.
- Gao H, Li X, Xue J, et al. A modification to the WAVE breakup model for evaporating diesel spray. Appl Therm Eng. 2016;108:555–566.
- Zhang X, He Z, Wang Q, et al. Effect of fuel temperature on cavitation flow inside vertical multi-hole nozzles and spray characteristics with different nozzle geometries. Exp Therm Fluid Sci. 2018;91:374–387.
- Park J, Jang JH, Park S. Effect of fuel temperature on heavy fuel oil spray characteristics in a common-rail fuel injection system for marine engines. Ocean Eng. 2015;104:580–589.
- Chen Z, Yao A, Yao C, et al. Effect of fuel temperature on the methanol spray and nozzle internal flow. Appl Therm Eng. 2017;114:673–684.
- Feng Z, Zhan C, Tang C, et al. Experimental investigation on spray and atomization characteristics of diesel/gasoline/ethanol blends in high pressure common rail injection system. Energy. 2016;112:549–561.
- Mohan B, Yang W, Yu W, et al. Numerical analysis of spray characteristics of dimethyl ether and diethyl ether fuel. Appl Energy. 2017;185:1403–1410.
- Ma Y, Huang S, Huang R, et al. Spray and evaporation characteristics of n-pentanol–diesel blends in a constant volume chamber. Energy Convers Manage. 2016;130:240–251.
- Huang H, Liu Q, Shi C, et al. Experimental study on spray, combustion and emission characteristics of pine oil/diesel blends in a multi-cylinder diesel engine. Fuel Process Technol. 2016;153:137–148.
- Corral-Gómez L, Rubio-Gómez G, Martínez-Martínez S, et al. Effect of diesel-biodiesel-ethanol blends on the spray macroscopic parameters in a common-rail diesel injection system. Fuel. 2019;241:876–883.
- Das M, Sarkar M, Datta A, et al. Study on viscosity and surface tension properties of biodiesel-diesel blends and their effects on spray parameters for CI engines. Fuel. 2018;220:769–779.
- Park SH, Kim HJ, Suh HK, et al. Experimental and numerical analysis of spray-atomization characteristics of biodiesel fuel in various fuel and ambient temperatures conditions. Int J Heat Fluid Flow. 2009;30(5):960–970.
- Mohan B, Yang W, Yu W. Effect of internal nozzle flow and thermo-physical properties on spray characteristics of methyl esters. Appl Energy. 2014;129:123–134.
- Park SH, Kim HJ, Lee CS. Fuel spray and exhaust emission characteristics of an undiluted soybean oil methyl ester in a diesel engine. Energy Fuels. 2010;24(11):6172–6178.
- Schiller L. A drag coefficient correlation. Zeit Ver Deutsch Ing. 1933;77:318–320.
- Ashgriz N, editor. Handbook of atomization and sprays: theory and applications. Berlin, Heidelberg, Germany: Springer Science & Business Media; 2011.
- Bianchi GM, Pelloni P. Modeling the diesel fuel spray breakup by using a hybrid model. SAE Technical Paper; 1999. p. 1999-01-0226.
- Reitz RD. Modeling atomization processes in high-pressure vaporizing sprays. Atomisation Spray Technol. 1987;3(4):309–337.
- Taghavifar H, Anvari S, Mousavi SH. Assessment of varying primary/secondary breakup mechanism of diesel spray on performance characteristics of HSDI engine. Fuel. 2020;262:116622.
- Baumgarten C. Mixture formation in internal combustion engines. Berlin, Germany: Springer Science & Business Media; 2006.
- Zhai C, Jin Y, Nishida K, et al. Diesel spray and combustion of multi-hole injectors with micro-hole under ultra-high injection pressure–non-evaporating spray characteristics. Fuel. 2021;283:119322.
- Park SH, Kim HJ, Suh HK, et al. A study on the fuel injection and atomization characteristics of soybean oil methyl ester (SME). Int J Heat Fluid Flow. 2009;30(1):108–116.
- Jung H, Kittelson DB, Zachariah MR. Characteristics of SME biodiesel-fueled diesel particle emissions and the kinetics of oxidation. Environ Sci Technol. 2006;40(16):4949–4955.
- Ghasemi A, Barron RM, Balachandar R. Spray-induced air motion in single and twin ultra-high injection diesel sprays. Fuel. 2014;121:284–297.
- Battistoni M, Grimaldi CN. Numerical analysis of injector flow and spray characteristics from diesel injectors using fossil and biodiesel fuels. Appl Energy. 2012;97:656–666.
- Yu S, Yin B, Deng W, et al. Experimental study on the spray and mixing characteristics for equilateral triangular and circular nozzles with diesel and biodiesel under high injection pressures. Fuel. 2019;239:97–107.
- Duan RQ, Koshizuka S, Oka Y. Numerical and theoretical investigation of effect of density ratio on the critical weber number of droplet breakup. J Nucl Sci Technol. 2003;40(7):501–508.
- Hawi M, Kosaka H, Sato S, et al. Effect of injection pressure and ambient density on spray characteristics of diesel and biodiesel surrogate fuels. Fuel. 2019;254:115674.