
 ?Mathematical formulae have been encoded as MathML and are displayed in this HTML version using MathJax in order to improve their display. Uncheck the box to turn MathJax off. This feature requires Javascript. Click on a formula to zoom.
ABSTRACT
The Gulf Cooperation Council (GCC) countries have some of the highest obesity rates in the world. At the same time, the GCC countries have become increasingly integrated in the global economy as they attempt to diversify their economies. This raises the question whether rapid development and globalization contribute to obesity in these countries. To deal with the existing autocorrelation in the error term and the endogeneity problem, a dynamic panel econometric model is used to estimate the effect of globalization in its various dimensions on obesity in the GCC countries. This study finds evidence for positive and significant effect of social and economic globalization on obesity rates in the GCC countries relative to the rest of the world. The results suggest that (rapid) globalization can lead to higher obesity rates in emerging economies. Hence, policy has an important role to play to cushion the impact of globalization on health and nutrition.
Key findings:
The GCC countries have some of the highest obesity rates in the world. At the same time, the GCC countries are highly globalized. We study the effects of globalization on obesity rates in these countries.
We find that globalization, specifically in its economic and social components, can contribute to rising obesity rates.
Since many developing economics are becoming increasingly global, there is ample role for governments to mitigate the effects of globalization on public health and specifically obesity.
1. Introduction
The GCC countries have some of the highest obesity rates in the world. According to data from the WHO (World Health Organization), and barring some micro-island states, Kuwait, Saudi Arabia, and Qatar rank second (after the US), third and fourth in obesity rates respectively in 2016 – obesity being defined as having a body mass index (BMI) higher than 30. In terms of female obesity, Kuwait, Qatar, and Saudi Arabia rank first, second, and third respectively. This is usually attributed to windfall revenue from the abundant oil resources. The economies and societies of the GCC have radically transformed following the discovery and exploitation of the vast oil and gas deposits. Key aspects of this transformation include the increasing integration of the region in the global economy. In fact, the GCC region has become a major hub in international finance, trade, aviation, and tourism. Similarly, technological advances and the influx of economic migrants and international tourists have exposed the local communities to new cultures and ideas. Indeed, an argument can be made that the GCC countries stand out globally in terms of the speed of transformation in an era of increasing globalization. These changes lead us to think that the GCC countries may be especially exposed to the externalities that come with globalization, and hence, may be affected differently by them. In this study, we are interested in the differential effects of globalization on obesity in the GCC countries relative to the rest of the world.
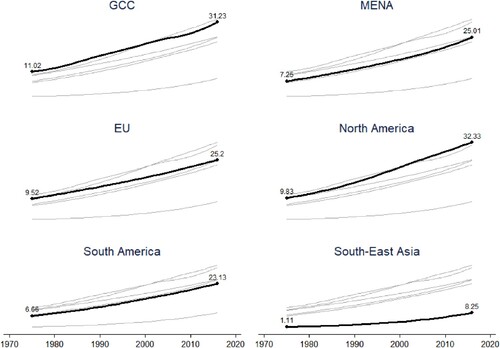
Globalization is a complex process by which economies, societies, and cultures become integrated through economic, technological, socio-cultural, political and biological processes (Miljkovic et al., Citation2015; Potrafke, Citation2015).Footnote1 The KOF globalization index is widely used as a reliable measure of globalization. It is considered the most comprehensive measure of globalization because it encompasses the economic, social, and political dimensions of globalization (Potrafke, Citation2015). The index ranks the GCC countries very high in economic and social globalization. For example, in 2019, the KOF Index ranks the UAE fifth and Bahrain ninth globally in de facto economic globalization (trade openness and trade partner diversity), and ranks the UAE second and Qatar fifth in de facto social globalization.Footnote2 Using the same data, we plot the evolution of globalization of the GCC countries in . The plot shows the six countries improved significantly. Figures A1 and A2 (Appendix 1) similarly show significant improvements in the social and economic dimensions of globalization across the six countries. The globalization index increases by more than 25 points between 1975 and 2016 for all six countries. Saudi Arabia improves the most in the social globalization index, increasing from just above 30 in 1975 to 70 in 2016. The UAE improves the most in economic globalization. At the same time, obesity rates have increased sharply in all GCC countries over the past four decades (Figure A3 in Appendix 1). We juxtapose the GCC obesity rates with obesity rates in most major world regions in . The figure shows that the GCC countries along with North America have the highest average obesity rates between 1975 and 2016. Contrast this with the other regions, where obesity rates increase, but remain significantly lower. Naturally, there will be significant heterogeneity within the regions which is beyond the scope of this study. How much of this increase can be attributed to globalization in the GCC countries?
Figure 1. KOF Globalization Index (0–100) in the GCC countries between 1975 and 2016. ARE stands for United Arab Emirates; BHR for Bahrain; KWT for Kuwait; OMN for Oman; QAT for Qatar; and SAU for Saudi Arabia. Source: Authors' own compilation based on raw data from KOF Swiss Economic Institute.
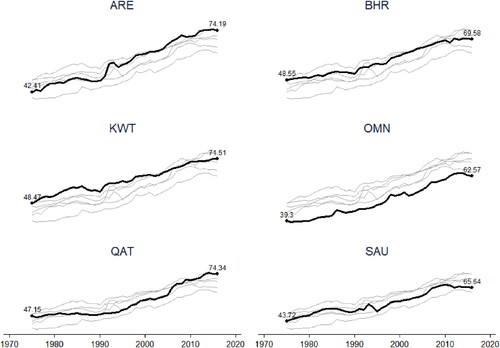
Figure 2. Obesity rates across select regions between 1975 and 2016. The EU includes all 28 EU countries as of 2016. The MENA does not include the GCC countries. South America includes only countries on continental South America and does not include the Caribbean island nations. North America includes the USA, Canada, and Mexico. South-East Asia includes countries in South-East and East Asia. Authors' own compilation based on raw data from the WHO.
This study uses the most widely used measure of globalization, the KOF Globalization Index to investigate the effects of globalization in its economic and social dimensions on obesity in the GCC countries. We are mainly interested in the economic and social dimensions of globalization since these two dimensions matter the most for consumers. We deploy a dynamic panel model with a GMM (generalized method of moments) estimator to compare the GCC countries to the rest of the world and isolate the effects of globalization. This estimator has the advantage of dealing with the autocorrelation present in the error term and the endogeneity problem in the data. We find evidence for a positive significant effect of globalization in its social and economic aspects on obesity in the GCC countries relative to non-GCC countries. We subject the results to host of robustness checks and the results hold. We do not find a positive and significant effect for globalization or any of its dimensions on obesity in the base group (non-GCC) countries as some of the other studies that we reviewed earlier. This can be explained by the model and estimator that we use, which has not been used in any of the other studies. In addition, our sample of countries is much larger than all other studies (we have 177 countries in our sample) and we control for more covariates than some of the other studies. We will discuss this in detail in later sections. Our results suggest that obesity in the GCC countries responds differently to globalization than in other countries. We think this is due to the vast changes to the society in these countries that ensued the discovery and exploitation of the vast oil riches, which manifested in the growing integration of these countries in the world economy.
The idea that globalization may lead to higher obesity and negatively affect public health is not new. The public health literature refers to ‘the nutrition transition’, which is defined as the move to consume more meat, dairy products, and processed foods (Hawkes, Citation2006). This leads to poorer diets and higher incidence of obesity, diabetes, cardiovascular disease and cancer in many developing countries (Popkin, Citation2006). The nutrition transition is linked to trade liberalization and expanding globalization in this literature. Globalization can yield health benefits too because it contributes to economic growth and reduces poverty and global health inequalities. The benefits may outweigh the costs but the costs include public health issues such as obesity (Schrecker et al., Citation2008). Particular food categories of concern from an obesity perspective are processed and fatty meats, edible oils and ultra-processed snack foods. Miljkovic et al. (Citation2015) provide an economic model that describes the link between globalization and obesity. In their model, globalization generates health externalities that contribute to the obesity problem in many countries. A country is able to deal with these externalities by imposing higher import tariffs on certain food imports, for example. Operating in a globalized world where trade barriers are being lowered, a country loses control over these externalities. The same rationale can be applied to other aspects of globalization including cross-border financial flows and social interaction. In an increasingly globalized world, countries are eager to attract foreign direct investment, tourists, and (skilled) migrants as a way to enhance growth and diversify their economies. In addition, advances in communication technology (internet, social media) are lowering the cultural barriers. As a result, countries find themselves with less tools with which they are able to deal with the health externalities of globalization.
This paper is related to two strands of the literature that address the link between globalization and obesity and these are the public health and the economics literatures. Most of the evidence in the public health literature is based on case studies and descriptive statistics and does not account for conflating covariates, causality, and economic theory. Such studies document how globalization forces go hand in hand with the increasing availability of imported ‘unhealthy’ foods and changing dietary habits. Within globalization, obesity is linked to liberalizing trade (Hawkes & Thow, Citation2008; Thow et al., Citation2010; Thow & Hawkes, Citation2009), foreign direct investment (FDI) in the food industry through the entry of transnational food corporations (TFCs) (Hawkes, Citation2006), and technical change (Popkin, Citation2006). A case can be made that public health considerations should be part of policy when economies are integrated in the world economy as a result (Rayner et al., Citation2006). Friel et al. (Citation2013) and Barlow et al. (Citation2017) provide reviews of this literature. An exception in this literature is the recent study of Barlow et al. (Citation2017) who use regression and synthetic control techniques to isolate the effect of the US–Canada FTA on calorie availability in Canada. They find evidence that this trade agreement has led to an increase in calorie availability of 170 kilocalories per capita in Canada. A large body of literature in public health and medicine emphasize the link between socioeconomic factors and obesity. These studies typically depend on cross-sectional individual surveys in one country or several regions in a country. Socioeconomic factors that are found to influence the incidence of obesity for the individual are educational level, household income, and occupational status. See Dinsa et al. (Citation2012) for a review of this literature.
The economics literature has also dealt with the question on the link between globalization and obesity. This literature, however, has been more concerned with statistical evidence for the effects of globalization on obesity and other nutrition outcomes. The evidence generally supports the hypothesis that different globalization dimensions lead to higher obesity and worse dietary outcomes. Many of these studies use panel econometrics to study the effects of globalization on health outcomes. Vogli et al. (Citation2014) study the effects of economic globalization and inequality on average BMI in 122 countries between 1980 and 2008 and find that economic globalization increases average BMI for all countries. Miljkovic et al. (Citation2015) investigate the effects of social globalization, trade openness, and FDI on obesity rates in a panel data setting (79 countries between 1986 and 2008) and using quantile regressions and find that trade openness and social globalization affect obesity positively in all countries and FDI affects countries in the lower quantiles of obesity rates only. Goryakin et al. (Citation2015) study the effects of social, economic, and political globalization on overweight in a large sample of women in 56 low-middle and low-income countries. They find support for a positive effect of social globalization but a much lower (almost negligible) effect for economic globalization on obesity. Oberlander et al. (Citation2017) investigate the effects of social globalization and trade openness in a panel of 70 countries between 1970 and 2011 on the supply of proteins, free fats and sugars, and average BMI. They find evidence for a positive effect of social globalization on average BMI but no evidence for an effect of trade openness.
A few studies in economics focus exclusively on trade liberalization and its role in public health. A key mechanism through which trade liberalization affect nutrition and food behavior is removing (or decreasing) tariffs, reconciling health and sanitary standards, and often liberalizing bilateral (or multilateral) investments. The lowering of trade barriers (through lower import tariffs and non-tariff barriers) reduces the relative prices of imported foods and can therefore raise local consumption of food. This could lead to obesity if imported foods are more ‘unhealthy’ which tends to be the case (see section 2). Trade liberalization also promotes domestic food production through the lowering of trade barriers in intermediate inputs. In the same spirit, trade liberalization typically goes hand in hand with liberalization of foreign investments, which – in the case of the food sector – tend to be obesity-inducing and appear to be critical in the expansion of highly processed (junk) food outlets (Friel et al., Citation2013; Miljkovic et al., Citation2015). Trade also changes the availability of foods and increases the varieties on the shelves. If trade reduces the relative prices of unhealthy foods, then consumers could increase their demand for the unhealthy varieties. Notable contributions include Miljkovic et al. (Citation2018) and Giuntella et al. (Citation2020). Miljkovic et al. (Citation2018) use state-level data on Brazil to study the effect of trade openness on overweight and obesity in these states. They find evidence that increased trade has a positive and significant effect on overweight and obesity at the state-level. Giuntella et al. (Citation2020) establish a positive effect of trade imports from the US on obesity in Mexican households.
Obesity is not only associated with worse health outcomes and consequently, higher public health expenditures. In many cases, obesity is associated with disability which adds to the personal and societal costs of obesity. The relationship between obesity and disability goes in both directions. Obesity may itself lead to higher incidences of disability, both physical and mental but disability may also lead to higher incidences of obesity. The mechanisms through which obesity may lead to disability can be highly complicated and physiological in nature and are beyond the scope of this study. But obesity may also increase the chances of disability in ways that go beyond physiology. For example, Himes and Reynolds (Citation2012) find evidence for increased chances of falls, injuries, and disability due to obesity in a cohort of American retirees. If obesity leads to some disabling conditions, the economic costs can be very high for both the individual and the society at large. The economic costs can be direct or indirect. Direct economic costs relate to the higher health care bills to treat morbidity resulting from obesity that the individual or the society will bear (Colditz, Citation1999). Indirect costs relate to loss of income due to physical and mental limitations that prevent the person from participating in the labor force or lead to a loss of productivity of the worker (Gates et al., Citation2008). Even if obesity does not lead to severe disability that prevents the person from participating in the labor force, loss of productivity can be extremely detrimental because it may reduce the career opportunities and perspectives of the afflicted persons. It is not far-fetched to extend this to children with obesity whose education may be impacted by increased absences. This in turn will affect socioeconomic outcomes of the child in adulthood. Evidence of the link between obesity and disability is large. Ells et al. (Citation2006) review the evidence linking obesity to common physical impairment conditions and mental health disorders and describe possible causal links between obesity and disability. Caird et al. (Citation2011) and Cohen et al. (Citation2013) review the literature on the evidence linking obesity and educational attainment.
This study contributes to the literature by focusing on the role of globalization on obesity in GCC countries. By doing so, we are the first study that focuses on a small group of developing countries that have embraced globalization relatively quickly while having some of the highest obesity rates in the world. This makes this group of countries of particular interest from both public health and economic perspectives. We also contribute methodologically by comparing the GCC countries to other countries using a dynamic panel model with a GMM (Arellano and Bond) estimator to estimate the differential effects of globalization on these countries. This estimator is not used in any of the existing studies and has the advantage of directly addressing the problem of autocorrelation in the error term and the endogeneity problem in the data. The results are also new to the literature and suggest that rapid globalization, in its social and economic aspects, can aid in increasing obesity rates.
The study proceeds as follows. Section 2 introduces the data and explores recent trends in food imports in the GCC countries. Section 3 sets the empirical specification and presents the benchmark results from estimating the econometric specification. Section 4 tests the results’ sensitivity to several robustness exercises. Section 5 concludes.
2. Data sources, descriptive statistics, and trends in food imports
In this section, we introduce our data sources and present some descriptive statistics of the main variables. Our dependent variable is the rate of obesity (percentage of people who suffer from obesity in the total population). Data on obesity is obtained from the WHO and includes information on 177 countries between 1975 and 2016 (see in Appendix 2 for the list of countries). As a measure of the main independent variable (globalization), the KOF globalization indices are obtained from the KOF Swiss Economic Institute website (see Dreher, Citation2006 and Gygli et al., Citation2019 for a thorough description of this data). This index is composed of three main dimensions: social, economic, and political. As we have mentioned previously, we are only interested in the economic and social dimensions of globalization. Economic globalization is further divided into trade and financial globalization. Most covariates that we use in the analysis are obtained from the World Development Indicators of the World Bank and these are real GDP per capita, population, female labor force participation, and urbanization. Data on urbanization and female labor participation are not available for all countries and/or all years. Finally, the educational component of the HDI (human development index) is obtained from the United Nations and is only available from 1990. lists all data sources in the article. reports the descriptive statistics of all variables in the analysis for the entire and the GCC countries separately. We observe that the GCC countries have on average higher obesity rates than the world average (23.76% versus 12.91%). On the other hand, the GCC countries score on average higher on globalization index and all its individual dimensions. Furthermore, the GCC countries have on average significantly higher GDP per capita levels and urbanization rates, whereas they score slightly higher in the education index, but much lower in female labor force participation rate than the world average. Hence the GCC countries look different from the average country in the world, which suggests that these countries may respond differently to rapid globalization.
Table 1. Data sources.
Table 2. Descriptive statistics of all variables used.
2.1. Recent trends in food imports in the GCC countries
The GCC countries depend on international trade for most of their food consumption. In this section, we explore recent trends in food imports into the GCC countries. Trade data in this exercise are obtained from CEPII (BACI database). Figure A4 (Appendix 1) contrasts the sharp rise in food imports to that of GDP per capita and population over the same period; food imports increase by six folds between 1995 and 2015 against only 2- and 3-fold increase in population and GDP per capita respectively.
Figure A5 (left panel) shows that total food imports into the GCC have increased from less than 10 billion in 1995 to just under 50 billion USD in 2016. Most of the food imports traditionally originate from non-Arab countries but food imports from Arab countries and intra-GCC food imports have also increased in recent years following trade liberalization among these countries.Footnote3 Figure A5 (right panel) plots food imports from the three different sources as indices with 1995 as the base year (1995 = 100). The plot shows that food imports from Arab countries as well as intra-GCC imports grew faster than imports from non-Arab countries in the years that follow trade liberalization (in 1998) among these countries. Both series increased by more than four folds between 1995 and 2008. The Financial crisis of 2008–2009 and the ensuing Arab spring of 2011–2012 clearly had an impact on both series but intra-GCC imports increase exponentially between 2012 and 2016, most probably because of the Arab Spring and the arduous efforts in the GCC countries to boost domestic production as these countries move to diversify their economies (Callen et al., Citation2014). By 2016, both food imports from Arab and non-Arab countries have increased by fivefold whereas intra-GCC imports have increased by close to eightfold.
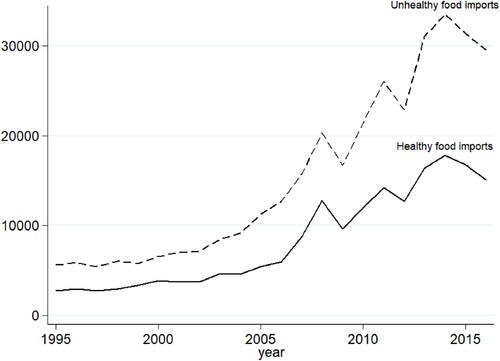
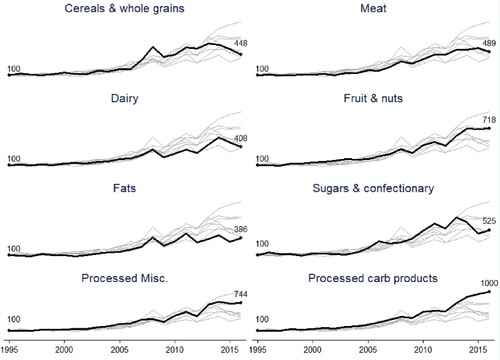
Furthermore, we label products as being either ‘unhealthy or ‘healthy’ at the HS-2digit product classification. The classification is based on the USDA classification of ‘healthy’ foods found in Volpe et al. (Citation2013) and used in Giuntella et al. (Citation2020) (refer to in Appendix 2). plots GCC imports of healthy and unhealthy foods and shows that unhealthy food imports are around double the healthy food imports over the period 1995–2016. Both series move together except in the period 2010–2014 where unhealthy food imports increase faster than healthy food imports. In Figure A6 (Appendix 1), we plot indices of the top eight products imported into the GCC at the HS-2 digit product level in 2016. The figure shows that the products that grow the most are processed carb products (bakery products, pasta, corn flakes) followed by processed miscellaneous products (sauces and soups, ice cream), fruits, vegetables, meat, cereals, dairy, and fats. All of these products are classified as ‘unhealthy’ except for cereals, fruits and vegetables. The evidence in this section thus far suggests that increasing obesity goes hand in hand with increasing food imports and some of the increase is coming from what is classified as ‘unhealthy’ foods. In the next section, we look for econometric evidence that globalization may have had a role in the rising obesity rates in these countries.
Figure 3. GCC food imports (millions USD) of healthy and unhealthy foods. Products are classified as unhealthy based on the USDA classification of unhealthy foods. A list of healthy and healthy products is provided in (Appendix 2). Source: Authors’ own compilation.
3. Econometric evidence for the effect of globalization on obesity rates in the GCC countries
In this section, we use a dynamic panel model with the Arellano–Bond estimator (Arellano & Bond, Citation1991), which is a GMM estimator, to estimate the effects of globalization on obesity in the GCC countries.Footnote4 The estimator uses moment conditions in which deeper lags of the dependent and independent variables are instruments for the first-differenced equation of the level model. GMM is an established technique for models with endogenous variables, in particular lagged dependent variables. In this model, introducing lagged dependent variables helps deal with autocorrelation, which is usually present in cross-section time-series data. In particular, we estimate the following model equation:
(1)
(1)
In the above equation, the dependent variable is the rate of obesity in a country in a given year which is defined as the percentage of people with body-mass index (BMI) of more than 30. On the right-hand side (RHS), we include a set of lags of the dependent variable. The number of lags of the dependent variable to include is determined such that autocorrelation in the residuals is eliminated. This is done by estimating Equationequation (1)(1)
(1) while introducing a higher order of the lagged dependent variable gradually, and test for the first- and second-order autocorrelation (AR(1) and AR(2)) after each estimation. Autocorrelation is eliminated once the null hypothesis of no-autocorrelation is not rejected. We find that this is accomplished after including up to two lags of the dependent variable in our data. The results of these tests are reported in the results tables later on. In addition, the RHS of Equation (1) includes the variables
(the globalization index) and
(an interaction of the globalization index with a dummy variable that indicates whether the observation country is a GCC country) as the main independent variables of interest. The coefficients
will pick up the average effect of globalization on obesity rates in all countries while the coefficients
will pick up the differential effects for the GCC countries relative to all other countries in the control group. As we have mentioned earlier, the KOF globalization index is composed of different sub-indices of which we use the social and economic globalization indices. The economic globalization index is further broken down into financial and trade components. The separate indices are however likely to be highly correlated with one another and this is confirmed by calculating coefficients of correlation for the separate indices in (Appendix 2). We observe that for the entire sample, all underlying indices are highly correlated with each other with coefficients of correlation of more than 70%. The high correlation is even more pronounced when we look at the sample of GCC countries separately, and we calculate coefficients of correlation that are above 95% for all index-pairs. This is why we introduce the underlying globalization indices separately in the estimated regressions. We also control for country-year varying covariates and these are the education component of the HDI index, female labor force participation (the percentage of females in employment), urbanization (percentage of population living in urban areas), and real GDP per capita. In addition, we include the square of GDP per capita because some studies have suggested that the relationship between income and obesity may not be linear. It is worth noting that we do not include the entire HDI index because this index contains health outcomes that are correlated with the dependent variable and hence, we only include the education component of the index because we want to include a measure that captures educational attainment and spending in a country. These variables are included as the matrix
and capture changes related to income and development which are found in the literature to matter for obesity (Goryakin et al., Citation2015; Miljkovic et al., Citation2015; Oberlander et al., Citation2017). The fixed effect
controls for country-specific time-invariant missing factors such as historical factors and
is a year-specific fixed effect that controls for common global economic shocks ad well as other common annual non-observable factors. The fixed effects
will drop out in the first-differenced equation that the GMM estimator automatically estimates. The GCC dummy variable is dropped because we control for country fixed effects. While we have obesity data between 1975 and 2016, including the covariates female labor participation, urbanization, and education limits our sample period to 1990–2016.
In the Arellano–Bond method, deeper lags of the dependent and independent variables are used as instruments in first-differenced equation. The number of lags to include should be selected such that the excluded instruments are (weakly) exogenous or uncorrelated with the error term. This can be tested using the Hansen test for overidentifying restrictions (the null hypothesis is that the overidentifying restrictions are valid). This is an iterative process in which higher order of the lags are included until the null hypothesis test is not rejected. We find that this is accomplished after the 3rd and 4th lags of the dependent variable and the 1st to 3rd lags of the independent variables (excluding the time dummies) are included as GMM instruments. The p-values of the Hansen test will be reported alongside the model estimation results below.Footnote5
3.1. Results
presents the results from estimating equation (1). In specification (1), we include the overall globalization index as the main independent variable. In specifications (2) and (3), we introduce the underlying components of the overall index, namely the social globalization and the economic globalization indices individually, while in specifications (4) and (5), we further break the economic globalization index down to its two underlying components, the financial and trade indices. All estimations use robust standard errors as suggested by Kripfganz (Citation2019) and Roodman (Citation2009).
Table 3. Benchmark results from estimating equation (1) using the Arellano and Bond GMM estimator.
The results suggest that obesity in the GCC countries is affected positively by globalization relative to all other countries in the sample. The coefficients estimated for non-GCC countries are statistically insignificant. Column (1) suggests that overall globalization has a positive effect on obesity rates in the GCC countries relative to all other countries with the coefficient of the interacted term being statistically significant at the 1% significance level. The overall effect for the GCC countries should be calculated as the sum of the estimated coefficients of the KOF globalization index and the interaction between the globalization index and the GCC indicator. Hence, an increase of one point in the globalization index leads to 0.031 percentage point increase in obesity in the GCC countries. Similarly, we calculate that the social, economic, financial, and trade globalization indices all have a net positive effect on obesity rates in the GCC countries when taken individually and here, too, we do not estimate a significant effect in the level globalization variable for non-GCC countries. The magnitude of the net effect differs across the individual indices; a1 point increase in the social and economic globalization indices leads to 0.038 and 0.058 percentage point increases in obesity respectively. The estimated coefficients are statistically significant at the 5% significance level for social globalization and 10% significance level for economic globalization. Within economic globalization trade liberalization has a higher estimated coefficient than financial globalization (0.089 versus 0.049) All other covariates return insignificant coefficients, possibly owning to the fact that much of the variation in the data is eliminated after including two lags of the dependent variable in the dynamic panel model.
3.1.1. Discussion of the results
The above results suggest that all aspects of globalization as measured by the globalization indices have contributed to rising obesity in the GCC countries. Social globalization includes variables that measure a country’s exposure to the outside world such as the quality of internet, the number of mobile subscription, migration, tourism, and the number of MacDonald’s and Ikea stores among other variables. Economic globalization, which is divided into trade and financial globalization, measures important economic liberalization aspects such as trade openness, FDI, and international trade agreements.Footnote6 To put the results in context, we refer to introduced earlier where we plot the different globalization indices for the six GCC countries between 1975 and 2016. One observes that large rises occur in social globalization in most GCC countries. Saudi Arabia’s social globalization index increased from around 30 to 70 and the UAE’s index increased from less than 50 to around 80 over the same period. If one considers the estimated effect of social globalization on obesity from this study, social globalization has contributed to an increase of around 2.3 and 1.74 percentage points in obesity rates in Saudi Arabia and the UAE respectively over the past four decades keeping everything else constant. A similar exercise can be conducted for the other indices with similar significant effects.
Other studies have looked at different groups of countries and for different periods as we have mentioned previously. None of the studies, however, estimate a dynamic panel model as we do, which makes our results difficult to compare with other studies. We believe that our specification is more appropriate because it deals with the existing autocorrelation in the obesity series and the endogeneity of the covariates and missing unobserved variables. Other studies do not address these issues or do so in a limited manner. It is also important to note that in estimating our dynamic panel model, we include two lags of the dependent variable to eliminate autocorrelation. This naturally eliminates much of the variation in the data, which may serve to explain why we don’t find a significant effect of globalization on obesity in non-GCC countries while some other studies do. Nonetheless, compared to some of these studies, our estimate of a positive effect of social globalization on obesity in the GCC countries is similar to the study by Oberlander et al. (Citation2017) who estimate a positive effect of social globalization on average BMI in 70 high and middle income countries using a grouped fixed effects model. The authors also find no effect for trade openness on obesity and, while we also estimate no effect for trade liberalization for all countries in our sample, we do estimate a positive and significant effect for the GCC countries. We, however, find no effect for social globalization on obesity in the sample of non-GCC countries. Oberlander et al. (Citation2017) also do not include controls such as education, female labor force participation, and urbanization in their specification for BMI (they do include them in other specifications with nutritional outcomes as the dependent variables). Vogli et al. (Citation2014) estimate a positive a significant effect for economic globalization (financial and trade) on average BMI in 122 countries. We, however, find no significant effect of economic globalization on average obesity in a much larger sample of countries and for a different period, but we do estimate a positive effect in the case of the GCC countries. The difference is likely to be the result in the size of the sample, the sample time period, the set of covariates included, and the difference in the estimated model. In particular, Vogli et al. (Citation2014) use OLS, fixed, and random effects models to estimate the relationship between globalization and obesity and they do not control for year fixed effects, income level, educational level, or female labor participation. Miljkovic et al. (Citation2015) find a positive effect of social globalization on obesity in a sample of 1986 and 2008. They, however, do not control for income level, urbanization, education, female labor participation, or year fixed effects, which may explain why we do not estimate a positive effect of social globalization in non-GCC countries (along with the different model) while they do. Similar to the previous study, they use a fixed effects model and include quantile regressions in their estimations.
To summarize, in our estimates, the GCC countries respond differently to globalization than the average non-GCC countries. This may be the result of the significant transformation that the GCC societies and economies underwent following the discovery (and exploitation) of the vast oil and gas deposits. The GCC countries, as we have mentioned, have moved from being relatively closed to being highly globalized in a matter of few decades.
3.2. Robustness
In this section, we subject the results to robustness exercises and present these in in Appendix 2. In this table, we only present the estimated coefficients of the different globalization indices, which are estimated in separate regressions as in the benchmark results. In column (1) of the table, we estimate the same dynamic panel model as in the previous section while excluding the squared GDP per capita term. This does not change the results observed earlier in any significant way. In the other columns, we estimate a fixed effects panel model, which is the predominant model of choice in most existing studies. The choice of the fixed versus random effects model comes after we conduct Hausman test, which is a test that can be used for this purpose. The null hypothesis of this test is that the preferred model is random effects. The test leads to the rejection of the null hypothesis, which means that fixed effects is the preferred model (p-value is zero). In column (2), we estimate the fixed effects equivalent of Equationequation (1)(1)
(1) without the lagged dependent variables on the RHS of the equation. In column (3), we introduce a country-specific time trend, which is a count variable that increases incrementally for each consecutive year. In column (4), we introduce 1st lags of the independent variables to account for the possibility that the effects occur with a lag. In column (5), since there may be concerns for cross-sectional dependency in the data given the high level of interconnectedness and integration that some countries experience, we estimate the fixed effects model with Driscoll and Kraay (Citation1998) standard errors, which were shown to be robust to cross-sectional dependency, autocorrelation up to some lag, and heteroscedasticity (Hoechle, Citation2007).Footnote7 These robustness estimations return larger estimated coefficients of the GCC interacted variable and these are generally significant at a higher level of statistical significance. These results still confirm the main results that globalization in its different dimensions contributes to rising obesity in the GCC countries.
4. Conclusion
The GCC countries have seen obesity rates increase sharply in recent decades while these countries have become increasingly integrated in the world economy. In this study, we compare the GCC countries to other world countries and estimate the differential effects of globalization in its various dimensions on obesity rates in these countries. Our choice of a dynamic panel model and the GMM estimator address the problems of autocorrelation in the error term and endogeneity. We find evidence for positive and significant differential effect on obesity coming from globalization with its social and economic dimensions. The results suggest that obesity in the GCC countries is affected by social and economic globalization to a larger degree than other countries.
The results from this study provide evidence that globalization, while desirable in the context of the GCC countries and their attempts to diversify their economies, should receive attention from public health officials in these countries. Since we find that social globalization plays a role in the increasing obesity rates in GCC countries, this suggests that the societies’ exposure to new ideas and cultures may lead to the adoption of certain lifestyles that are conducive to obesity. Similarly, the estimated positive effect of economic globalization on obesity in these countries suggests that freer trade and FDI are affecting the nutritional habits of the populations in a way that promotes obesity. Therefore, public policy has an important role to play in this arena. Since the GCC countries have become major players in international business, attracting millions of expats and tourists as well as trade and investment, health policy actors have the role of raising public awareness of some of the disadvantages globalization. These include the increasing availability of global fast food chains in the GCC countries (many prominent global food chains have presence in the GCC markets), sedentary lifestyles, and continuous exposure to multimedia (through superfast and cheap internet and mobile services). As an example, public campaigns can be held in shopping malls and supermarkets that are habitually frequented by people in these countries to educate the public on the importance of healthy diversified diets and exercise in countering obesity. Since much of the consumed foods are imported in these countries, policy makers have a role in educating the public to read food labels and choose more nutritious, less processed food articles. Policy makers could also work to discourage advertising and promoting less healthy food consumption such as fast food deals and multi-buy deals of unhealthy items in food outlets.
Acknowledgements
Open Access funding provided by the Qatar National Library.
Data availability statement
The ‘obesity’ data that support the findings of this study are available from the World Health Organization (WHO) (https://www.who.int/news-room/fact-sheets/detail/obesity-and-overweight). The ‘KOF Globalization Index’ data are available from ‘KOF Swiss Economic Institute’ (https://kof.ethz.ch/en/forecasts-and-indicators/indicators/kof-globalisation-index.html#). Data on ‘Human Development Index’ (HDI) are available from the ‘United Nations Development Programme’ (http://hdr.undp.org/en/data). Other data used in the paper are available from the ‘World Bank’ (https://databank.worldbank.org/source/world-development-indicators).
Disclosure statement
No potential conflict of interest was reported by the author(s).
Notes
1 For a comprehensive definition of globalization, see Scholte (Citation2008) and Dreher et al. (Citation2008).
2 De facto social globalization covers international voice traffic, internet bandwidth use, transfers, tourism, migration, trade in cultural and personal goods, and availability of MacDonald’s restaurants and IKEA stores (see https://kof.ethz.ch/en/forecasts-and-indicators/indicators/kof-globalisation-index.html).
3 Fourteen Arab countries that include the GCC states signed the Greater Arab Free Trade Agreement (GAFTA) in 1998. The GCC customs union went into force in 2003.
4 The Arellano-Bond estimator can be deployed in STATA using the xtabond2 command.
5 The Hansen-test is favored over the Sargan test since the Sargan test is only appropriate under the assumption of homoskedasticity and no serial correlation (in levels) of the idiosyncratic error term (Roodman, Citation2009).
6 Refer to the website of the KOF Globalization index for the composition of all sub-indices considered (https://kof.ethz.ch/en/forecasts-and-indicators/indicators/kof-globalisation-index.html).
7 This estimation can be implemented in Stata using the xtscc command.
References
- Arellano, M., & Bond, S. (1991). Some tests of specification for panel data: Monte Carlo evidence and an application to employment equations. Review of Economic Studies, 58(2), 277–297. https://doi.org/10.2307/2297968
- Barlow, P., McKee, M., Basu, S., & Stuckler, D. (2017). The health impact of trade and investment agreements: A quantitative systematic review and network co-citation analysis. Globalization and Health, 13(1), 1–9. https://doi.org/10.1186/s12992-017-0240-x
- Caird, J., Kavanagh, J., Oliver, K., Oliver, S., O’Mara, A., Stansfield, C., & Thomas, J. (2011). Childhood obesity and educational attainment: A systematic review.
- Callen, M. T., Cherif, R., Hasanov, F., Hegazy, M. A., & Khandelwal, P. (2014). Economic diversification in the GCC: Past, present, and future. International Monetary Fund. https://www.imf.org/external/pubs/ft/sdn/2014/sdn1412.pdf
- Cohen, A. K., Rai, M., Rehkopf, D. H., & Abrams, B. (2013). Educational attainment and obesity: A systematic review. Obesity Reviews, 14(12), 989–1005. https://doi.org/10.1111/obr.12062
- Colditz, G. A. (1999). Economic costs of obesity and inactivity. Medicine and Science in Sports and Exercise, 31(11 Suppl), S663–S667. https://doi.org/10.1097/00005768-199911001-00026
- Dinsa, G. D., Goryakin, Y., Fumagalli, E., & Suhrcke, M. (2012). Obesity and socioeconomic status in developing countries: A systematic review. Obesity Reviews, 13(11), 1067–1079. https://doi.org/10.1111/j.1467-789X.2012.01017.x
- Dreher, A. (2006). Does globalization affect growth? Evidence from a new index of globalization. Applied Economics, 38(10), 1091–1110. https://doi.org/10.1080/00036840500392078
- Dreher, A., Gaston, N., & Martens, P. (2008). Measuring globalization: Gauging its consequences. Springer.
- Driscoll, J. C., & Kraay, A. C. (1998). Consistent covariance matrix estimation with spatially dependent panel data. Review of Economics and Statistics, 80(4), 549–560. https://doi.org/10.1162/003465398557825
- Ells, L. J., Lang, R., Shield, J. P., Wilkinson, J. R., Lidstone, J. S. M., Coulton, S., & Summerbell, C. D. (2006). Obesity and disability – A short review. Obesity Reviews, 7(4), 341–345. https://doi.org/10.1111/j.1467-789X.2006.00233.x
- Friel, S., Hattersley, L., Snowdon, W., Thow, A. M., Lobstein, T., Sanders, D., Barquera, S., Mohan, S., Hawkes, C., Kelly, B., & Kumanyika, S. (2013). Monitoring the impacts of trade agreements on food environments. Obesity Reviews, 14, 120–134. https://doi.org/10.1111/obr.12081
- Gates, D. M., Succop, P., Brehm, B. J., Gillespie, G. L., & Sommers, B. D. (2008). Obesity and presenteeism: The impact of body mass index on workplace productivity. Journal of Occupational and Environmental Medicine, 50(1), 39–45. https://doi.org/10.1097/JOM.0b013e31815d8db2
- Gaulier, G., & Zignago, S. (2010). BACI: International trade database at the product-level. The 1994–2007 version (CEPII Working Paper 2010-23). CEPII.
- Giuntella, O., Rieger, M., & Rotunno, L. (2020). Weight gains from trade in foods: Evidence from Mexico. Journal of International Economics, 122, 103277. https://doi.org/10.1016/j.jinteco.2019.103277
- Goryakin, Y., Lobstein, T., James, W. P. T., & Suhrcke, M. (2015). The impact of economic, political and social globalization on overweight and obesity in the 56 low and middle income countries. Social Science & Medicine, 133, 67–76. https://doi.org/10.1016/j.socscimed.2015.03.030
- Gygli, S., Haelg, F., Potrafke, N., & Sturm, J. E. (2019). The KOF globalisation index – Revisited. The Review of International Organizations, 14(3), 543–574. https://doi.org/10.1007/s11558-019-09344-2
- Hawkes, C. (2006). Uneven dietary development: Linking the policies and processes of globalization with the nutrition transition, obesity and diet-related chronic diseases. Globalization and Health, 2(1), 4. https://doi.org/10.1186/1744-8603-2-4
- Hawkes, C., & Thow, A. M. (2008). Implications of the Central America-Dominican republic-free trade agreement for the nutrition transition in Central America. Revista Panamericana de Salud Pública, 24(5), 345–360. https://doi.org/10.1590/S1020-49892008001100007
- Himes, C. L., & Reynolds, S. L. (2012). Effect of obesity on falls, injury, and disability. Journal of the American Geriatrics Society, 60(1), 124–129. https://doi.org/10.1111/j.1532-5415.2011.03767.x
- Hoechle, D. (2007). Robust standard errors for panel regressions with cross-sectional dependence. The Stata Journal, 7(3), 281–312. https://doi.org/10.1177/1536867X0700700301
- Kripfganz, S. (2019, September 5–6). Generalized method of moments estimation of linear dynamic panel data models. Proceedings of the 2019 London Stata Conference.
- Miljkovic, D., de Miranda, S. H., Kassouf, A. L., & Oliveira, F. C. (2018). Determinants of obesity in Brazil: The effects of trade liberalization and socio-economic variables. Applied Economics, 50(28), 3076–3088. https://doi.org/10.1080/00036846.2017.1414939
- Miljkovic, D., Shaik, S., Miranda, S., Barabanov, N., & Liogier, A. (2015). Globalisation and obesity. The World Economy, 38(8), 1278–1294. https://doi.org/10.1111/twec.12260
- Oberlander, L., Disdier, A. C., & Etilé, F. (2017). Globalisation and national trends in nutrition and health: A grouped fixed-effects approach to intercountry heterogeneity. Health Economics, 26(9), 1146–1161. https://doi.org/10.1002/hec.3521
- Popkin, B. M. (2006). Technology, transport, globalization and the nutrition transition food policy. Food Policy, 31(6), 554–569. https://doi.org/10.1016/j.foodpol.2006.02.008
- Potrafke, N. (2015). The evidence on globalisation. The World Economy, 38, 509–552. https://doi.org/10.1111/twec.12174
- Rayner, G., Hawkes, C., Lang, T., & Bello, W. (2006). Trade liberalization and the diet transition: A public health response. Health Promotion International, 21(Suppl_1), 67–74. https://doi.org/10.1093/heapro/dal053
- Roodman. (2009). How to do xtabond2: An introduction to difference and system GMM in Stata. Stata Journal, 9(1), 86–136. https://doi.org/10.1177/1536867X0900900106
- Scholte, J. A. (2008). Defining globalisation. World Economy, 31(11), 1471–1502. https://doi.org/10.1111/j.1467-9701.2007.01019.x
- Schrecker, T., Labonté, R., & De Vogli, R. (2008). Globalisation and health: The need for a global vision. The Lancet, 372(9650), 1670–1676. https://doi.org/10.1016/S0140-6736(08)61691-8
- Thow, A. M., & Hawkes, C. (2009). The implications of trade liberalization for diet and health: A case study from Central America. Globalization and Health, 5(1), 5. https://doi.org/10.1186/1744-8603-5-5
- Thow, A. M., Swinburn, B., Colagiuri, S., Diligolevu, M., Quested, C., Vivili, P., & Leeder, S. (2010). Trade and food policy: Case studies from three Pacific Island countries. Food Policy, 35(6), 556–564. https://doi.org/10.1016/j.foodpol.2010.06.005
- Vogli, R. D., Kouvonen, A., Elovainio, M., & Marmot, M. (2014). Economic globalization, inequality and body mass index: A cross-national analysis of 127 countries. Critical Public Health, 24(1), 7–21. https://doi.org/10.1080/09581596.2013.768331
- Volpe, R., Okrent, A., & Leibtag, E. (2013). The effect of supercenter-format stores on the healthfulness of consumers’ grocery purchases. American Journal of Agricultural Economics, 95(3), 568–589. https://doi.org/10.1093/ajae/aas132
Appendix
Appendix 1. Appendix figures
Figure A1. KOF Social Globalization Index (0–100) in the GCC countries between 1975 and 2016. ARE stands for United Arab Emirates; BHR for Bahrain; KWT for Kuwait; OMN for Oman; QAT for Qatar; and SAU for Saudi Arabia. Source: Authors’ own compilation based on raw data from KOF Swiss Economic Institute.
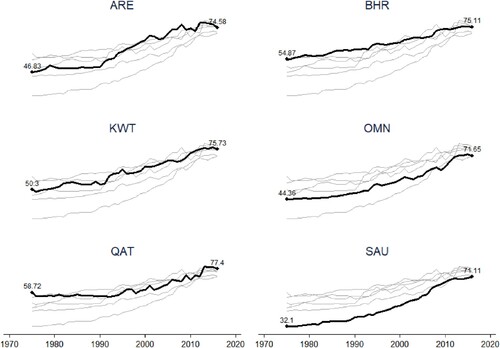
Figure A2. KOF Economic Globalization Index (0–100) in the GCC countries between 1975 and 2016. ARE stands for United Arab Emirate; BHR for Bahrain; KWT for Kuwait; OMN for Oman; QAT for Qatar; and SAU for Saudi Arabia. Source: Authors’ own compilation based on raw data from KOF Swiss Economic Institute.
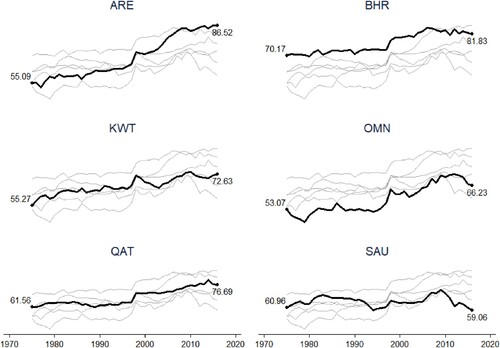
Figure A3. Obesity rates (percentages of populations) in the GCC countries between 1975 and 2016. ARE stands for United Arab Emirate; BHR for Bahrain; KWT for Kuwait; OMN for Oman; QAT for Qatar; and SAU for Saudi Arabia. Source: Authors’ own compilation based on raw data from the WHO.
Figure A4. Food imports, population, and GDP per capita indices in the GCC countries between 1995 (= 100) and 2016. Authors’ own compilation based on raw data from the World Bank.
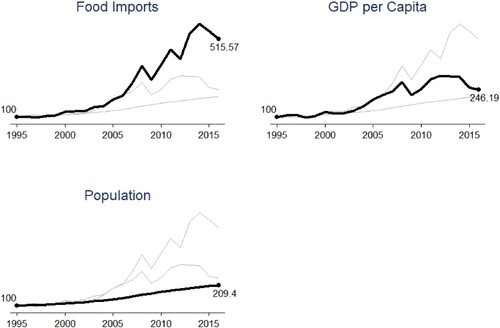
Figure A5. Food imports in the GCC countries from various sources between 1995 and 2016. Authors’ own compilation based on trade data from CEPII (BACI).
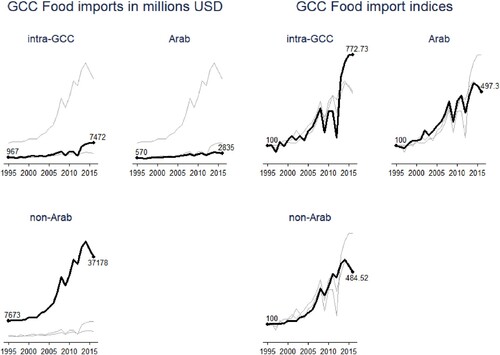
Figure A6. Indices of the top eight products (HS-2 digit) imported into the GCC between 1995 (= 100) and 2016. Authors’ own compilation.
Appendix 2. Appendix tables
Table A1. List of countries in the sample.
Table A2. List of HS-2 products classified as healthy or unhealthy.
Table A3. Coefficients of correlation of the underlying globalization indices.
Table A4. Robustness checks.