
Abstract
The aim of the study was to test the effect of different dietary energy sources on several blood biochemical parameters on aqua treadmill trained show jumpers. Four horses in latin square arrangements consumed identical amounts of meadow hay, and four concentrates differing mainly in their energy source (control, starch from oat, oil from sunflower and sugar from sugar beet molasses) but providing the same amount of energy. One experimental period consisted of a 10 day adaptation and 4 day test period involving deep water aqua treadmill training. Blood samples were taken during and after the last aqua treadmill training and lactate, lactate dehydrogenase, creatine kinase, aspartate aminotransferase, glucose and triglycerides levels were determined from the plasma. The different dietary energy sources resulted in similar plasma lactate levels. The increased starch content of the feed resulted in significantly lower (p < 0.05) creatine kinase level at the end of the first walking section of aqua training. This result appeared later as a tendency (p ≤ 0.1). Horses fed sunflower oil as a main energy source had higher aspartate aminotransferase level after two hours of the aqua training. The plasma triglyceride concentration in the sunflower oil group tended (p < 0.1) to be lower at the end of aqua training; while one hour after the training it was significantly lower. The elevated level of creatine kinase and aspartate aminotransferase indicates that lactate does not correctly reflect the strenuousness of the aqua training. The dietary energy source modifies the metabolic response to aqua training, even if it is not considerable.
Keywords:
Introduction
A proper energy supply has a primary importance for the equine athlete (Pagan Citation1998). The source of energy has an influence on health, metabolism and sport performance (Harris Citation2009). Therefore, the preference of energy sources depends on the type, intensity and length of the workload. Several publications demonstrate the effect of carbohydrates and fats as energy sources on various blood parameters in horses (Pagan & Jackson Citation1995; Pagan et al. Citation1995; Spangfors Citation1998; O’Connor et al. Citation2001; Treiber et al. Citation2008). Research results show that the training of horses in water could be a good alternative or supplement to conventional training (Nankervis et al. Citation2009; Lindner et al. Citation2010). However, it is also demonstrated that the cooling effect of water markedly alters the metabolic response of horses to aqua training measured by various plasma biochemical parameters (Hevesi et al. Citation2009; Lindner et al. Citation2012). Thus, it can be hypothesised that the plasma biochemical response altered by different dietary energy sources when deep water aqua exercise is part of the training program. The daily rations of equine athletes should include a mixture of energy sources (starch, fat, fibre) in a balance (Pagan Citation1998). Any extremes (e.g. unbalanced energy supply) should be avoided. Therefore, the aim of this study was to examine the effect of different main dietary energy sources on several blood biochemical parameters on high level aqua treadmill trained show jumpers using the energy source more diffused under field conditions.
Materials and methods
Experimental animals
Four normally trained show jumpers aged from 6 to 11 years were used in the test at the Pannon Equestrian Academy, Kaposvár University, Hungary. Gender was not considered in the selection of the animals tested.
Treatments
Four dietary treatments were formulated and applied in a Latin square design. The horses consumed an identical amount of meadow hay, but four daily concentrate portions were formulated () to provide different main energy sources but an identical amount of digestible energy (). The control group received the concentrate normally fed in the structure, while the three other concentrates provided an elevated level of starch, total sugar and fat, respectively. The daily nutrient supply was sufficient or in excess to a horse with medium exercise intensity (National Research Council Citation2007). Water and salt blocks were freely available to the horses. No variance in salt consumption was noticed. One experimental period consisted of a 10 day adaptation and 4 day test period involving deep water aqua treadmill training. The relatively small difference between dietary treatments made it possible to change the diets without a transition period.
Table 1. Feed allowance and composition of treatment groups (kg).
Table 2. Daily nutrient intake of the treatment groups with hay and concentrate.
Training program
The horses were trained according to the schedule presented in . Normal training was one hour with a rider, while jumping training was half an hour warming up and half an hour jumping with a rider. The protocol of the 44 minute long aqua training and blood sampling is reported in . During the aqua treadmill training the temperature of the water was 21 °C, while the level of the water was set to 85% of the height at the withers. The temperature of the water was kept in reserve tanks on 21 °C constantly with a circular heating system to perform the same protocol. This program lasted 44 minutes and after the training the horses were dried under infra-red lamps for 20 minutes. The horses were then taken back to the stable.
Table 3. Training program of the 14 day experimental periods.
Table 4. Schedule of the aqua training and blood sampling.
Blood sampling
4 ml blood samples were taken during day 14 of the aqua treadmill training program at the time indicated in . These samples were taken from the jugular vein via catheters and placed in sampling tubes containing NaF-oxalate or Na-heparine. The blood samples were stored on ice until centrifugation. The samples were centrifuged at 3000 rpm for 3 minutes. Plasma was pipetted to an Eppendorf tube and stored at a temperature of −18 °C until the analysis.
Laboratory analysis
All feed components used in the trial was sampled and analysed for crude protein (93/28/EEC), crude fibre (92/89/EEC), crude fat (98/64/EC), total sugar (71/250/EEC) and starch (99/79/EC) content. The DE content of feed components was calculated according to the equation of Zeyner and Kienzle (Citation2002). From the blood plasma samples lactate, lactate dehydrogenase (LDH), creatine kinase (CK), aspartate aminotransferase (AST), glucose and triglyceride levels were determined using the Roche Modular SWA (Hoffmann-La Roche Ltd.) measuring system.
Statistical analysis
The experimental data were evaluated by the SAS 9.1 (SAS Institute Inc., Cary, NC) statistical software package using the GLM procedure. The blood parameter values measured at rest (before exercise – T0) were used as a covariate in the course of the statistical analyses. In case of significant treatment effect mean differences were tested by a Ducan’s multiple range test.
Results and discussion
The measured lactate values () suggest that the energy requirement of aqua treadmill training was ensured by an aerobic energy supply, since the measured values were below the generally accepted anaerobic threshold of 2 mmol/l (Eaton Citation1994). Training with higher speed (19.8 km/h) but with similar water level (80% of the height of the withers) resulted in similar lactate levels (Lindner et al. Citation2012) compared to our observations. Lower water levels at the same treadmill speed results in higher lactate values (Lindner et al. Citation2010). Similar to other studies (Hevesi et al. Citation2009; Vincze et al. Citation2012), plasma lactate levels did not increase during the high level aqua treadmill training, but only after the workout. Studies have shown that the temperature of the water can alter the heart beat (Nankervis et al. Citation2009), and according to these results, based on the evolution of lactate levels, it can be concluded that the lower temperature of the water (21 °C) below that of body temperature reduces the production of lactic acid through anaerobic glycolysis by reducing the temperature of the muscles. The thermoneutral zone for horses has not been established yet (Lindner et al. Citation2012), but in humans, this value ranges from 33 to 35 °C (Choukroun & Varene Citation1990). These values are likely to be lower in horses (Nankervis et al. Citation2009), but most probably higher than the temperatures we applied. These results suggest that the lactate response depends not only on the speed of the treadmill, but also on the level of the water as well.
Figure 1. Effect of dietary main energy source on the plasma lactate levels of equine athletes during and after deep water aqua treadmill training
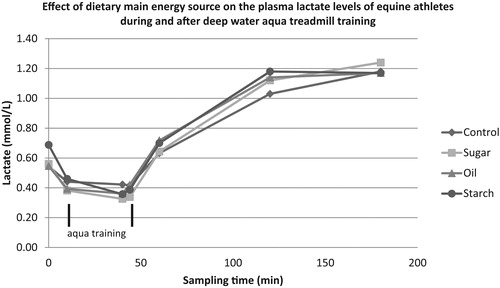
The dietary fat content can be utilised only in the aerobic energy yielding processes, while the starch can be used in both an aerobic and anaerobic way (Pagan Citation1998). The training program failed to induce the need for an anaerobic energy supply, and this could also explain the lack of differences in plasma lactate level between fat and starch treatments (). A similar conclusion was reached using corn and fish oil supplementation (O’Connor et al. Citation2001). Ultimately, it seems that horses around the age of 7 years and having good fitness express a high activity of lactate clearance to prevent the formation of significant peaks of this metabolite in plasma. This is supported by the elevated lactate dehydrogenase level (647–732 U/L; data not presented) compared to the reference range (162-412 U/L; Kaneko et al. Citation2008) and the fact that neither treatments nor aqua training had a significant effect on the LDH development.
The increased starch content of the feed resulted in a significantly lower (p = 0.002) creatine kinase level at the 10th minute of high level aqua training (at the end of the first walking section) (). This result appeared as a tendency (p ≤ 0.1) at the 44, 120 and 180 minutes sampling as well. Various reference values exist for CK: 11–130 U/L (Lumsden et al. Citation1980) and 90–270 U/L (Southwood Citation2013). The values we found fall into the upper range, and no exercise induced increase can be observed (). Interestingly, significantly lower CK values were measured in show jumpers performing in higher class competitions (Art et al. Citation1990a,Citation1990b). Other experimental results also indicate that excessive training does not result in an increase of CK activity (Harris et al. Citation1997; Hamlin et al. Citation2002). Moreover, the show jumping test failed to further increase elevated CK level due to muscle biopsy (Soares et al. Citation2013). Pritchard et al. (Citation2009) established a reference value of 210 U/L for working horses in Lahore (Pakistan). According to their explanation, the relatively high value is probably the result of low-level but chronic muscle injuries (caused by the actual everyday work done by these horses), and not a reversible result of a single exhaustive exercise bout. These observations indicate that horses subject to regular but relatively short intensive exercises could have chronic muscle damage which results in a somewhat elevated CK level (about 200–300 U/L). Only prolonged endurance exercise (60 km or more) can result in very high levels of CK (1000–30 000 U/L) (Kerr & Snow Citation1983; Volfinger et al. Citation1994; Adamu et al. Citation2013). The increase of CK activity can be the result of muscle cell damage or increased cell membrane permeability. Only CK activity higher than 10 000 U/L presents some evidence of myolysis (Volfinger et al. Citation1994). Therefore, in our case, the increased muscle cell membrane permeability caused the elevated CK activity. It can be concluded, that the intensity of the training program (including deep water aqua training) was high enough to achieve that increase in cell membrane permeability. The explanation for differences in reference values (Lumsden et al. Citation1980; Southwood Citation2013) can be the different training level of the subjects tested.
Table 5. Effect of dietary main energy source on the plasma creatine kinase levels (U/L) of equine athletes during and after deep water aqua treadmill training.
Horses having sunflower oil as a main energy source in their concentrate had higher aspartate aminotransferase enzyme level after two hours of the aqua training (). This difference appears as a tendency at the end of the walking sections as well. The measured levels of AST fall within the wide range of reference values set for sport horses (Kaneko et al. Citation2008; Lumsden et al. Citation1980; Southwood Citation2013). Significantly lower AST values were observed in higher class show jumping horses (Art et al. Citation1990a,Citation1990b) compared to our results. However, in English Thoroughbred horses with good racing results continuously elevated (around 300 U/L) AST values were found (Harris et al. Citation1990). Oliveira et al. (Citation2014) measured AST levels well above 300 U/L in eventing horses tested on treadmill. Most of our measured AST values are close to the 300 U/L activity. As also AST mainly released from muscle, the simultaneously elevated AST and CK levels indicate a strenuous exercise. Horses fed a starch enriched diet expressed lower CK at T2 and AST at T6; and tended to express lower CK at T3, T5, T6 and AST at T1, T3 sampling compared to other treatments. These results suggest that starch as an energy source may improve the muscles' ability to cope with strenuous exercise, although the physiological background is still unclear.
Table 6. Effect of dietary main energy source on the plasma aspartate amino transferase levels (U/L) of equine athletes during and after deep water aqua treadmill training.
The dietary treatments resulted in similar plasma glucose concentrations (). The measured concentrations were within the reference values for horses (Kaneko et al. Citation2008; Southwood Citation2013). Experimental results have demonstrated that when carbohydrates are substituted with fat (oil) on isocaloric bases, the blood glucose and insulin levels decrease (Pagan et al. Citation1995; Stull et al. Citation1987). Lower glucose levels were observed after dry treadmill training of Thoroughbreds when 15% of the daily energy intake was provided as oil (Crandell et al. Citation1998). In our experiment, horses in the sunflower oil treatment group received about 11.5% of their daily energy intake as vegetable oil. The difference between the two energy supply levels as oil is not considerable, so it does not justify the lack of effect. Therefore most likely the cooling effect of water is responsible for that metabolic response. When oil substitutes soluble carbohydrates (starch, sugar) in the feed the adaptation processes reduce the glucose substrate dependence of the work (Treiber et al. Citation2008). This mechanism slows down the depletion of glycogen stores during long and strenuous work, preventing the development of metabolic dysfunction such as insulin resistance. The quality (fatty acid composition) of the dietary fat source also modifies the glucose metabolism. Fish oil supplementation resulted in lower glucose levels compared to the corn oil fed group (O’Connor et al. Citation2001). As none of the above mentioned experiments applied to sunflower oil treatment of our study, we can only speculate that the plasma glucose lowering effect may depend on the fatty acid composition of the dietary fat.
Table 7. Effect of dietary main energy source on the plasma glucose levels (mmol/L) of equine athletes during and after deep water aqua treadmill training.
The plasma triglyceride concentration in the sunflower oil group tended (p < 0.1) to be lower at the end of aqua training (sampling time T3 and T4; ); while one hour after the training it was significantly lower compared to the other treatment groups. The triglyceride values measured in our trial were similar to those found for Thoroughbred racehorses (0.17–0.38 mmol/l; Li et al. Citation2012). Since the median of these values were more than twice as high as the control group of moderately exercised riding horses (0.284 vs. 0.128 mmol/l), the authors assumed that the racehorses exhibited an increased rate of lipid mobilisation. This explanation is supported by the result that triglyceride concentration increases during exercise as a function of the exercise intensity (Pösö & Hyyppa Citation1999). These results suggest that the muscles of racehorses adapt to high intensity exercise by gaining higher oxidative capacity and an increased capacity for fat utilisation as an energy source (Li et al. Citation2012). Based on that, we can conclude that the aqua treadmill training we applied can induce a similar triglyceride response, such as the Thoroughbreds’ response to conventional training. Trained horses adapted to fat supplementation promote greater flexibility in the selection of substrate for exercise demand (Treiber et al. Citation2006, Citation2008). We believe that this adaptation was reflected in the lower plasma triglyceride level of the fat-supplemented group.
Table 8. Effect of dietary main energy source on the plasma triglyceride levels (mmol/L) of equine athletes during and after deep water aqua treadmill training.
Conclusions
Even the moderate difference in dietary energy supply of which could occur in practice can significantly modify some of the plasma blood parameters of equine athletes; however, the magnitude of these modifications is usually not considerable. A clear preference for any energy yielding substrate cannot be established; however some results indicate that higher starch content may help to reduce chronic muscle damage. It is clear that the training in water through its cooling effect results in markedly different lactate curves and values compared to conventional training. Therefore, the most often used lactate level is not a valid indicator of the workload strenuousness. Thus, other plasma parameters reflecting the workload like CK and AST should be examined as well.
Disclosure statement
The authors report no conflicts of interest. The authors alone are responsible for the content and writing of this article.
References
- Adamu L, Noraniza MA, Rasedee A, Bashir A. 2013. Effect of age and performance on physical, hematological, and biochemical parameters in endurance horses. J Equine Vet Sci. 33:415–420.
- Art T, Amory H, Desmecht D, Lekeux P. 1990a. Effect of show jumping on heart rate, blood lactate and other plasma biochemical values. Equine Vet J. 32:78–92.
- Art T, Desmecht D, Amory H, Delonge O, Buchet M, Leroy P, Lekeux P. 1990b. A field study of post-exercise values of blood biochemical constituents in jumping horses: relationship with score, individual and event. Zentralbl Veterinarmed A . 37:231–239.
- Choukroun ML, Varene P. 1990. Adjustments in oxygen transport during head-out immersion in water at different temperatures. J Appl Physiol. 68:1475–1480.
- Crandell KM, Pagan JD, Harris PA, Duren SE. 1998. A comparison of grain, vegetable oil and beet pulp as energy sources for the exercised horse. Proceedings of the 5th International Conference on Equine Exercise Physiology, Utsunomiya, Japan, p. 487.
- Eaton MD. 1994. Energetics and performance. In: Hodgson DR, Rose RJ, editors. The athletic horse. Philadelphia: WB Saunders Company, p. 49–61.
- Hamlin MJ, Sherman JP, Hopkins WG. 2002. Changes in physiological parameters in overtrained Standardbred racehorses. Equine Vet J. 34:383–388.
- Harris P. 2009. Feeding management of elite endurance horses. Vet Clin North Am Equine Pract. 25:137–153.
- Harris DB, Harris RC, Wilson AM, Goodship A. 1997. ATP loss with exercise in muscle fibres of the gluteus medius of the thoroughbred horse. Res Vet Sci. 63:231–237.
- Harris PA, Snow DH, Greet TR, Rossdale PD. 1990. Some factors influencing plasma AST/CK activities in Thoroughbred racehorses. Equine Vet J. S9:66–71.
- Hevesi Á, Stanek C, Veres S, Ütö D, Vasko M, Seregi J, Keller É, Erdélyi E, Repa I, Hodossy TL, Liposits B. 2009. Comparison of the changes of in situ measured plasma Lactate-levels during the same moderate exercise in high water aquatrainer and on tread-mill in show jumpers. Proceedings des Journées Annuelles de l'Association Vétérinaire Equine, Deauville, France, p. 442.
- Kaneko JJ, Harvey JW, Bruss ML. 2008. Clinical biochemistry of domestic animals (sixth edition). Burlington: Elsevier Inc.
- Kerr MG, Snow DH. 1983. Plasma enzyme activities in endurance horses. In: Snow DH, Persson SGB, Rose RJ, editors. Equine Exercise Physiology. Cambridge: Granta Edition, p. 432–440.
- Li G, Lee P, Mori N, Yamamoto I, Arai T. 2012. Long term intensive exercise training leads to a higher plasma malate/lactate dehydrogenase (M/L) ratio and increased level of lipid mobilization in horses. Vet Res Comm. 36:149–155.
- Lindner A, Waschle S, Sasse HHL. 2010. Effect of exercise on a treadmill submerged in water on biochemical and physiological variables of horses. Pferdeheilkunde 26:781–788.
- Lindner A, Waschle S, Sasse, H.H.L. 2012. Physiological and blood biochemical variables in horses exercising on a treadmill submerged in water. J Anim Physiol Anim Nutr (Berl). 96:563–569.
- Lumsden JH, Rowe R, Mullen K. 1980. Hematology and biochemistry reference values for the light horse. Can J Comp Med. 44:32–42.
- Nankervis KJ, Thomas S, Marlin DJ. 2009. Effect of water temperature on heart rate of horses during water treadmill exercise. Comp Exerc Physiol. 5:127–131.
- National Research Council. 2007. Nutrient requirement of horses. 6th rev. ed. Washington (DC): National Academy Press.
- O’Connor CI, Lawrence LM, Lawrence AST, Hayes S. 2001. The effect of fish oil supplementation on exercising horse. In: Pagan JD, editor. Advances in equine nutrition. Nottingham: Nottingham University Press. p. 141–148.
- Oliveira, C.A.A., Azevendo JF, Miranda, A.C.T., Souza BG, Ramos MT, Costa, A.P.D., Baldani CD, Silva VP, Almeida FQ. 2014. Hematological and blood gas parameters’ response to treadmill exercise test in eventing horses fed different protein levels. J Equine Vet Sci. 34:1279–1285.
- Pagan JD. 1998. Energy and the performance horse. In: Pagan JD, editor. Advances in equine nutrition. Nottingham: Nottingham University Press. p. 141–148.
- Pagan JD, Burger I, Jackson SG. 1995. The long term effects of feeding fat to 2 year old thoroughbreds in training. Equine Vet J. 18S:343–348.
- Pagan JD, Jackson SG. 1995. Responses of blood glucose, lactate and insulin in horses fed equal amounts of grain with or without added soy bean oil. Proceedings of the 14th Equine Nutrition and Physiology Society Symposium, Ontario, Canada. p. 13.
- Pösö, A.R., Hyyppa S. 1999. Muscle and hormonal changes after exercise in relation to muscle glycogen concentrations. Equine Vet J. 30S:332–336.
- Pritchard JC, Burn CC, Barr ARS, Whay HR. 2009. Haematological and serum biochemical reference values for apparently healthy working horses in Pakistan. Res Vet Sci. 87:389–395.
- Soares OAB, D’Angelis FHF, Feringer Junior WH, Nardi KB, Trigo P, Almeida FQ, Miranda ACT, Querioz-Neto A, Ferraz GC. 2013. Serum activity of creatine kinase and aminotransferase aspartate enzymes of horses submitted to muscle biopsy and incremental jump test. Rev Bras Saúde Prod Anim. 14:299–307.
- Southwood LL. 2013. Practical guide to equine colic. Ames (USA): Wiley-Blackwell.
- Spangfors P. 1998. Blood analyses and its relationship to feeding the performance horse. In: Pagan JD, editor. Advances in equine nutrition. Nottingham: Nottingham University Press. p. 167–180.
- Stull CL, Rodiek AV, Arana MJ. 1987. The effects of common equine feeds on blood levels of glucose, insulin and cortisol. Proceedings of the 10th Equine Nutrition Physiology Symposium. p. 61–66.
- Treiber KH, Geor RJ, Boston RC, Hess TM, Harris PA, Kronfeld DS. 2008. Dietary energy source affects glucose kinetics in trained Arabian geldings at rest and during endurance exercise. J Nutr. 138:964–970.
- Treiber KH, Hess TM, Kronfeld DS, Boston RC, Geor RJ, Friere M, Silva AMGB, Harris PA. 2006. Glucose dynamics during exercise: dietary energy sources affect minimal model parameters in trained Arabian geldings during endurance exercise. Equine Vet J. 36S:631–636.
- Vincze A, Szabó, CS, Hevesi Á, Veres S, Ütő D. 2012. The effect of workload type and baseline covariate on the response of plasma biochemical parameters in show jumpers. Acta Agriculturae Slovenica 3S:317–321.
- Volfinger L, Lassourd V, Michaux JM, Braun JP, Toutain PL. 1994. Kinetic evaluation of muscle damage during exercise by calculation of amount of creatine kinase released. Am J Physiol 266:434–441.
- Zeyner A, Kienzle E. 2002. A method to estimate digestible energy in horse feed. J Nutr. 132:1771–1773.