
Abstract
Sheep are an important livestock species in the socio-economic contest around the world. In the past, exotic sheep breeds were utilised in crosses with local breeds in order to improve their production traits. The Pagliarola is an ancient sheep population spread over many areas of the central Italy, mainly in Abruzzo region. The aim of this paper was to identify this breed from other sheep breeds living in the same area trough morphological and genetic characterisation. Fifty-three Pagliarola sheep animals (two flocks) were sampled together with 30 sheep of Appenninica, Gentile di Puglia and Merinizzata Italiana. Biometrical measures and 25 microsatellite markers were studied for the characterisation. In the morphological analysis, the Pagliarola was observed to be well separated from the other breeds and the genomic results confirmed the morphological study. In the molecular approach, a total of 330 alleles were detected. In the neighbour-Net tree, each breed clustered independently and no clear cluster was observed. The expected heterozygosity was the highest in Appenninica (0.78), while Pagliarola had the lowest (0.70). Results of STRUCTURE analyses at K=5 showed Pagliarola breed splitted in two sub-clusters. Both biometric and molecular results allow to consider the residual Pagliarola as an original genotype. Moreover, the variability still remaining in this population can be useful to plan suitable conservation programs.
Introduction
Sheep are an important livestock species in the socio-economic contest all over the world’s (FAO Citation2011). In the past years, cosmopolitan specialised breeds were crossed with local breeds in order to improve their productive performance in milk yield and quality, meat, wool, etc. (Buduram Citation2004). This crossbreeding resulted in replacement and genetic dilution of autochthonous breeds with the exotic ones (Sarti et al. Citation2006; Köhler-Rollefson et al. Citation2009). In this context, breeds preservation can be considered a tool for the environment safeguard and for the human presence in hard areas (de Rancourt et al. Citation2006). As a matter of fact, the local breeds by comparison with cosmopolitan sheep have good environment adaptability and their products often have higher economical value (Ajmone-Marsan & GLOBALDIV Consortium Citation2010).
The Pagliarola breed is an ancient sheep population spread over many areas of the central Italy, mainly in Abruzzo region (Bonadonna Citation1976), appertaining to the Appenninica breeds bunch together with Bariscianese, Pomarancina, Perugina, Pecora dell’Amiata, Todina and Vissana (extinct) (Bonadonna Citation1976; Marchi & Mascheroni Citation1925). These populations were never selected for some special purpose, but in the last 20 years, they were crossed with meat breeds, mainly Bergamasca, giving rise to the actual Appenninica breed (Sarti et al. Citation2002).
Up to the 1950s of the last century, these sheep were traditionally reared in the same flocks with Gentile di Puglia but the management conditions of the two breeds were different; the last one was in fact transhumant from the Appennine hills to the Apulian lowland, on the contrary, Pagliarola was resident in the mountain villages all year round (Renieri et al. Citation1984a). During the severe winter season, Pagliarola breed was usually supplemented with “paglia” (straw) and this derived their actual name. The number of these sheep has dropped dramatically, due to their low productivity in comparison with other highly specialised breeds in the last decades. However, that at the present time, only few small flocks are still surviving in very hard environmental conditions.
There are many reasons to conserve Pagliarola, such as the historical background, the morphological uniqueness and the ability to give traditional products. The products of Pagliarola are lamb, cheese and ricotta by milk obtained on the very high mountains pastures, but the most typical one is the “mucisca”: a dried salted or smoked sheep low-fat meat cut in small stripes (Cesari Sartori Citation2005). Mucisca is very interesting from the ethnological point of view; it is in fact a heritage of the Arabian domination in Italian peninsula as the name is presumed to originate from the word “mosammed” (very strong). Dried meat is popular in the east Mediterranean region and is known as “Pastirma” (Turkey and Egypt), “Kayseri pastirmasi” (central Anatolia) and “Rumeli pastirmasi”(Balcan area) (Wright Clifford Citation1999).
According to the Italian Sheep Association Statistics, Pagliarola was the most abundant sheep breed in Abruzzo region in 1971 (Renieri et al. Citation1984b); in the following years, their number decreased dramatically, because of the low specialisation and also because of the anthropological revolution that cancelled the human presence from the territories where it was reared. As already reported before, only few little flocks survive in remote areas, therefore, there are logistic difficulties in Pagliarola sampling. In addition, these sheep are often owned by old shepards not really available to cooperate in any way.
In the recent years, several microsatellite studies on sheep genetic diversity, population structure and phylogenetic reconstruction were carried out in order to provide information about the status of the endangered populations, as well as to develop genetic conservation strategies (Gizaw et al. Citation2007; Ligda et al. Citation2009; Tolone et al. Citation2012; Kunene et al. Citation2014).
The aim of this paper was to carry out a morphological and genetic characterisation of Pagliarola in order to define it from other sheep breeds living in the same area. Starting from these results, it will be considered the opportunity to apply conservation programs to preserve the Pagliarola population, also through its products valorisation.
Materials and methods
Animals
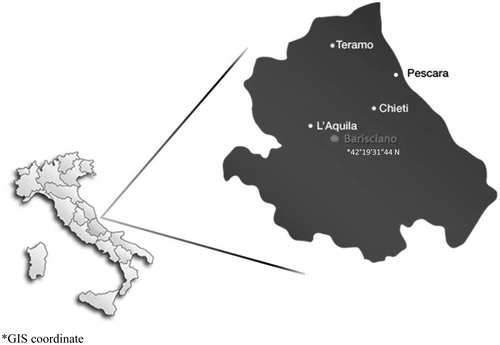
Fifty-four animals (five rams and 49 sheep) from two flocks (43 and 11 animals, respectively) were sampled. The two flocks were both located in Barisciano (Abruzzo region), but no animal exchanges occurred between them; therefore, they can be considered two different closed populations of the same breed. indicates the geographical area where the samples were taken. It has to be noted that this territory is exactly the one where Pagliarola was very popular years ago and, therefore, the sampled sheep can be considered very representative of the population. The samples were collected avoiding closely related individuals on the basis of genealogical information supplied from the breeders. In order to ascertain the morphological uniqueness of Pagliarola (PA) from the other sheep breeds living in the same area or sharing the ethnological history also Appenninica (AP), Gentile di Puglia (GE) and Merinizzata Italiana (ME) individuals (only female, 30 samples for each breed) were considered in the studied sample. As already reported before, the first one is presumed to be originated from Pagliarola; moreover, Pagliarola was reared in the same flocks with Gentile di Puglia and Merinizzata. With regard to the AP, GE and ME breeds, data from a previous study that used the same microsatellite loci (Lasagna et al. Citation2011) were utilised.
Figure 1. Geographical sampling area of the Pagliarola breed.
Biometrical characterisation
Only on the sheep of the four sampled breeds, the following body measures were recorded by Lydtin stick or measuring tape: chest height (CH), chest girth (CG), rump height (RH), rump width (RW), trunk length (TL) and wither height (WH). The weight was not registered, because it is strictly depending on the body condition and physiological status.
Based on these traits, the differences between the four breeds in the sample were estimated by SAS software (Citation2000) (SAS Inc., Cary, NC) according to the follow linear model:
where yij is the biometric trait, μ is the overall mean, Bi is the fixed effect of the breed (i=1 − 4), eij is the residual random effect.
Moreover, the principal component analysis was carried out on the sheep measures to observe the morphological typicality of the Pagliarola in comparison with the other breeds.
DNA extraction and microsatellite analysis
Genomic DNA was extracted from whole blood by the GenElute Blood Genomic DNA kit (Sigma-Aldrich, St. Louis, MO). Twenty-eight microsatellite markers (Table S1) recommended by FAO/ISAG (Citation2004) were chosen on the basis of their position in the sheep genome. The markers were subjected to a standard multiplex PCR amplification using a Thermal Cycler Biometra TGradient 96 (Sigma-Aldrich, St. Louis, MO). The multiplex PCR products were pooled in order to analyze more microsatellites in each electrophoresis. Analyses of fragments were performed using an automated DNA sequencer (ABI PRISM 3130xl, Applied Biosystems, Foster City, CA) and a computer software GeneMapper version 4.0 (Applied Biosystems, Foster City, CA).
In order to assess the genetic diversity, the mean number of alleles per locus (MNA), observed heterozygosity (HO) and expected heterozygosity (HE) were estimated using an Excel microsatellite toolkit (Park Citation2001). The number of private alleles in the different breeds was directly counted taking advantage of Convert software (Glaubitz Citation2004). Test for deviations from Hardy–Weinberg equilibrium (dHWE) across all loci for each population were performed in GENEPOP 4.0.7, applying the “exact test” and using the Markov chain algorithm with default setting to calculate p values (Guo & Thompson Citation1992). Weir and Cockerham’s (Citation1984) extension of Wright’s F-statistics (FIS, FIT and FST) were calculated in FSTAT 2.9.3 software (Goudet Citation2002), as well as the pairwise genetic differentiations among the studied breeds. The significances of the fixation indices were tested using ARLEQUIN 3.11 software (Excoffier & Lischer Citation2010) through the locus-by-locus analysis of molecular variance (AMOVA) procedure. Reynolds’ genetic distance (Reynolds et al. Citation1983) was calculated between pairs of breeds using allele frequencies and consensus statistical support was calculated from 1000 bootstrap replicates using PHYLIP 3.67 (available from: http://evolution.genetics.washington.edu/phylip.html) (Felsenstein Citation2005). Factorial correspondence analysis (FCA) (Benzécri Citation1982), assessed by the employment of GENETIX 4.05 (Applied Biosystems, Foster City, CA), was also used in order to investigate the differentiation of the individuals within each population.
Population structure and admixture were investigated using the Bayesian approach implemented in STRUCTURE 2.2 software (Pritchard et al. Citation2000). Ten independent runs with 600 000 Markov Chain Monte Carlo (MCMC) iterations and a burn-in of 300 MCMC 000 were performed for 2≤K≤7 (K, the number of clusters) to estimate the most likely number of clusters present in the dataset. This value was then established by calculating ΔK, as in Evanno et al. (Citation2005). The clustering pattern according to the different K values was visualised using DISTRUCT 1.1 software (Rosenberg Citation2004).
Results and discussion
Morphological characterisation
Morphological characterisation is a useful tool in conservation and breeding programs (Carneiro et al. Citation2010). As a matter of fact, all the breeds were selected by taking into consideration a morphological target; moreover, the biometric measures have a good heritability values (Agaviezor et al. Citation2012).
The studied sample showed that the residual Pagliarola is very similar to that already described by ancient authors (Bonadonna Citation1976). The estimated means of the biometric measures on the four studied breeds are reported in . As expected, the Pagliarola was the smallest one on the size traits, mainly in comparison with Appenninica and Merinizzata; the WH and TL were 64.0 cm and 64.9 cm versus 72.3 cm and 70.9 cm and 76.9 cm and 71.7 cm, respectively. The same trend was observed in the conformation traits (RW and CG), where the Pagliarola had the smallest values (21.9 cm, 93.1 cm in PA versus 25.9 cm and 104.0 cm in AP and 23.4 cm and 102.4 cm in MI).
Table 1. LS means of the studied traits.
These results confirm that Pagliarola was not selected for any purpose in contrast with other breeds living in the same area, such as Appenninica and Merinizzata that showed larger measures both in size and in conformation traits as a consequence of selection programs for meat production. As a matter of fact, the selection effort on Appenninica and Merinizzata was proved by several reports (Sarti et al. Citation2001; Panella et al. Citation2006; Pieramati et al. Citation2011), but no documents have been found on Pagliarola improvement.
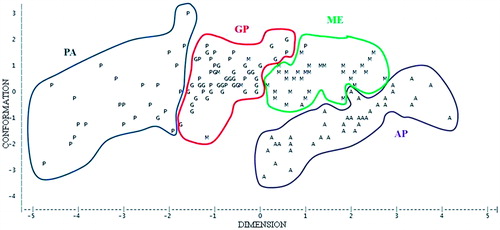
The principal component analysis was carried out to check the differences through the whole body morphology, showed (not tabulated data) that the first two components explain a large portion of the total variance (77.3%). The first component can be identified as the “DIMENSION”, it is the representative of the length and height, the corresponding correlation coefficients were 0.5 (WH) and 0.49 (RH). The second component was more related to the “CONFORMATION” traits, such as chest height (r = 0.47) and rump width (r = 0.80).
The bidimensional plot in shows a quite good separation between the four breeds; only Gentile di Puglia is rather spread along the longitudinal axis (DIMENSION). The Pagliarola is located in the first half of the plot, but it is possible to observe some dimensional differences inside this breed, mainly according to the dimension axis. The variability is probably due to the differences between the two sampled flocks; in fact, in one of them the animals were smaller than in the other probably because of less favourable management conditions. As already reported, the breeds are well distinguished in the plot, also if the GP position makes quite confused the separation. The GP spread pattern is due to the fact that its residual sampled flocks are reared both in mountain hard environment and in more favourable management system (Lasagna et al. Citation2011).
Figure 2. Principal component analysis of the biometric measures in the studied breeds.
Microsatellites
Genetic variability
In the total sampled breeds, a total of 330 alleles in 28 microsatellite markers were detected. The mean number of observed alleles at each locus ranged from 4 (ETH10) to 19 (CSSM66) with an average of 11.79 alleles (Table S1). All microsatellite loci were polymorphic in each breed, according to the FAO/ISAG (Citation2004) recommendation about the minimum number of alleles for genetic distance studies. Several authors found slightly higher values studying other Italian breeds (Tolone et al. Citation2012); in Sicilian sheep, breeds observed values ranging from 6 to 24 (Bozzi et al. Citation2009); in Italian sheep breeds estimated numbers of alleles between 8 and 21. The lowest number of alleles observed in our sample is probably linked to the smaller number of individuals analyzed.
Because of the significant deviation from H–W equilibrium observed in three out of four sheep breeds, the loci CRSD247, SPS115 and MCM527 were excluded from further calculations (Table S1). The results for genetic diversity, genetic distances and breed assignment are, therefore, based on the remaining 25 microsatellite markers. This significant deviation from the HW equilibrium may be explained by unobserved null alleles (Diez-Tascón et al. Citation2000) leading to high FIS values (range 0.1336–0.3202; data not shown). Moreover, population substructures or genetic admixture could cause this deviation.
shows the genetic diversity within the studied breeds and allow us to observe that Pagliarola sheep breed still has a considerable genetic diversity. Mean number of observed alleles ranged from 7.44 in PA to 8.28 in AP. This trend was also observed for allelic richness with PA having a value of 3.83 and AP having a value of 4.38. Also Tapio et al. (Citation2005) found low allelic richness estimates (ranging from 2.62 to 6.26) studying northern European sheep breeds. AP had the highest expected heterozygosity (0.78), while PA had the lowest (0.70). Mean values for observed heterozygosity across the breeds ranged from 0.67 in PA to 0.70 in ME (). The inbreeding coefficients were significantly different from zero in Pagliarola (FIS = 0.0484). This parameter reached a maximum value in AP (0.1163) and a minimum value in PA (0.0484). In spite of the very low number of head, the inbreeding coefficient in Pagliarola is similar to that of the other studied breeds, AP except. Moreover, the FIS value suggests that a degree of heterozygosity deficiency exists within Pagliarola and AP, as it was also indicated by the values of observed and expected heterozygosity, perhaps because of the lack of rams turnover and of the mating between related animals. Other authors found some heterozygosity deficiency on different sheep breeds (Legaz et al. Citation2008; Bozzi et al. Citation2009).
Table 2. Studied breeds, acronym, sample size of each breed, mean number of observed alleles (MNA), mean observed and expected heterozygosity, allelic richness of each breed and inbreeding coefficient (FIS) per breed.
The mean estimates of F-statistics over loci (Table S1) were FIS = 0.078 (within-population inbreeding estimate), FIT = 0.133 (total inbreeding estimate) and FST = 0.060 (estimate of population differentiation). The value of overall FIS was quite low, but significantly different from zero (p<0.05). Also the average genetic differentiation between breeds (6.0%) was significantly different from zero (). In addition, the AMOVA analysis revealed that most of the variation was consistently explained within populations (94.21%, p<0.001) instead of among populations (5.79%, p<0.001) ().
Table 3. Analysis of molecular variance (AMOVA) of the four studied breeds.
Genetic relationship and admixture analysis
The pair-wise genetic distances (FST) between breeds are shown in . FST values ranged from 0.02 (GE versus ME) to 0.09 (PA versus AP). The PA versus AP higher FST value is quite surprising in consideration that PA is believed to be the ethnological ancestor of AP (Bonadonna Citation1976); but we cannot exclude a possible genetic introgression with other sheep breeds not considered in this study.
Table 4. Estimates of pairwise FST distances between the analysed breedsTable Footnotea.
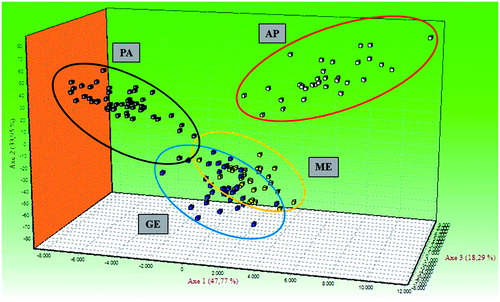
The neighbour-net tree could clearly differentiate between the four sheep breeds using the data of the 25 microsatellites (). In more detail, PA is well separated from the other breeds. The clusters identified by neighbour-net tree were similar to that showed in FCA analysis (). In the FCA analysis, the first axis explained 47.77% of the total variation, whereas the other two axes explained 33.95% and 18.29%. These data confirmed the PCA analysis results () carried on the biometric measures. As reported by several authors (Agaviezor et al. Citation2012), this fact highlights the convergence of the results obtained from the two different tools (morphological and molecular) used for the PA characterisation.
Figure 3. Neighbour-net tree obtained from the DA genetic distance among Pagliarola and the reference breeds.
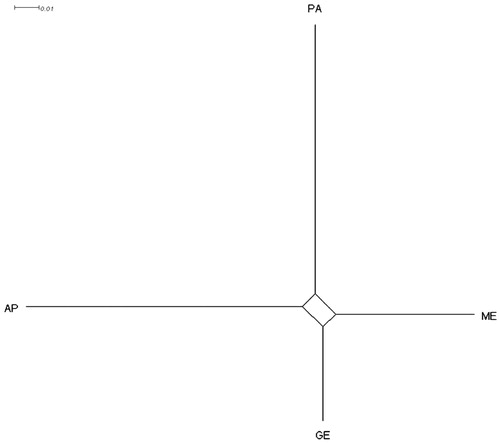
Figure 4. Factorial correspondence analysis.
The structure of the analyzed breeds was implemented using a Bayesian approach that inferred the number of clusters in the populations (). The highest ΔK value was obtained for K=5 (). At K=2 PA separated from the other breeds, whereas at K=3, its genetic sub-structure showed admixture with AP. At K=4, the genetic substructure in PA was confirmed and two different sub-clusters were highlighted. At K=5, PA breed was separated again in two sub-clusters and some genetic admixture with GE and ME was detected as already shown in FCA analysis (). As discussed already on the morphological traits, the existence of subpopulations within the PA breed (probably due to Wahlund effect) reflects the different environmental and managerial conditions of the two farms in which samples were collected, moreover, suggesting that there was no sharing of genetic material between them.
Figure 5. STRUCTURE cluster analysis of Pagliarola sheep breed (A) and ΔK calculated as in Evanno et al. (Citation2005) from K=2 to K=7 (B).
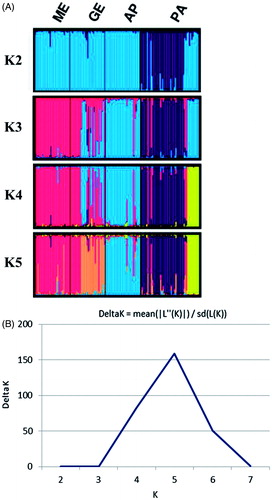
The proportion of membership in the different clusters varied among the breeds (Table S2) and AP showed the highest value (0.896). PA exhibited the presence of the two already reported sub-clusters within its genetic pattern (0.204 versus 0.678).
Conclusions
Both biometric and molecular analyses allow us to consider the residual Pagliarola as an original genotype. The dimension and conformation traits analysis well separate this population from the other breeds living for centuries in the same area or sharing the ethnological history. The molecular study suggests that within breed genetic variability observed in the studied breeds is larger than that among the breeds. The variability still remaining in Pagliarola both from morphological and molecular point of view will be useful in order to plan suitable saving programs of this population that must be considered as a precious source of genes to the adaptability in the hard environment.
These results are very encouraging because it allow us to hypothesise the chance of recovering the breed not only in itself but also in order to avoid the ultimate loss of strictly typical products that are a heritage of the multiethnic history of the Centre and South Italy human populations.
Funding information
The research was financially supported by Ente Parco Nazionale del Gran Sasso e Monti della Laga and by Fondazione Cassa di Risparmio di Perugia, project number 2013.0208.021.
Supplementary Data
Download MS Word (20 KB)Acknowledgements
The authors want to thank Dr. Mokhethi Matthews Selepe (University of Zululand, South Africa) and the two anonymous referees for their valuable comments and constructive suggestions.
References
- Agaviezor BO, Peters SO, Adefenwa MA, Yakubu A, Adebambo OA, Ozoje MO, Ikeobi CON, Wheto M, Ajayi OO, Amusan SA, et al. 2012. Morphological and microsatellite eDNA diversity of Nigerian indigenous sheep. J Anim Sci Biotechnol. 3:38.
- Ajmone-Marsan P, GLOBALDIV Consortium. 2010. A global view of livestock biodiversity and conservation-GLOBALDIV. Anim Genet. 41:1–5.
- Benzécri JP. 1982. L'Analysedes Données. 2. L'Analyse des correspondances. Paris (Italy): Dunod.
- Bonadonna T. 1976. Etnologia zootecnica. Italy: UTET ed.
- Bozzi R, Degl’Innocenti P, Rivera Diaz P, Nardi L, Crovetti A, Sargenti C, Giorgetti A. 2009. Genetic characterization and breed assignment in five Italian sheep breeds using microsatellite markers. Small Ruminant Res. 85:50–57.
- Buduram P. 2004. Genetic characterization of Southern African sheep breeds using DNA markers [degree diss.]. [Bloemfontein, South Africa]: University of the Free State.
- Carneiro H, Louvandini H, Paiva SR, Macedo F, Mernies B, McManus C. 2010. Morphological characterization of sheep breeds in Brazil. Uruguay and Colombia. Small Ruminant Res. 94:58–65.
- Cesari Sartori M. 2005. Mangiaitaliano. Guida alle specialità regionali italiane. Italy: Morellini editore.
- de Rancourt M, Fois N, Lavin M, Tchakerian E, Vallerand F. 2006. Mediterranean sheep and goats production: an uncertain future. Small Ruminant Res. 62:167–179.
- Diez-Tascón C, Littlejohn RP, Almeida PAR, Crawford AM. 2000. Genetic variation within the Merino sheep breed: analysis of closely related populations using microsatellites. Anim Genet. 31:243–251.
- Evanno G, Regnaut S, Goudet J. 2005. Detecting the number of cluster of individuals using the software STRUCTURE: a simulation study. Mol Ecol. 14:2611–2620.
- Excoffier L, Lischer HEL. 2010. Arlequin suite ver 3.5: a new series of programs to perform population genetics analyses under Linux and Windows. Mol Ecol Resour. 10:564–567.
- FAO/ISAG. 2004. Secondary Guidelines for Development of National Farm Animal Genetic Resources Management Plans. Measurements of Domestic Animal Diversity (MoDAD): recommended microsatellite markers. Available from: http://www.fao.org/3/a-aq569e.pdf.
- FAOSTAT. 2011. FAOSTAT Database on Agriculture. Roma, Italy. Available from: http://faostat.fao.org/site/291/default.aspx.
- Felsenstein J. 2005. PHYLIP (Phylogeny Inference Package) version 3.6. Available from: http://evolution.genetics.washington.edu/phylip.html.
- Gizaw S, Van Arendonk JA, Komen H, Windig JJ, Hanotte O. 2007. Population structure, genetic variation and morphological diversity in indigenous sheep of Ethiopia. Anim Genet. 38:621–628.
- Glaubitz JC. 2004. CONVERT: a user-friendly program to reformat diploid genotypic data for commonly used population genetic software packages. Mol Ecol Notes. 4:309–310.
- Goudet J. 2002. FSTAT 2.9.3.2, a program to estimate and test gene diversities and fixation indices. Available from: http://www.unil.ch/popgen/softwares/fstat.htm.
- Guo SW, Thompson EA. 1992. A Monte Carlo method for combined segregation and linkage analysis. Am J Hum Genet. 51:1111–1126.
- Köhler-Rollefson I, Rathore HS, Mathius E. 2009. Local breeds, livelihoods and livestock keepers' rights in South Asia. Trop Anim Health Prod. 41:1061–1070.
- Kunene N, Ceccobelli S, Di Lorenzo P, Hlophe RS, Bezuidenhout CC, Lasagna E. 2014. Genetic diversity in four populations of Nguni (Zulu) sheep assessed by microsatellite analysis. Ital J Anim Sci. 13:76–82.
- Lasagna E, Bianchi M, Ceccobelli S, Landi V, Martínez AM, Luis Vega Pla J, Panella F, Bermelo JVD, Sarti FM. 2011. Genetic relationships and population structure in three Italian Merino-derived sheep breeds. Small Ruminant Res. 96:111–119.
- Legaz E, Álvarez I, Royo LJ, Fernández I, Gutiérrez JP, Goyache F. 2008. Genetic relationships between Spanish Assaf (Assaf.E) and Spanish native dairy sheep breeds. Small Ruminant Res. 80:39–44.
- Ligda Ch, Altarayrah J, Georgoudis A, the ECONOGENE Consortium. 2009. Genetic analysis of Greek sheep breeds using microsatellite markers for setting conservation priorities. Small Ruminant Res. 8:42–48.
- Marchi E, Mascheroni E. 1925. Zootecnia speciale I: Equini e Bovini. Italy: Unione tipografico – casa editrice.
- Panella F, Sarti FM, Lasagna E, Renieri C, Antonini M. 2006. The old Italian Merino-derived breeds and their role in landscape conservation in typical production and in the maintenance of traditional culture. EAAP Publ. No. 118. Wageningen, The Netherlands: Academic Publishers. p. 247–252.
- Park SDE. 2001. Trypano tolerance in West African Cattle and the population genetic effects of selection [Ph.D dissertation]. Dublin, Ireland: University of Dublin.
- Pieramati C, Lasagna E, Panella F, Piro F, Giontella A, Sarti FM. 2011. Suitability of linear scoring in meat sheep: the practical case of Merinizzata Italiana breed. Ital. J Anim Sci. 10:51–53.
- Pritchard JK, Stephens M, Donnelly P. 2000. Inference of population structure using multilocus genotype data. Genetics 155:945–959.
- Renieri C, Silvestrelli M, Casciotti D, Ronchi B. 1984a. La popolazione ovina Pagliarola: studio demografico. Italy: Il Vergaro, N. 9, Associazione Nazionale della Pastorizia ed.
- Renieri C, Silvestrelli M, Casciotti D, Ronchi B. 1984b. La popolazione ovina Pagliarola: l’inventario genetico dei caratteri esteriori. Italy: Il Vergaro, N. 10, Associazione Nazionale della Pastorizia ed.
- Reynolds J, Weir BS, Cockerham CC. 1983. Estimation of the coancestry coefficient: basis for a short-term genetic distance. Genetics 105:767–779.
- Rosenberg NA. 2004. Distruct: a program for the graphical display of population structure. Mol Ecol Notes. 4:137–138.
- Sarti DM, Panella F, Pauselli M, Sarti FM, Lasagna E. 2002. L’allevamento degli ovini. In: Il divulgatore. Agenzia territoriale per la sostenibilità alimentare, agro-ambientale ed energetica ed., Bologna, Italy.
- Sarti FM, Lasagna E, Panella F, Lebboroni G, Renieri C. 2006. Wool quality in Gentiledi Puglia sheep breed as measure of genetic integrity. Ital J Anim Sci. 5:371–376.
- Sarti FM, Panella F, Bogani D. 2001. The most suitable traits in the Appenninica sheep for meat selection. Zootecnia e nutrizione animale 27:65–74.
- SAS. 2000. SAS online doc Version 8. SAS Institute Inc. Cary, NC. Available from: http://v8doc.sas.com/sashtml.
- Tapio M, Tapio I, Grislis Z, Holm LE, Jeppsson S, Kantanen J, Miceikiene I, Olsaker I, Viinalass H, Eythorsdottir E. 2005. Native breeds demonstrate high contributions to the molecular variation in northern European sheep. Mol Ecol. 14:3951–3963.
- Tolone M, Mastrangelo S, Rosa AJM, Portolano B. 2012. Genetic diversity and population structure of Sicilian sheep breeds using microsatellite markers. Small Ruminant Res. 102:18–25.
- Weir BS, Cockerham CC. 1984. Estimating F-statistics for the analysis of population structure. Evolution 38:1358–1370.
- Wright Clifford A. 1999. A Mediterranean feast: the story of the birth of celebrated cuisines of the Mediterranean, from the merchants of Venice to the Barbary Corsairs: with more than 500 recipes. New York (USA): William Morrow and Coed.