
 ?Mathematical formulae have been encoded as MathML and are displayed in this HTML version using MathJax in order to improve their display. Uncheck the box to turn MathJax off. This feature requires Javascript. Click on a formula to zoom.
Abstract
Morphometric studies on European red deer (Cervus elaphus L.) living in sub-Mediterranean areas are rare. In this paper, we provide the first morphometric description of red deer from Apennine living in Prato Province, as well as a description of its skeletal growth pattern. We analysed 18 body, cranial and antler measurements from 905 deer carcasses, collected during 12 hunting seasons (2000–2012). The body size of red deer from Prato appeared comparable to that of other populations from Northern Apennine and Central Alps. A significant variation in weight during the hunting season was detected only in adult stags: they were estimated to lose 23% of their eviscerated body weight from the beginning of the rutting season until the end of winter. The relationship between eviscerated body weight (EW) and whole body weight (WW) was highly significant in both sexes within every age class (R2 always higher than 0.75), thus linear regressions were assessed in order to estimate EW from WW, allowing to complete datasets when such information is missing. Growth equations were utilised to describe the development of a subset of skeletal measures (height at shoulder, hind foot length, mandible length, head–trunk length) commonly collected on hunted cervids. Hind foot length was the measure which first ceased to grow and with the highest growth constant; although the relationship between cohort hind foot length and environmental, climatic and demographic variables has to be tested for red deer from Apennine, these bones appeared a suitable biological indicator for long-term monitoring of the species.
Introduction
Skeletal measurements and body weight are commonly employed to characterize morphology and growth of cervids populations. Skeletal growth and ultimate size are affected both by genetic and environmental factors (Klein Citation1964), therefore differences in adult body size within the same species may reflect the effects of diverse habitat quality or animal density (Klein Citation1964; Hewison et al. Citation1996; Pettorelli et al. Citation2002). At a certain stage of growth, nutritional or energetic restrictions may affect more incisively organs or part of tissues with high growth priority than those which have passed or not reached yet the moment of maximum growth (Langvatn et al. Citation2004). High availability and quality of food resources determine rapid growth in early life stages, and reduced growth in juvenile stages is not likely to be compensated in adulthood (Post et al. Citation1997). Accordingly, high body mass, high skeletal development or rapid growth can be considered indices of health and favourable environmental conditions (Bertouille & De Crombrugghe Citation1995; Gaillard et al. Citation1996), as for instance low population density or the absence of limiting weather conditions (e.g. deep and persistent snow cover), which thus favour the access to food resources. Moreover, body size influences population dynamics and fitness: in ungulates, it is a determinant of overwinter survival (Mysterud et al. Citation2001), and it affects competitive ability in males (Mysterud et al. Citation2001; Toïgo et al. Citation2006) by conditioning fighting skills, dominance and consequently reproductive success (Clutton-Brock et al. Citation1982). Body size has also a fundamental effect on reproduction in females (Langvatn et al. Citation1996); in hinds, fecundity strongly depends on body weight and condition, growth rate and constitution (Albon et al. Citation1983; Albon et al. Citation1986; Bertouille & De Crombrugghe Citation2002).
The long-term monitoring of morphometric measurements and the analysis of their growth patterns could therefore represent a useful means to complement the study of ungulates populations as well as to give a broader insight on their environmental and interspecific interactions. However, for large free-living wild mammals is difficult to obtain an adequate number of age-related measurements, as well as precise age estimation, in order to construct individual growth curves. A possible solution is the analysis of ‘cross-sectional’ data, in which each individual is measured only once (Brisbin et al. Citation1987; Leberg et al. Citation1989), as for measurements obtained from biometric monitoring of selectively hunted ungulates.
Morphometric studies and descriptions of European red deer (Cervus elaphus Linnaeus, 1758) are infrequent and, to our knowledge, a long term morphometric description and growth patterns analysis of red deer from Apennine has not been carried out yet. Only few studies have described some morphological traits of red deer populations living in sub-Mediterranean areas. In Italy, the few investigations about this topic concerned areas with peculiar habitat features, as the Alps (Brugnoli Citation1993; Mattiello et al. Citation2003), otherwise they referred to spatially or genetically isolated populations, as C. e. corsicanus (Beccu Citation1989) and Mesola red deer C. e. italicus (Mattioli & Ferretti Citation2014).
Red deer in Northern Apennine is presently distributed in three main areas: the further north-west includes four Italian provinces (Lucca, Modena, Reggio Emilia and Parma) and its population is estimated to be nearly 3100 individuals, with a density of 1.6 deer/100 ha (Fontana et al. Citation2014); the most south-eastern area encompasses three provinces (Arezzo, Forlì-Cesena and the eastern part of Firenze), with an estimated population of 2500–3000 deer and a density of 2.5–3 deer/100ha (Mattioli L. et al. Citation2014); the middle distribution comprises the provinces of Prato, Pistoia, Bologna and the western part of Firenze. The latter is the largest in term of population size (3000–3500 individuals) with a density of 2.1–2.5 deer/100 ha (Mattioli S. et al. Citation2014) and was originated by seven red deer reintroduced in 1958 and 1965 from the State Forest of Tarvisio (Mazzarone & Mattioli Citation1996) in the Acquerino-Cantagallo Natural Reserve (Prato and Pistoia Provinces). The whole population is monitored since 1994 and managed by the inter-regional technical commission of Central ACATER (Areale Cervo Appennino Tosco-Emiliano-Romagnolo, i.e. central management unit of Northern Apennine red deer) since 2000.
In this paper, we analysed morphometric data collected on red deer from Apennine living in Prato Province, culled during 12 hunting seasons (from 2000/2001 to 2011/2012) in order to (I) provide the first description of some of their morphological traits, placing a milestone for future assessment of the effects of selective hunting management; (II) assess linear regressions of whole body weight on eviscerated body weight, in order to estimate this measurement in incomplete datasets; (III) provide information on their skeletal development and (IV) identify body measures suitable to be used as ecological indicator for environmental and population changes.
Materials and methods
Study area
The study site is Prato Province (Central Italy), where red deer distribution extends for approximately 170 km2 (Nicoloso et al. Citation2007) including the Acquerino-Cantagallo Natural Reserve, the historical reproductive area of the Northern Apennine red deer population. The size of Central ACATER population increased by 35% from 2000 to 2010 (Nicoloso et al. Citation2010), nonetheless density declined from 2.60 to 2.05 deer/100 ha due to an expansion of deer range. At present, the part of red deer population living in Prato accounts for nearly a quarter of the population managed by Central ACATER (Mattioli S. et al. Citation2014). In the area of red deer management, altitude ranges between 100 and 1100 m a.s.l. The climate is temperate in areas at higher elevations and continental in plains. Average monthly temperatures rarely are below 0 °C, ranging from 1 to 6 °C in the coldest month and from 17 to 24 °C in the warmest month. Annual precipitations generally exceed 1000 mm, with seasonal maximum in autumn and spring, and the minimum in summer.
Forests are prevalent (84%) and represent the main habitat of the northern part of the territory: the forest types are broad-leaved (73%), broad-leaved and conifer (7%) and conifer (4%) woodlands. In woodlands dominated by deciduous broad-leaved species the prevailing stands are chestnut (Castanea sativa Mill.) for fruit production or coppice, beech (Fagus sylvatica L.) woodlands at highest altitudes, and Turkey oak (Quercus cerris L.) mixed woodlands mainly associated with pubescent oak (Quercus pubescens Willd.), hornbeam (Ostrya carpinifolia Scop.) and chestnut. The main conifer species are silver fir (Abies alba Mill.) and Douglas-fir (Pseudotsuga menziesii Mirb. Franco). Bracken fern (Pteridium aquilinum L.), heather (Calluna vulgaris L.) and broom (Sarothamnus scoparius L.) can be frequently found in the peripheral portions of woodlands, as well as in clearings. Open and arable areas and olive groves represent 3% and 2% of the territory, respectively.
Data collection
In Central ACATER, body weight and somatic measures from selectively hunted red deer are collected during every hunting season since 2000. Data analyzed in the present study refer to body measurements from 905 deer hunted between 2000 and 2012. The distribution of hunted animals among the age classes follows the sampling schedule intended by the annual operative program of ACATER; the number of hunted animals per year in each age class may then vary, according to the management purposes. In the ACATER district, hunting season for adult stags extends from August to February, for yearling and sub adult stags from October to March, while hinds are hunted from December to March. Morphometric data of hunted animals are collected according the standardized procedure recommended by ISPRA (Istituto Superiore per la Protezione e la Ricerca Ambientale) (Mattioli & De Marinis Citation2009). Age estimation to yearly age classes was performed basing on tooth eruption and wear characters in mandibles with permanent dentition. Stags and hinds were subsequently grouped into four and three age classes, respectively: calves (age <12 months), yearlings (12–23 months), subadults (2–4 yrs), and adults (≥ 5 yrs) for males; calves, yearlings, and adults (≥ 2 yrs) for females. These groupings follow biological and ethological steps of red deer growth, and represent the age classes in which animals are divided for operations related to the management of the species. Sample composition by age and sex is reported in Table . The sample includes hinds and stags aged up to 15 and 12 years, respectively. Sample sizes, however, vary among the different analyses of body measurements, because a complete set of measures was not always available for each individual.
Table 1. Composition of the sample of red deer (Cervus elaphus L.) culled during 12 hunting seasons in Prato Province; sample size is reported by sex and by age classes commonly adopted in the management of the species.
The following body and cranial measurements were analysed: height at shoulders (HS), head–trunk length (HTL), chest circumference (CC), hind foot length (HL), whole weight (WW), eviscerated body weight with head (EW), total length of the cranium (TL), condilo–basal length (CBL), mandible length (ML), ectorbital width (ECW), zygomatic width (ZW), mastoid width (MW). The analysis of antler characteristics concerned: antler beam length (ABL), lower (LBC) and upper (UBC) beam circumference, length of brow tine (BrL), bez tine (BeL) and trez tine (TrL), number of tines per antler pair as well as the occurrence of palmation, a peculiar trait in stags from Acquerino (Mazzarone & Mattioli Citation1996), also present in Sardinian red deer C.e. corsicanus (Caboni et al. Citation2006).
Mandible length measurements collected during hunting season 2010/2011 were not included in the analysis due to a probable systematic measure error.
Body and antler measurements, assessed with a precision of 1 mm, are reported in cm; cranial measurements, taken using a calibre with 0.1 mm precision, are reported in mm. All measures were taken by wildlife technicians and hunters with specific training.
Statistical analysis
Morphological description
Normality of data was checked with Shapiro–Wilk test. Differences between sexes within each age class in body and cranial measurements were preliminary investigated by means of a t-test (data not shown). The analysis revealed significant differences (p < 0.004) between sexes within every age class for all measures, with few exceptions: no differences were detected between HS (p = 0.262), HTL (p = 0.143), CC (p = 0.169), TL (p = 0.644), CBL (p = 0.894), ML (p = 0.941), ECW (p = 0.116), and ZW (p = 0.643) of male and female calves. All the analysis presented in this work was therefore carried out separately for the sexes.
A mixed model (GLM) including the effects of δi = age class (fixed effect) and ρj = year of culling (random effect) was fitted (SPSS for Windows, Version 16.0, Chicago, IL) for each body and cranial measurement, as well as for antler characters, according to the following equation:
(1)
(1)
For each age class, estimated means were calculated for all measurement, and pairwise comparisons with Bonferroni adjustment were performed.
The trend in antler quality during the first 12 years of management, indexed by antler beam length in yearlings (Schmidt et al. Citation2001), was evaluated with Spearman’s correlation index (rs).
In the ACATER district, hunting season spans several months throughout reproductive period and winter, therefore we aimed to test whether the sample of deer showed a significant trend in eviscerated body weight during the hunting season; thus, the relationship between EW and culling date was tested with linear and quadratic regression, separately for all age classes of hinds and stags. Culling date was calculated within each year as the number of days between the date of shooting and the 1st of September (Post et al. Citation1997; Mysterud et al. Citation2001), since no adult stags had been hunted during the month of August. The effect of year of culling, preliminarily tested by GLM, resulted not significant. In case of significant quadratic regression, the following negative exponential equation was fitted, in order to describe weight variation:
(2)
(2)
where α represents the variance between the intercept and the horizontal asymptote (γ), while β represents the relative growth rate. This negative exponential form (2) was chosen as the one with the highest R2 among the other previously tested equations (i.e. polynomial, logarithmic).
Whole weight–Eviscerated weight relationship
Both weight measurements (WW, EW) are often difficult to collect on selectively hunted deer, therefore linear relationships between eviscerated body weight and whole body weight were assessed separately in males and females for each age class, in order to provide a tool to complete lacking data. Differences in coefficients of regressions between the sexes, and between age classes within sex, were tested with ANOVA.
Skeletal development
The development of red deer skeletal measures (HS, HL, ML, HTL) was illustrated separately for stags and hinds by using growth equations; we employed age in months, calculated using June 1st as the average date of calving (Rieck Citation1955; Bertouille & De Crombrugghe Citation1995). As preliminary investigation, we fitted growth models to animals of all age classes (data not shown); however, age estimation to yearly age classes by examination of tooth wear characters may induce to remarkable bias, up to 4–5 years (Pérez‐Barbería et al. Citation2014). Therefore, we built the final growth models using exclusively measures from deer assigned to age classes <4 years: indeed, within this period, animals can be classified in yearly age groups with greater accuracy by the observation of tooth eruption patterns (De Marinis Citation2015). Preliminary models (all age classes) were used to assess the accuracy of estimate of the final growth curves (age <4 years). We intentionally avoided to build curves for weight and chest circumference; indeed, in most mammals skeletal growth ends more rapidly than muscular growth or formation of fat tissue (Bertouille & de Crombrugghe Citation1995): accordingly, the growth of these body measures continues after the third year of age, therefore the estimation of the curves might be biased by the use of a restricted sample.
Three different growth equations were fitted to each body measure: Gompertz equation (Equation Equation3(3)
(3) ), the reparameterized (Brisbin et al. Citation1986) Richards equation (Equation Equation4
(4)
(4) ), and the original form (Bertalanffy Citation1938) of von Bertalanffy equation (Equation Equation5
(5)
(5) ).
(3)
(3)
(4)
(4)
(5)
(5)
M(t) is body measure at age t, and M∞ is the asymptotic measure. K is the growth rate constant, k is the growth constant and T is the growth period indicative of growth rate (Brisbin et al. Citation1986). I is the age at inflection point, M0 is measure at age =0, A0 is age when measure is supposed to be 0, and m is the Richards shape parameter.
The equations were fitted with a non-linear regression using the R programming environment (stats package; R 3.0.2, R Core Team). Richards reparametrized equation, having a shape parameter, should allow a better flexibility in data fitting, therefore we compared these growth models, in order to choose the one which best describes the age-measure relationship. A 5-folds cross-validation procedure with 1,000 bootstrap replications was used, and Mean Square Errors (MSE) on test dataset were calculated to evaluate the fitting of the curves; the lowest test MSE was chosen as index of accuracy of the fitting.
Results
Morphological description
The effect of year of culling was not significant for any of the body measurements, with the exception of hinds height at shoulders (p = 0.026). Conversely, this effect resulted significant in some cranial measurements of stags (TL: p = 0.039; LCB: p = 0.017; ECW: p = 0.004) and hinds (ECW: p = 0.03), as well as in antler beam length (p = 0.008), upper (p = 0.002) and lower (p = 0.001) beam circumference and trez tine (p = 0.008). Estimated marginal means from the GLM (Equation Equation1(1)
(1) ) fitted to body, cranial and antler measurements are reported in Tables , respectively. For each body and cranial trait, measurements differed markedly among age classes (p < 0.001). Adult and subadult stags displayed different (p < 0.001) antler characteristics (no. tines per antler pair) and measures (ABL, LBC, UBC, BrL, BeR, TrL). Bez tine occurred in 50% of antler beams; the presence of palmation was registered in 47.5% of antlers, with higher frequency in adult stags (36%) than in subadults (11.5%). Antler beam length of yearlings, used as quality index in male cervids (Schmidt et al. Citation2001), did not display a significant trend during the first decade of management (rs = −0.187, df = 57, p = 0.157). Linear relationship between eviscerated weight and date of shooting was not significant in adult hinds (p = 0.266), male yearlings (p = 0.228) and calves (males: p = 0.634; females: p = 0.732). EW showed a slight linear decline during the sampling period in subadults (p = 0.057) as well as in female yearlings (p = 0.064).
Table 2. Body measures of Prato Province red deer (data collected during 12 hunting seasons from 2000 to 2012); reported means are estimated from the mixed effect linear models (Equation 1) ± root mean square error.
Table 3. Cranial measures of Prato Province red deer (data collected during 12 hunting seasons from 2000 to 2012): means are estimated from the mixed effect linear models (Equation 1) ± root mean square error.
Table 4. Antler measures and characters of Prato Province red deer stags; reported means are estimated from the mixed effect linear models (Equation 1) ± root mean square error.
In adult stags the quadratic regression between date of shooting and EW resulted statistically significant (F = 15.87, df1 = 2, df2 = 63, p < 0.001), in accordance with the biological weight loss occurring both during rutting season (September - October) and during winter (December - February). Equation Equation2(2)
(2) was fitted to eviscerated weight data of adult stags in order to describe this trend for the sampled animals (Figure ); the equation seems to comply with the pattern of weight data, whose trend appears evident despite the relevant variability of the dataset, as revealed by the coefficient of determination (R2 = 0.33). Estimated parameters and confidence intervals are reported in Table . The estimated eviscerated weight at September 1st, before the beginning of the climax of rutting period, is 156.8 kg while the estimate at November 1st, after the complete end of mating period, is 131.2 kg. Thus, the eviscerated carcass of adult stags is evaluated to be ∼16% lighter after the end of reproduction period. EW at March 1st, as calculated with Equation Equation2
(2)
(2) , is 121.2 kg: adult stags are estimated to lose as much as 23% of their body weight from the beginning of the rutting season to the end of winter.
Figure 1. Negative exponential equation (2) fitted to the eviscerated weights of adult stags collected during the hunting seasons.
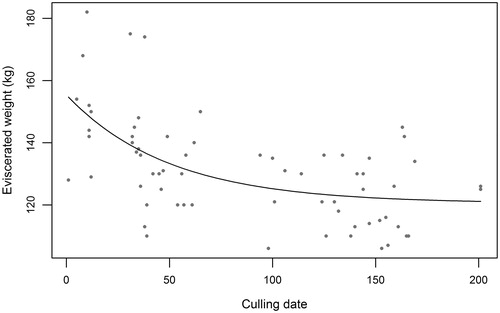
Table 5. Parameter estimates and confidence intervals (C.I.) of negative exponential equation (2) for eviscerated weight of adult stags.
Whole weight–eviscerated weight relationship
Least-square linear fit of regressions of whole body weight on eviscerated body weight are illustrated in Table ; all the regressions resulted highly significant, with an R2 always greater than 0.75. Regression coefficients differed significantly between males and females (F = 9.963, df = 1, p = 0.002); moreover, slopes appear slightly different in various age classes of males (F = 4.697, df = 3, p = 0.003), but not in females (F = 2.291, df = 2, p = 0.102).
Table 6. Linear regressions of whole body weight (WW) on eviscerated body weight (EW) with R2.
In females, eviscerated weight represents from 70% (min.) to 72% (max.) of the WW; in males EW amounts from 73% (min.) to 78% (max.) of the whole weight, and yields increase with age.
Skeletal development
Gompertz, Richards and von Bertalanffy equations fitted similarly to morphometric data of sampled deer: the estimated growth curves calculated with the three equations overlapped for each measure, except for hind foot length of stags where Richards equation provided a different shape and a lower value of asymptotic length. In this growth equation the standard errors of the parameters were always higher than the ones of the other equations. In all cases, average test MSE calculated after cross-validation showed little differences between curves. The von Bertalanffy curve has been frequently used in literature to model deer growth (Bertouille & De Crombrugghe Citation1995; Azorit et al. Citation2003), therefore we report the results obtained with this equation (Equation5(5)
(5) ). Parameter estimates of the preliminary curves (deer of all age classes) did not differ (k: F = 0.487 p = 0.623; M∞: F = 0.06 p = 0.942) from the ones calculated for the curves fitted on animals <4 years old; accordingly, graphical representation of these curves were nearly identical and mostly overlapping.
Curves of the selected measures fitted on deer <4 years old are shown in Figures . Early growth stages of male and female calves are similar until approaching the first year of age, when stags increase their size more rapidly than hinds. This growth gap widens until body measures tend to asymptotic values, which are in every case higher in stags.
Figure 2. Graphical representation of von Bertalanffy equations (5) fitted to height at shoulder data collected on red deer males and females during the hunting seasons.
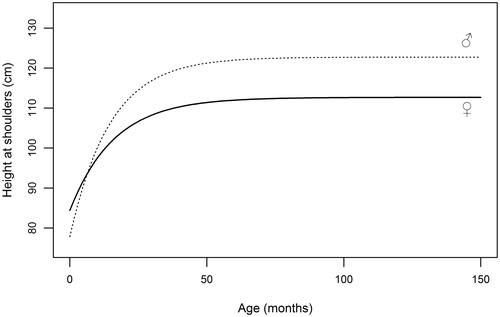
Figure 3. Graphical representation of von Bertalanffy equations (5) fitted to hind foot length data collected on red deer males and females during the hunting seasons.
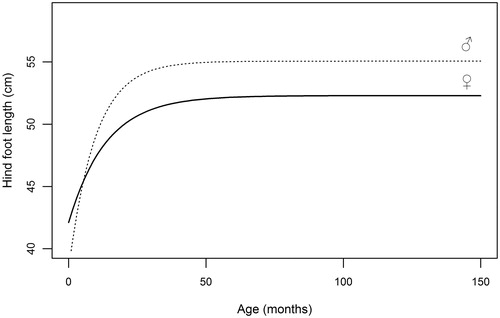
Figure 4. Graphical representation of von Bertalanffy equations (5) fitted to mandible length data collected on red deer males and females during the hunting seasons.
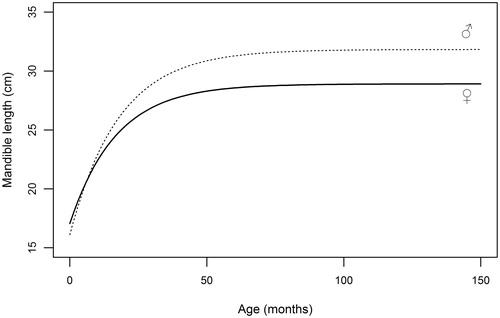
Figure 5. Graphical representation of von Bertalanffy equations (5) fitted to head-trunk length data collected on red deer males and females during the hunting seasons.
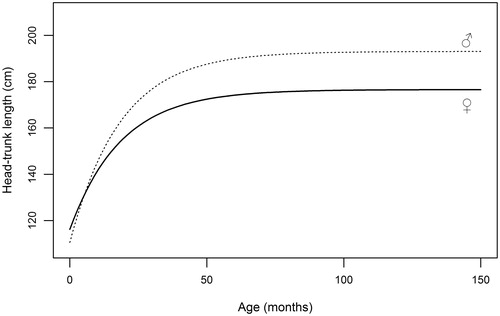
Table illustrates parameter estimates of von Bertalanffy equation for linear measures, which were obtained from the subsample of animals aged <4 years, in order to avoid bias due to inaccurate age estimation (Pérez‐Barbería et al. Citation2014). M∞ estimates for all selected measures are comparable to adult mean values predicted by GLM (Table ). Height at shoulders attains 95% of asymptotic value at approximately 30 months (2.5 yrs) in males and at 26 months in females, indicating a faster growth of fore part in stags, as also displayed by the higher values of the growth constant (k). Linear development of mandible reaches its 95% at approximately 3 years of age both for stags (34 months) and for hinds (36 months); accordingly, difference between growth constants is negligible. In a similar manner, hind foot length achieves 95% of maximum length at 18 months both in males and in females, and k appears markedly higher in males (0.103) than in females (0.074); HL is thus the measure displaying the fastest growth. The longitudinal skeletal development, summarized by head-trunk length, cease far earlier in females (27 months) than in males (40 months); the value of the growth constant is identical in the two sexes.
Table 7. Parameter estimates of Von Bertalanffy (Citation1938) equation (Equation 5) for red deer body measurements (cm). Growth curves are built using measures of deer < 4 years old. The values of the parameters are means ± SE.
We do not discuss the estimated values of A0, since birth and postnatal period lie outside the temporal range of our sampled data, therefore little reliability should be given to estimates of age when measure is supposed to be zero.
Discussion
As other ungulates with large distribution, red deer can display considerable morphological variability within its geographic range. Local environmental features may additionally play a marked role in shaping differences at intrapopulation level: animals inhabiting the same management unit (Central ACATER), although in opposite sides of the Apennine (Bologna Province), display marked differences in adult weight: red deer from Bologna are on average 30 kg (stags) and 12 kg (hinds) heavier than animals of our sample; similarly, all skeletal measures are greater (males: 1–8%; females: 1–7%) in red deer from Bologna (Gaggioli Citation2005). This variability could be attributed to environmental differences between the two sites, in particular the larger occurrence of grasslands and cultivated areas in Bologna territories. On the other hand, red deer from Prato displayed a greater size than some other C. elaphus populations from Italy, specifically from Northern Apennine (Foreste Casentinesi: data from Cicognani et al. in Mattiello & Mazzarone, Citation2010) and from Valtellina in the Retic Alps side (Mattiello et al. Citation2003). Conversely, their size resulted smaller than red deer from the Orobic Alps side in Valtellina (Mattiello et al. Citation2003) and Trento Province (Brugnoli Citation1993).
Craniometry revealed a greater head size than red deer from southern Spain (Andalucía: Soriguer et al. Citation1994; Sierra Morena: Azorit et al. Citation2003) and France (Teillaud et al. Citation1991). The differences in cranial size from Spanish deer are related to the fact that data collected in southern spain refer to Iberian red deer (Cervus elaphus hispanicus), which belongs to the small-bodied red deer populations. The lower body mass and cranial measures found in red deer measured in France could be due to the elevated density of the studied population (6–9 red deer/100 ha).
The marked differences found in average body measures between all age groups of the same sex, indicate that biological classes commonly adopted for red deer management are also appropriate to classify different moments of its somatic growth. The preliminary t-test suggested that in calves of our sample (age >5 months), hind foot length, body weight (both eviscerated and whole weight) and mandible width were the only measures which differed significantly between the sexes, therefore they could be employed to determine sex in case of datasets with incomplete information; consistently, in white-tailed deer hind foot length alone has already been used to determine age and, in some cases, the sex of the animals (Fuller et al. Citation1989).
Antler characters have been frequently used as quality index in many cervids and, in red deer yearlings, beam length is known to be related to population density and it represents a good measure of their condition (Schmidt et al. Citation2001). In yearlings of our sample, antler length was constant during the first decade of management. The data collected on red deer antlers as part of an investigation on the Acquerino population (Mazzarone & Mattioli Citation1996) prior the beginning of hunting management (i.e. in the mid-90s), highlighted for adult stags greater antler measurements than the ones from our sample. Also the occurrence of bez tine has decreased, passing from 82.5% to 50%, while the occurrence of palmate antlers increased from 10% to 48%. Antler beam length is greater than in adult deer from small-bodied red deer populations of Sardinia (Caboni et al. Citation2006), Mesola (Mattioli & Ferretti Citation2014), south-eastern Spain (Azorit et al. Citation2002).
A trend in body weight during the hunting period and winter was clear only in adult stags, which experienced a marked weight decline from September to November. Red deer stags deposit fat reserves during spring and summer as provision for the season of rut (Bobek et al. Citation1990) and the subsequent weight loss is the result of massive body fat and lean muscle tissue catabolization due both to high energy expenditure during rutting period and to reduced food consumption throughout autumn and winter. Weight loss did not affect noticeably yearlings and subadults, probably owing to an age-dependent cessation of feeding (Mysterud et al. Citation2004). In Alpine deer, Mattiello et al. (Citation2003) highlighted a marked negative correlation between body weight and culling date. Clutton-Brock et al. (Citation1982) found that rutting stags (5–10 yrs) of Rum Isle experienced a considerable weight decline in the same period, and that they could lose as much as 20% of their body weight during the rut; a even higher weight loss during rutting period was found in red deer stags from Poland (Bobek et al. Citation1990; Dzięciołowski et al. Citation1996; Janiszewski et al. Citation2011). The eviscerated weight in animals of other age classes and sex was rather constant during winter; Janiszewski and Szczepański (Citation2004) found a similar stability of weight during winter in hinds and calves from Poland.
The close relationship between eviscerated body weight and whole body weight could allow to estimate the latter measure in incomplete datasets, especially for subadults and yearling stags whose R2 is equal or above 0.9. Since slopes of the regression differed significantly between age classes in males, we discourage the adoption of a unique equation for this sex.
Growth curves fitted on the sample of deer proved to match their actual size at maturity and provide a general pattern of skeletal development for both sexes. In our sample, hind foot length grows extremely rapidly after birth evenly in both sexes, and completed the largest part of its growing process far earlier than all other measurements. The presence of desirable features like rapid growth, also detected in other cervids (Odocoileus hemionus sitkensis: Klein Citation1964; Odocoileus virginianus: Fuller et al. Citation1989; Cervus nippon yesoensis: Suzuki et al. Citation2001) and easy measurability, could suggest this bone to be considered as an indicator of variations in environment, climate or population density; in roe deer (Capreolus capreolus) hind foot length has been used as indicator (Zannèse et al. Citation2006), being able to detect such trends over long time series. In red deer from Apennine the relationship between cohort hind foot length and environmental, climatic and demographic variables has to be tested: indeed, ecological indicators should have a growth rate that is sensitive to small differences and changes in nutrition (Challies Citation1978). In deer of our sample, mandible length completes most of its growth around the third year of age both in stags and in hinds, and is the skeletal measure which displays the longest period of growth. This skeletal measurement was found to be sensitive to fluctuation in nutrition of roe deer (Hewison et al. Citation1996) and in fallow deer (Nugent & Frampton Citation1994), making its average size in a particular cohort a potential suitable index for detecting variations of skeletal size in time (Hewison et al.Citation1996).
Conclusions
This study represents a first analysis of over a decade of measurements on part of the red deer population living in Northern Apennine.
Despite the accuracy of collectable data could be perfectible, at present selective hunting represents the only means to obtain a great amount of biometric measures in wild ungulates: this large available information allows examining several aspects useful to advice management.
The analysis of morphometric data collected on red deer of Prato Province in the first twelve years of management revealed that body size attained by the sampled animals was consistent with the size reported for other deer in Northern Apennine, with the exception of deer from Bologna side. The comparison between antler features collected in 1990s and during the time span of this study, suggests a slight regression along time. The analysis of skeletal development have consolidated the suitability of mandible length and hind foot length as indicators for long-term monitoring of red deer, due to their easy measurability and high growth constants within a brief growing process. We propose the use of the estimated linear regressions, applicable to red deer living within this study area, to convert eviscerated weight in whole weight and vice versa.
This first result on the morphometry of red deer from Northern Apennine encourages further studies on a wider sample in time and space. Of course, the availability of precise age-related measures could enhance the quality of the obtained information: ISPRA has recently produced a method for age estimation based on identification keys on tooth (De Marinis Citation2015), that has to be applied in the forthcoming hunting seasons.
This method should provide a rapid and more accurate attribution to yearly age classes, and allow the permanent and long-term collection of biometric data exploitable to complement a more precise adaptive-management strategy.
Compliance with ethical standards
The authors declare that to their knowledge all applicable ethical guidelines were followed. This article does not contain any studies with human participants performed by any of the authors.
Acknowledgements
We wish to thank the Servizio Caccia e Pesca of the Province of Prato (Italy) for authorizing the use of red deer measurements data collected during hunting seasons from 2000 to 2012. A special thanks to all the wildlife technicians of ACATER, who organize and supervise the collection of morphometric data and to Stefano Mattioli for the precious comments and suggestions given to the Authors.
Disclosure statement
The authors report no conflicts of interest. The authors alone are responsible for the content and writing of this article.
References
- Albon SD, Mitchell B, Staines BW. 1983. Fertility and body weight in female red deer: a density-dependent relationship. J Anim Ecol. 52:969–980.
- Albon SD, Mitchell B, Huby BJ, Brown D. 1986. Fertility in female red deer (Cervus elaphus): the effects of body composition, age and reproductive status. J Zool. 209:447–460.
- Azorit C, Analla M, Carrasco R, Muñoz-Cobo J. 2002. Influence of age and environment on antler traits in Spanish red deer (Cervus elaphus hispanicus). Z Jagdwiss. 48:137–144.
- Azorit C, Analla M, Muñoz-Cobo J. 2003. Variation of mandible size in red deer Cervus elaphus hispanicus from southern Spain. Acta Theriol. 48:221–228.
- Beccu E. 1989. Il cervo sardo: origini, biologia, diffusione, ambiente e salvaguardia della specie. Sassari (Italy): Carlo Delfino Editore.
- Bertalanffy L. V. 1938. A quantitative theory of organic growth (Inquiries on growth laws. II). Hum Biol. 10:181–213.
- Bertouille SB, De Crombrugghe SA. 1995. Body mass and lower mandible development of the female red deer as indices of habitat quality in the ardennes. Acta Theriol. 40:145–162.
- Bertouille SB, De Crombrugghe SA. 2002. Fertility of red deer in relation to area, age, body mass, and mandible length. Z Jagdwiss. 48:87–98.
- Bobek B, Perzanowski K, Weiner J. 1990. Energy expenditure for reproduction in male red deer. J Mammal. 71:230–232.
- Brisbin IL, Jr, White GC, Bush PB. 1986. PCB intake and the growth of waterfowl: multivariate analyses based on a reparameterized Richards sigmoid model. Growth. 50:1–11.
- Brisbin IL, Jr., Collins CT, White GC, Mccallum DA. 1987. A new paradigm for the analysis and interpretation of growth data: the shape of things to come. AUK. 104:552–554.
- Brugnoli A. 1993. Il cervo in provincia di Trento: situazione attuale ed analisi degli abbattimenti 1990–1991. Dendronatura. 1:45–54.
- Caboni A, Murgia C, Mattioli S. 2006. Antler characteristics of the Sardinian red deer (Cervus elaphus corsicanus): a preliminary analysis. In: Bartoš L, Dušek A, Kotrba R, Bartošová-Víchová J, eds. Advances in deer biology. Deer in a changing world. Proceedings of the 6th Deer Biology Congress; 2006. Prague (Czech Republic).
- Challies CN. 1978. Assessment of the physical well-being of red deer (Cervus elaphus L.) populations in South Westland, New Zealand [thesis]. Christchurch (New Zealand): University of Canterbury.
- Clutton-Brock TH, Guinness FE, Albon SA. 1982. Red deer: behavior and ecology of two sexes. Chicago (IL, USA): The University of Chicago Press.
- De Marinis AM. 2015. Valutazione dell’età nei Cervidi tramite esame della dentatura. Guida pratica all’identificazione delle classi di età del Cervo. Manuali e Linee Guida n. 90.2/2013. Brancati, Roma (Italy): ISPRA.
- Dzięciołowski R, Babinska-Werka J, Goszczynski J, Wasilewski M. 1996. Physical condition of red deer in a high density population. Zeszyty Problemowe Postepow Nauk Rolniczych. 41:93–105.
- Fontana R, Lanzi A, Musarò C, Reggioni W, Riga F, Viliani M. 2014. Programma annuale operativo 2014/15 relazione consuntiva 2013/14. [Italian]. Available from: http://agricoltura.regione.emilia-romagna.it/caccia/temi/ungulati/documenti-ungulati/acater-occidentale/relazione-consuntiva-2013-2014-e-programma-annuale-operativo-2014-2015/view
- Fuller TK, Richard MPIII, Markl JA, Coy PL. 1989. Morphometrics of white-tailed deer in North-Central Minnesota. J Mammal. 70:184–188.
- Gaggioli A. 2005. Caratterizzazione biometrica di una popolazione di cervo (Cervus elaphus) dell’Appennino Tosco-Emiliano [dissertation]. Firenze (Italy): University of Firenze.
- Gaillard JM, Delorme D, Boutin JM, Van Laere G, Boisaubert B. 1996. Body mass of roe deer fawns during winter in 2 contrasting populations. J Wildlife Manage. 60:29–36.
- Hewison AJM, Vincent JP, Bideau E, Angibault JM, Putman RJ. 1996. Variation in cohort mandible size as an index of roe deer (Capreolus capreolus) densities and population trends. J Zool London. 239:573–581.
- Janiszewski P, Szczepański W. 2004. Charakterystyka masy tusz bykow, lan i cielat jelenia szlachetnego [Cervus elaphus L.] pozyskanych w okresie jesienno-zimowym. Sylwan. 1:33–38.
- Janiszewski P, Gugołek A, Hanzal V, Bółkowski D. 2011. Variability of the carcass weight of the red deer (Cervus elaphus L.) in Poland. Pol J Natur Sci. 26:99–110.
- Klein DR. 1964. Range-related differences in growth of deer reflected in skeletal ratios. J Mammal. 45:226–235.
- Langvatn R, Albon SD, Burkey T, Clutton-Brock TH. 1996. Climate, plant phenology and variation in age at first reproduction in a temperate herbivore. J Anim Ecol. 65:653–670.
- Langvatn R, Mysterud A, Stenseth NC. 2004. Relationship in red deer Cervus elaphus mandibles. Acta Theriol. 49:527–542.
- Leberg PL, Brisbin IL, Jr, Smith MH, White GC. 1989. Factors affecting the analysis of growth patterns of large mammals. J Mammal. 70:275–283.
- Mattiello S, Galli A, Bianchi A, Pirola A, Pasini C, Redaelli W, Carenzi C. 2003. Biometria e condizioni fisiche di cervi abbattuti in Valtellina. Habitat. V-VI:9–16.
- Mattiello S, Mazzarone V. 2010. Il cervo in Italia: biologia e gestione tra Alpi e Appennini. Teggiano (SA), Italy: Geographica. ISBN: 9788890522918.
- Mattioli L, Viliani M, Matteucci C, Grigioni J, Riga F. 2014. Analisi consuntiva gestione annata 2013-2014 e programma annuale operativo di gestione del cervo 2014-2015. Available from: http://agricoltura.regione.emilia-romagna.it/caccia/temi/ungulati/documenti-ungulati/acater-orientale/relazione-consuntiva-2013-2014-e-programma-annuale-di-gestione-2014-2015/view
- Mattioli S, De Marinis AM. 2009. Guida al rilevamento biometrico degli Ungulati. Ozzano dell’Emilia (Italy): Istituto Superiore per la Protezione e la Ricerca Ambientale, Documenti Tecnici, 28: 1–216.
- Mattioli S, Ferretti F. 2014. Morphometric charcaterization of Mesola red deer Cervus elaphus italicus (Mammalia: Cervidae). Ital J Zool. 81:144–154.
- Mattioli S, Nicoloso S, Pelliccioni Raganella E, Viliani M. 2014. Analisi consultiva stagione faunistico-venatoria 2013-14 e programma annuale operativo di gestione del cervo 2014-2015. 2014. Available from: http://agricoltura.regione.emilia-romagna.it/caccia/temi/ungulati/documenti-ungulati/acater-centrale/relazione-consuntiva-2013-2014-e-programma-annuale-operativo-2014-2015/view
- Mazzarone V, Mattioli S. 1996. Indagine sulla popolazione di cervo dell’Acquerino. Firenze (Italy): Edizioni Regione Toscana.
- Mysterud A, Yoccoz NG, Stenseth NC, Langvatn R. 2001. Effects of age, sex and density on body weight of Norwegian red deer: evidence of density-dependent senescence. Proc Biol Sci 268:911–919.
- Mysterud A, Langvatn R, Stenseth NC. 2004. Patterns of reproductive effort in male ungulates. J Zool. 264:209–215.
- Nicoloso S, Vagaggini L, Ciuti F, Brugnoli A. 2007. Un progetto di miglioramento ambientale per il Cervo nell’Appennino Tosco-Emiliano. Forest@. 4:159–169.
- Nicoloso S, Viliani M, Mattioli S, Riga F. 2010. Analisi consultiva stagioni faunistico-venatorie dal 2005-06 al 2009-10 e programma annuale operativo di gestione del cervo 2010-2011. Available from: http://agricoltura.regione.emilia-romagna.it/caccia/temi/ungulati/documenti-ungulati/acater-centrale/relazioni-consuntive-dal-2005-6-al-2009-10-e-programma-annuale-operativo-2010-2011/view
- Nugent G, Frampton C. 1994. Microgeographic and temporal variation in mandible size within a New Zealand fallow deer (Dama dama) population. J Appl Ecol. 31:253–262.
- Pérez‐Barbería FJ, Duff EI, Brewer MJ, Guinness FE. 2014. Evaluation of methods to age Scottish red deer: the balance between accuracy and practicality. J Zool. 294:180–189.
- Pettorelli N, Gaillard JM, Van Laere G, Duncan P, Kjellander P, Liberg O, Delorme D, Maillard D. 2002. Variations in adult body mass in roe deer: the effects of population density at birth and of habitat quality. Proc Biol Sci. 269:747–753.
- Post E, Stenseth NC, Langvatn R, Fromentin JM. 1997. Global climate change and phenotypic variation among red deer cohorts. Proc Biol Sci. 264:1317–1324.
- Rieck W. 1955. Die Setzzeit bei Reh-, Rot-, und Damwild in Mitteleuropa. Z Jagdwiss. 1:69–75. German.
- Schmidt KT, Stien A, Albon SD, Guinness FE. 2001. Antler length of yearling red deer is determined by population density, weather and early life-history. Oecologia. 127:191–197.
- Soriguer RC, Fandos P, Bernáldez E, Delibes JR. 1994. El ciervo en Andalucía. Sevilla (Spain): Junta de Andalucia.
- Suzuki M, Onuma M, Yokoyama M, Kaji K, Yamanaka M, Ohtaishi N. 2001. Body size, sexual dimorphism, and seasonal mass fluctuations in a larger sika deer subspecies, the Hokkaido sika deer (Cervus nippon yesoensis Heude, 1884). Can J Zoolog. 79:154–159.
- Teillaud P, Bon R, Gonzalez G, Schaal A, Ballon P, Campan R. 1991. Les Ongulés sauvages de France: bilan des recherches récentes. Rev Ecol-Terre Vie. 5:185–217.
- Toïgo C, Gaillard JM, Van Laere G, Hewison M, Morellet N. 2006. How does environmental variation influence body mass, body size, and body condition? Roe deer as a case study. Ecography. 29:301–308.
- Zannèse A, Baïsse A, Gaillard JM, Hewison MAJ, Saint-Hilaire K, Toïgo C, Van Laere G, Morellet N. 2006. Hind foot length: an indicator for monitoring roe deer populations at a landscape scale. Wildlife Soc B. 34:351–358.