
 ?Mathematical formulae have been encoded as MathML and are displayed in this HTML version using MathJax in order to improve their display. Uncheck the box to turn MathJax off. This feature requires Javascript. Click on a formula to zoom.
Abstract
The aim of this study was to evaluate the effect of increasing accuracy of genomic selection, achieved by larger training set, on the economic efficiency of breeding programme in dairy cattle. A deterministic model compatible with the Iranian Holstein population, was developed. Gene flow method was applied to estimate genetic and economic parameters of simulated programme over 20 years for milk production. By increasing the number of individuals in training set from 500 to 3500, the accuracy of genomic evaluations increased from 0.62 to 0.82. However, maximum economic efficiency (13.83) was achieved at the accuracy of 0.72 using 1000 individuals in the training set, indicating that the genomic accuracy has an optimum value with respect to economic efficiency. A range of genotyping costs, from 50 to US$400, were examined and the corresponding optimum accuracy was estimated. Although the genotyping cost has a negative effect on the economic efficiency, but it had a minor effect on the optimum accuracy. Varying the heritability from 0.18 to 0.36 did not affect the optimal accuracy. The results of this study demonstrated that achieving higher accuracies of genomic value through allocating more individuals in training set, would not necessarily lead to more economic efficiency. The effect of varying genotyping cost on optimal structure of genomic selection programme could be negligible. The optimal size of training set would not be affected by heritability, although the maximum economic efficiency of selection programme could be affected.
Introduction
Maximising benefit and particularly economic efficiencies in a competitive market are often the main goals of dairy cattle breeding programmes (Dickerson Citation1978). In comparison with conventional progeny test, genomic selection reduces costs and generation intervals of different selection paths (Schaeffer Citation2006). One of the most important advantages of genomic selection schemes is achieving higher accuracy of estimated breeding values at early stages for animals without own records or progeny information, in particular on traits where recording phenotypic records is difficult, or traits with low heritability (Meuwissen et al. Citation2001).
Deterministic equations to estimate selection accuracy, based on the information about the number of animals in the training set, the heritability of the trait or the reliability of breeding values in a sire population and the effective number of independent genome segments (Me) were proposed by Daetwyler et al. (Citation2010) and Goddard et al. (Citation2011). Erbe et al. (Citation2013) adjusted Goddard et al. (Citation2011) formulas by including also a weighting factor which accounts for the fact that not all genetic variance can be captured if the number of markers is limited. The formulas suggested by Daetwyler et al. (Citation2010) and Goddard et al. (Citation2011) were derived from stochastic simulation. Erbe et al. (Citation2013) adjusted Goddard et al. (Citation2011) formula by validation on real data through including a weighting factor which accounts for the fact that not all genetic variance can be captured if the number of markers is limited.
Daetwyler et al. (Citation2010) demonstrated that higher reliabilities for genomic selection are theoretically expected with larger reference male or female populations. On the other hand, because of the reliable phenotypic information resulted from a large group of daughters, progeny-tested bulls often construct the training set of genomic selection. Combining data from different populations has been expressed as an efficient method of improving the accuracy of genomic selection (e.g. Zhou et al. Citation2013; Su et al. Citation2014).
König et al. (Citation2009) and Thomasen et al. (Citation2014) evaluated the potential effects of increasing genotyping cost and accuracies on discounted profit of genomic selection schemes without considering the costs related to increase in the number of individuals in the training set and recording their daughters. Börner and Reinsch (Citation2012) assessed optimisation of genomic breeding programme under a cost limitation strategy, without incorporating the cost of performance recording of bulls' daughters in training set. Gonzalez-Recio et al. (Citation2014) demonstrated that in order to widespread application of genomic selection programme, the available phenotypic records of daughters would be reduced and there would be a great need for investing on recording daughters of reference population.
In the above-mentioned studies, effect of increasing individuals in the training set and subsequent performance recording of their daughters on economic efficiency of genomic selection programme were not considered. By considering genotyping and recording costs some questions arises. Is there an optimum level for accuracy and number of individuals in training set, from economical point of view? Do heritability and cost of genotyping affect these optimal levels? How far are the optimal levels from accepted levels of accuracy in dairy cattle market? Therefore, in this study, we aimed to consider effect of increasing accuracy of genomic evaluations resulted from an increase in the number of individuals in the training set on economic efficiency of dairy cattle selection programme.
Materials and methods
Estimation of genetic and economic parameters
A deterministic model based on the gene flow method (Hill Citation1974) was used to estimate effect of altering accuracy of genomic selection evaluations (AGSE) on economic efficiency (EE) of selection programme through time horizon of 20 years. All simulated scenarios were compared with respect to their expected asymptotic or equilibrium phase gain. All calculations were undertaken by programming in MATLAB 8.0 language (The MathWorks, Inc., Natick, MA).
Population structure, productive, reproductive and cost parameters were chosen to reflect the dairy cattle production system in Iran. In this study, milk production was considered as the selection goal, with a heritability and a genetic standard deviation of 0.29 and 477 kg, respectively, based on the average estimates published by Chegini et al. (Citation2013) and Ghavi Hossein-Zadeh (Citation2011) for Holstein cows in Iran. Breeding and productive parameters of Iranian Holstein cattle are summarised in Table . EE was calculated as the ratio of the revenues to the costs of simulated programmes.
Table 1. Breeding and productive parameters.
General structure of genomic selection programme
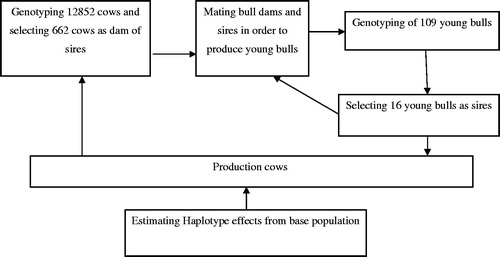
The general structure of genomic selection simulation is presented in Figure . Recalculation of haplotype effects in the training set was assumed to be performed in every 2 years. Selection paths were consisted of sires (S), dam of sires (DS) and dam of dams (DD). Elite cows were selected from a population of 502,400 Holstein cows at the age of 15 months. The required number of preselected cows (12,852) for being genotyped was calculated as a product of replacement rate and available number of cows in the DS path. After genomic evaluations, 662 elite dams were selected as DS to produce 109 young bulls. The available young bulls produced by DS were genetically evaluated at the age of 1 year, and among them, 16 young bulls were selected to sire next generation for a 4 years interval.
Figure 1. The general structure of genomic selection simulation.
Computation of accuracy
In order to assess the economic impacts arising from varying the AGSE, the number of individuals in training set (Np) was altered and the relevant accuracy was calculated. On the basis of Erbe et al. (Citation2013), the AGSE in the DS and S paths were calculated as
(1)
(1)
where w stands for the proportion of genetic variance captured by markers and was assumed to be 0.875 (Erbe et al. Citation2013). The R2 is the reliability of breeding values in the sire’s population and was calculated by
and n is the number of daughters per progeny tested bulls. Also, Me is the number of independent genome segments. In all paths, except DD, selection based on genomic information was implemented. Accuracy of DD path was calculated as the square root of heritability. Ne was calculated based on Goddard and Smith (Citation1990) theory which emphasises that the inbreeding, in the nucleus, controls inbreeding rate in the whole population. Therefore, based on the Falconer and Mackay (Citation1996) formula, Ne was calculated by the use of the number of tested bulls and the required number of dam of sires path. Estimated effective number (Ne) of Holstein population in Iran was about 62.49. According to this Ne, the calculated Me was equal to 440.07 based on Goddard (Citation2009).
Economic model
Costs consisted of quarantine costs, proofing and after proof costs which were summated together to total costs. Quarantine costs included cost of testing for disease, feeding and maintenance through 6 months quarantine. Proofing costs consisted of genotyping, maintenance and feeding costs.
In order to estimate the haplotype effects, it was assumed that progeny tested sires with 100 daughter records per sire construct the training set. Genotyping cost in the training set was calculated by the following formula:
(2)
(2)
where Gscost is the total genotyping cost, NYB is the number of young bulls, rrds is the replacement rate in DS path, NDS is DS available individuals, 2 is the time interval for haplotype effects recalculation and Genotype\c s genotyping cost per individual. Finally the proofing cost was estimated as follows:
(3)
(3)
where prove\c s proofing cost, C\YB s cost of purchasing each young bull, Feed\c s feeding cost per young bull and Record\c s recording cost of all young bull daughters.
Simulation steps
In the first section of this study, Np varied from 500 to 3500 in steps of 500 individuals to search the optimum number of Np with respect to maximum EE, using the base parameters. The initial value of genotyping cost was assumed to be US$100. In the second section, the genotyping cost was altered from 50 to 400 US$ in steps of 50, and the optimal AGSE and Np were found per each level of genotyping cost. In the third section, optimal AGSE and Np were estimated per each level of heritability of milk production, varied from 0.18 to 0.36. Costs and returns of each year were scaled by the corresponding discounting factor. The discounting factor for year t was calculated as the follows:
(4)
(4)
where r is referred as the discounted rate. Total discounted costs (TDC) and total discounted returns (TDR) were calculated as the sum of the discounted costs and returns through 70 years. The total discounted benefit (DB) was calculated as TDR minus TDC. The economic efficiency (EE) was obtained as the ratio of TDR to TDC. The EE was considered as an index of market compatibility, as the commercial breeding programmes operating in a competitive market do not drive their income from increased profit but from increased market share and EE (Dickerson Citation1978). The structure of simulated scenarios which resulted in maximum DB or EE was determined.
Results and discussion
The effect of varying number of individuals in Np on economic efficiency (EE), accuracy of genomic accuracy (AGSE), genetic gain, discounted benefit (DB) and total discounted cost (TDC) for milk production is presented in Table . On one hand, modifying the size of training set from 500 to 3500 enhanced the AGSE from 0.62 to 0.82; and as a consequence, the genetic gain from 0.0188 to 0.0246 kg. On the other hand, more TDC per dairy cattle was induced to the programme as Np increased. According to these results, an increase in Np by seven-times would increase the TDC about 1.76-times. In spite of increment in TDC, the value of DB increased about US$284.1. The EE fluctuated with different patterns. The maximum EE of 13.83 was achieved at 1000 individuals in the training set, and the corresponding accuracy was 0.72. Despite continual increase in AGSE and subsequent genetic gain throughout the range of Np, a descending trend in EE was observed beyond the 1000 Np. It was the result of higher rate of TDC (at greater values of Np) over returns (obtained from genetic gain). In fact, there was an optimum level for accuracy (0.72) which resulted in maximum EE. However, as shown in Table , declining trend of economic efficiency at Np >1000 was not associated with reduction in DB, as it raised slightly by increasing Np levels. In a competitive market, economic efficiency is an effective index to make breeding decisions (Dickerson Citation1978). Therefore, by considering the economic efficiency as the selection goal, there was an optimal value for AGSE which was equal to 0.72 in the base condition in current study.
Table 2. Effect of the size of training set on economic efficiency, accuracy, genetic gain and cost (h2 = 0.29 and genotyping cost = US$100).
Consistent with the results of this study, in many researches, the positive effect of increasing the number of individuals in the training set on the accuracy of genomic evaluations was reported (i.e. Liu et al. Citation2011; Su et al. Citation2014). Liu et al. (Citation2011) observed 28% increase in accuracy when the number of individuals in training set was varied from 5025 to 17,429. Su et al. (Citation2014) stated that by merging 1157 progeny tested US Jersey bulls into 1262 progeny tested Danish training set, accuracy of GEBV increased in average by 4%. In these studies, economic factors, optimal level of accuracy and size of the training set in genomic selection programme were neglected.
König et al. (Citation2009) studied the economic aspects of genomic selection and stated that improving the accuracy of genomic selection from 0.70 to 0.99 led to 50% increase in discounted profit. They concluded that raising the accuracy of GEBV would result in further increase of profit. In another study, Thomasen et al. (Citation2014) reported 13% higher discounted profit in response to 40% improvement in the accuracy of a three-trait selection index in a small population. In these studies, the additional costs associated more individuals being genotyped was not considered; therefore, their estimated discounted profit could be overestimated.
Gonzalez-Recio et al. (Citation2014) stated that the minimum acceptable level of accuracy in the dairy industry for a trait with the heritability of 0.30 was equal to 0.65, while König and Swalve (Citation2009) indicated that the necessary accuracy for attracting breeders was about 0.80. According to these results, the estimated optimal level of accuracy may be near to the acceptable values in market.
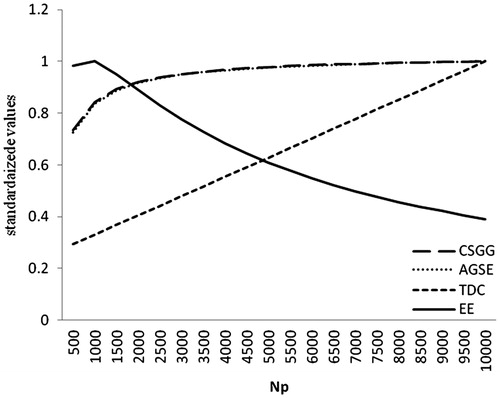
The effect of varying Np on EE, AGSE, genetic gain and TDC is depicted in Figure . In order to unify the scales of EE, AGSE, genetic gain and TDC, values for each variable were divided to the corresponding maximum value. Similar to Figure , by increasing Np, EE enhanced during the first phase and after meeting the maximum level, it began to decrease. The diminishing trend of economic efficiency was fast; therefore, ignoring the optimal point could intensively affect the EE. Initially, the AGSE faced with a rapid increase, but by assuming Np to over 2000 individuals, its improvement rate decreased. The curves of AGSE and genetic gain overlapped, showing the effect of AGSE on genetic gain. For Np’s over 1000, the rate of genetic gain improvement was less than TDC and therefore, a descending trend in the values of EE was observed. Hence, the determination of the optimal level of accuracy to achieve the maximum efficiency in breeding programmes based on genomic information seems to be reasonable.
Figure 2. Effect of varying the number of individuals in training set (Np), on economic efficiency (EE), accuracy of genomic selection evaluation (AGSE), continuous selections genetic gain (CSGG) and total discounted cost (TDC).
The effect of genotyping cost on maximum EE, optimal Np, AGSE, genetic gain, DB and TDC for milk production is shown in Table . Optimal values of parameters (AGSEopt, NpOpt, CGopt, TDCopt and DBopt) were the values at which maximum EE was achieved. As shown in Table , by arising genotyping cost from 50 to US$400 in steps of US$50, the optimal AGSE enhanced slightly from 0.63 to 0.72, and the corresponding level of Np enlarged from 500 to 1000 individuals, which was associated with an increase of TDC about US$118.15. Increment of TDC led to almost 9.45 unit reduction in the maximum EE. By those levels of genotyping costs associating to the same value of optimum Np (i.e. 100–400 US$), genotyping cost had negative, but a small effect on DB. Similar to the present study, König et al. (Citation2009) reported that effect of genotyping cost on the discounted profit was negligible. According to results of current study, the genotyping cost per animal had negative effect on the EE and as genotyping cost increased more individuals in training set were needed to cover the higher induced costs through higher genetic gain. It can be concluded that the optimal size of training set, and also the optimum level of accuracy, and in general, optimum structure of a genomic selection programme had a little sensitivity to the variation of genotyping cost.
Table 3. Effect of genotyping cost on the maximum efficiency and optimum number of training set, accuracy and genetic gain.
The effect of heritability on maximum economic efficiency and optimal number of individuals in the training set, accuracy and genetic gain, discounted benefit and total discounted cost of simulated programme per dairy cattle for milk production is shown in Table . Higher levels of h2 as associated with a slight growth in optimal AGSE. Hence, by doubling the value of heritability, the optimum accuracy of breeding evaluations in sires of training set and the optimum accuracies of genomic evaluations increased about 0.083 and 0.01, respectively. Because of indirect and small effect of heritability on accuracy of genomic selection, genetic gain increment was negligible. However, increasing the heritability from 0.18 to 0.36 did not change the optimal number of individuals in the training set. A considerable increase in maximum economic efficiency (about 2.23) was observed as heritability increased. However, the results implied that the optimal structure of genomic evaluations was almost robust to the alteration of heritability.
Table 4. Effect of heritability on the maximum economic efficiency and optimal number of training set, accuracy and genetic gain.
Joezy-Shekalgorabi et al. (Citation2010) estimated the maximum economic efficiency of a progeny test programme in Iran, and the corresponding level of test capacity and number of daughters per progeny testing bull. The maximum efficiency was 2.61 and achieved by using a test capacity of 10% and 141 daughters per progeny testing bull. The maximum efficiency from progeny testing programme was much less than the estimated economic efficiencies in the present study, which demonstrates the necessity of replacing progeny testing programme with an optimised genomic selection programme.
Conclusions
The results of this study showed that achieving higher accuracies by increasing the size of training set would not necessarily led to the maximum economic efficiency. The optimal value of genomic selections accuracy and the corresponding number of animals in the training set should be estimated according to economic and breeding situation of target population. In Iran’s condition, the optimal accuracy of genomic selection was about 0.63 which would be achieved by allocating 1000 individuals in the training set. The cost of genotyping had a little effect on the optimal accuracy and the size of training set. Variation of heritability did not affect the optimal accuracy and the size of training set, while this factor increased the economic efficiency.
Disclosure statement
The authors report no conflicts of interest. The authors alone are responsible for the content and writing of this article.
References
- Börner V, Reinsch N. 2012. Optimising multistage dairy cattle breeding schemes including genomic selection using decorrelated or optimum selection indices. Genet Sel Evol. 44:1–11.
- Chegini A, Shadparvar AA, Ghavi Hossein-Zadeh N. 2013. Genetic trends for milk yield, persistency of milk yield, somatic cell count and calving interval in Holstein dairy cows of Iran. Iran J Appl Anim Sci. 3:503–508.
- Daetwyler HD, Pong-Wong R, Villanueva B, Woolliams JA. 2010. The impact of genetic architecture on genome-wide evaluation methods. Genetics. 185:1021–1031.
- Dickerson GE. 1978. Animal size and efficiency: basic concepts. Anim Prod. 27:367–379.
- Erbe M, Gredler B, Seefried FR, Bapst B, Simianer H. 2013. A function accounting for training set size and marker density to model the average accuracy of genomic prediction. PLoS One. 8:e81046.
- Falconer DS, Mackay TFC. 1996. Introduction to quantitative genetics. 4th rev. ed. Harlow, UK: Longman Group, Ltd.
- Ghavi Hossein-Zadeh N. 2011. Genetic parameters and trends for calving interval in the first three lactations of Iranian Holsteins. Trop Anim Health Prod. 43:1111–1115.
- Goddard M. 2009. Genomic selection: prediction of accuracy and maximisation of long term response. Genetica. 136:245–257.
- Goddard ME, Hayes BJ, Meuwissen THE. 2011. Using the genomic relationship matrix to predict the accuracy of genomic selection. J Anim Breed Genet. 128:409–421.
- Goddard MG, Smith TFC. 1990. Optimum number of bull sires in dairy cattle breeding. J Dairy Sci. 73: 1113–1122.
- Gonzalez-Recio O, Coffey MP, Pryce JE. 2014. On the value of the phenotypes in the genomic era. J Dairy Sci. 97:1–11.
- Hill WG. 1974. Prediction and evaluation of response to selection with overlapping generations. Anim Prod. 18:174–189.
- Joezy-Shekalgorabi S, Shadparvar AA, Vaez Torshizi R, Shahrebabak M, Jorjani H. 2010. Genetic analysis of a conventional progeny testing. In: Proceedings of the 9th WCGALP; Leipzig, Germany; paper 220, 4 pp.
- König S, Simianer H, Willam A. 2009. Economic evaluation of genomic breeding programs. J Dairy Sci. 92:382–391.
- König S, Swalve HH. 2009. Application of selection index calculations to determine selection strategies in genomic breeding programs. J Dairy Sci. 92:5292–5303.
- Liu Z, Seefried FR, Reinhardt F, Rensing S, Thaller G, Reents R. 2011. Impacts of both reference population size and inclusion of a residual polygenic effect on the accuracy of genomic prediction. Genet Sel Evol. 43:19–32.
- Meuwissen THE, Hayes B, Goddard ME. 2001. Prediction of total genetic value using genome-wide dense marker maps. Genetics. 157:1819–1829.
- Schaeffer LR. 2006. Strategy for applying genome-wide selection in dairy cattle. J Anim Breed Genet. 123:218–223.
- Su G, Nielsen US, Wiggans G, Aamand GP, Guldbrandtsen B, Lund MS. 2014. Improving genomic prediction for Danish Jersey using a joint Danish-US reference population. In: Proceedings of the 10th World Congress on Genetics Applied to Livestock Production; Vancouver, BC, Canada; Comm. 060. [cited 2015 Jan 28] Available from: https://asas.org/docs/default-source/wcgalp-proceedings-oral/060_paper_8823_manuscript_396_0.pdf.
- Thomasen JR, Egger-Danner C, Willam A, Guldbrandtsen B, Lund MS, Sørensen AC. 2014. Genomic selection strategies in a small dairy cattle population evaluated for genetic gain and profit. J Dairy Sci. 97:458–470.
- Zhou L, Ding X, Zhang Q, Wang Y, Lund MS, Su G. 2013. Consistency of linkage disequilibrium between Chinese and Nordic Holsteins and genomic prediction for Chinese Holsteins using a joint reference population. Genet Sel Evol. 45:7–14.