
Abstract
The aim of study was to determine the effect of pre-calving body condition score (BCS) and previous milk yield on BCS change, blood metabolites, oxidative stress and milk production in Holstein cows. At 3 wk before expected calving, 100 multiparous cows were grouped according to their BCS and then classified based the previous 305 milk yield. The four experimental groups (25 cows each) were medium BCS and moderate milk yield (MM), medium BCS and high milk yield (MH), high BCS and moderate milk yield (HM), and high BCS and high milk yield (HH). The cows’ BCS was recorded at −21, 0, 21, 50 and 80 d related to parturition time. Daily milk production of cows was recorded after parturition. Blood samples were taken at d −21, −7, +1, +7 and +21 postpartum. The HH cows had lower (p <.05) plasma insulin than MH group. Also, the HH cows had lowest (p <.05) plasma insulin at 7 d after calving. Cows with high BCS had greater (p <.05) NEFA and BHBA concentration than medium BCS groups. Cows with high BCS had lower activity of antioxidant enzymes (p <.05) compared to medium BCS groups. Milk production, fat-corrected milk (FCM) and energy-corrected milk (ECM) were affected (p <.05) by pre-calving BCS and previous milk yield. Pre-calving BCS and previous milk yield affect (p <.05) milk fat production. In conclusion, the HH cows have greater milk production; however they are susceptible to oxidative stress and metabolic disorders risk based on their blood metabolites.
Introduction
Dairy cows are exposed to several physiological challenges during the transition period which might result in greater oxidative stress and metabolic disorders (Drackley Citation1999; Bernabucci et al. Citation2005). In this period, dairy cows experience several metabolic challenges characterised by decrease in responsiveness of tissues to insulin (Ingvartsen & Andersen Citation2000) and increase in liver gluconeogenesis (Reynolds et al. Citation2003). Moreover, drastic metabolic and endocrine adjustments for postpartum milk production induce negative energy balance (NEB) that lead the cows to mobilise stored triglycerides of adipose tissue to compensate their energy demand (Pires et al. Citation2013).
It is well known that BCS at calving and the decrease in BCS post-calving can affect milk production and metabolic status of dairy cows (Roche et al. Citation2009). Actually, energy partitioning between the mammary gland and peripheral tissues could increase plasma non-esterified fatty acids (NEFA), lipid peroxidation, reactive oxygen species (ROS), reduce the antioxidant capacity and inflammatory responses (Chan et al. Citation2002; Bernabucci et al. Citation2005; Castillo et al. Citation2005). Several studies reported that oxidative stress is the aetiology of many calving-related abnormalities (Lykkesfeldt & Svendsen Citation2007; Celi Citation2011). The incidence of oxidative stress especially as a result of high BCS (Bernabucci et al. Citation2005) or milk yield (Castillo et al. Citation2005) in dairy cows has been observed. Cows with high milk yield have higher concentrations of ROS than lower yielding animals (Castillo et al. Citation2003; Lohrke et al. Citation2004). It is reported that in last weeks of pregnancy and at the beginning of lactation, high energy demand intensify maternal metabolism due to augmented mitochondrial activity in maternal tissues (Aurousseau et al. Citation2006). Also during this period, competition for nutrients (energy, protein, minerals and antioxidants) may occur between the cow and the calf (Lean et al. Citation2014). Therefore, production of ROS during late gestation (Castillo et al. Citation2005) and early lactation (Pedernera et al. Citation2010) is intensified and it is reasonable to assume that the high BCS combined with high milk yield in the previous lactation might result in higher metabolic and oxidative stress.
To our knowledge, little information is available about the interactions between BCS and metabolic/oxidative status in relation to milk yield potential. We hypothesised that the metabolic and redox homeostasis of dairy cows may be affected by both milk yield and pre-calving BCS, hence we expected to observe higher metabolic and oxidative stress in the cows with higher BCS and higher milk yield. This study aimed to investigate the effect of pre-calving BCS and previous milk yield on BCS change, blood metabolites, oxidative status and milk production and milk quality in Holstein dairy cows.
Materials and methods
Animals, housing and feeding
The trial was carried out in a large commercial dairy herd consisting of 3500 lactating cows, located in Isfahan district (FKA dairy farm, Isfahan, Iran) during the winter 2015 with mean temperature and relative humidity of 7 °C and 51%, respectively. Multiparous Holstein cows (n = 100) were randomly selected from 3 wk before expected calving until the 80 d postpartum. Before the starting of experiment, dairy cows were classified according to their BCS (1–5 scales with 0.25 intervals, Edmonson et al. Citation1989) as medium BCS (3.25 ≤ BCS ≤3.75) and high BCS (BCS ≥4), and then 50 cows for each class were assigned. Then, the cows were further classified according to their previous lactation performance (305 milk yield) as moderate milk yield (10,500–12,000 kg; n = 50) or high milk yield (13,500–15,000 kg; n = 50). The following four experimental groups consisting of 25 cows each were obtained: (1) medium BCS and moderate milk yield (MM), (2) medium BCS and high milk yield (MH), (3) high BCS and moderate milk yield (HM), and (4) high BCS and high milk yield (HH). Moreover, the four experimental groups were balanced across expected calving date and parity (2.8 ± 0.8 of parity).
The cows were housed in free stall barns, milked 3 times daily (08.00, 16.00 and 24.00), had free access to water, and fed ad libitum twice daily (08.00 and 16.00) with total mixed diet (TMR) formulated to meet all their nutrient requirements based on the NRC (Citation2001) and farm nutrition consultant suggestions (Table ).
Table 1. Ingredient and nutrient compositions of diets administered during the experimental period.
Sampling and measurements
During the trial, BCS of cows was recorded at 3 wk before expected calving (−21) and then at 0, 21, 50 and 80 d postpartum using a 5-point scale with 0.25 intervals (Edmonson et al. Citation1989). Back fat thickness in sacral region was measured by a veterinarian using ultrasound and then the data was converted to BCS (Schroder & Staufenbiel Citation2006).
Blood samples were taken from the coccygeal vein of all cows before morning feeding at d 21 and 7 before expected calving, and at d 1, 7 and 21 postpartum. Blood samples were drawn into evacuated tubes containing EDTA (10.5 mg, Monoject, Sherwood Medical, St. Louis, MO). Plasma was separated by centrifugation at 3000 × g for 20 min at 4 °C and 3 aliquots of separated plasma frozen at −20 °C until further analyses. Plasma was analysed for glucose (Cat No. 1-500-017), albumin (Cat No. 1-500-001), triglyceride (Cat No. 1-500-032) and cholesterol (Cat No. 1-500-010) with commercial kits (Pars Azmoon Co, Tehran, Iran) while insulin were assayed by ELISA (DiaPlus Instruments, Inc., Chatsworth, CA; assay sensitivity of 0.5μIU/ml, Cat No. DP2416) and progesterone by ELISA (Diaplus, North York, Canada, Cat No. DP4816). Intra- and inter-CV were 5.37% and 6.80% for insulin, and 2.2% and 3.3% for progesterone. Plasma concentrations of NEFA and BHBA were determined by an enzymatic colorimetric method using commercial kits (Randox Lab. Ltd, UK, FA115 and RB1007). The principle for the NEFA test involves acylation of coenzyme A by fatty acids in the sample in the presence of acyl-CoA synthetase and production of hydrogen peroxide in the presence of acyl-CoA oxidase. The principle for the BHBA test involves conversion of BHBA in the samples to acetoacetate and NADH at pH 8.5 by β-hydroxybutyrate dehydrogenase in the presence of NADH (Odhiambo et al. Citation2013). Intra- and inter-CV were 2.3% and 5.1% for BHBA, and 3.2% and 6.3% for NEFA, respectively. Plasma malondialdehyde (MDA) was determined based on the colourful complex formed from the reaction of malondialdehyde (MDA) with 2-thiobarbituric acid (2-TBA, Sigma-Aldrich, Cat No. T5500) in acid environment according to Bilici et al. (Citation2001) and Wullepit et al. (Citation2012). Total antioxidant capacity (TAC) was measured using a commercial kit (Randox Lab. Ltd, UK, Cat No. NX2332). The EDTA-whole blood samples were used to determine enzymatic activity of superoxide dismutase (SOD) and glutathione peroxidase (GSH-Px). Erythrocyte lysate was prepared according to the manufacturer’s guidelines (Randox Lab. Ltd, UK, Cat NO. SD125) and analysed to determine SOD activity using automatic analyser (Alycon300, Dual voltage instrument, Kallaroo, WA) at 505 nm wavelength. SOD activity was measured based on the degree of inhibition of the reaction between superoxide radicals and 2-(4-iodophenil)-3-(4-nitrophenol)-5-phenitetrazolium chloride. Erythrocyte GSH-Px activity was determined at 340 nm based on the kinetic method, which measures the decrease in absorbance by oxidised form of glutathione overtime. This was measured by GSH-Px kit (Randox Lab. Ltd, Crumlin, UK, Cat No. RS 505) and automatic analyser (Alycon300, Dual voltage instrument).
The cows were milked 3 times a day and daily milk production of all cows were recorded every day till the 80 days in milk (DIM). Milk samples of all cows in each group were collected every other week from 3 consecutive milking, and then the samples of each cow were composited in a 50 mL Falcon tube and frozen at −20 °C until analysis. Milk samples were analysed for milk fat and milk protein by an automatic milk composition analyser (MilkoScan134BN; FossElectric, Hillerød, Denmark). The data of milk production were analysed in the periods of 1–21, 22–50, 51–80 and 1–80 d.
Statistical analysis
The PROC MIXED of SAS (Citation2003) was used for all determined variables with repeated measures. Pre-calving BCS level, previous milk yield and parity included as a fixed effects and cow as a random effect. All possible 2- and 3-way interactions were concerned. Variance–covariance structures (AR1), compound symmetric (CS) and heterogeneous variances were used depending on the Schwarz Bayesian criterion. The following model was used in this study:
where Yijklm = dependent variable; μ = overall mean; Ai = fixed effect of pre-calving BCS; Bj = fixed effect of previous milk yield; ABij= interaction of pre-calving BCS × previous milk yield; tk = fixed effect of time; (AB × t)ijk = two-way interactions between treatments and time; parityl= fixed effect of parity; cow(AB)ijm= random effect of cow nested within treatments and eijklm = unexplained residual with normal distribution. Data were subjected to the method of normality test for residue. The logarithmic transformation was used for TG, BHBA and GSH-px. The significant level was declared at p ≤ .05, and tend toward significance was considered at .05 < p ≤ .10 by the Tukey test.
Results
A few cases of metabolic disorders with clinical signs were observed in this experiment. So, the data were not reported.
Changes in BCS
Results showed that at the start of the experiment, BCS of HH and HM groups (4.43 and 4.38, respectively) was greater (p <.05) than BCS of MH and MM groups (3.30 and 3.36, respectively) (Figure ). BCS decreased (p <.05) in all groups during the entire study, but the decreasing rate was more pronounced in cows with high BCS (HM and HH) compared to cows with medium BCS (MM and MH). Our results showed that previous milk yield and the interaction of BCS × milk yield had no effect on overall BCS and BCS changes (Table ). The BCS changes of HH and HM groups was greater (p <.05) than MH and MM groups before calving, after calving and during the entire study. Overall, HH and HM groups loss about 1 score during the entire study that was three times more than MM group.
Figure 1. Least square means ± SE of BCS in multiparous Holstein dairy cow. MM: medium BCS and moderate milk yield; MH: medium BCS and high milk yield; HM: high BCS and moderate milk yield; HH: high BCS and high milk yield. Statistically significant (p < .05) effects between the two groups of BCS (medium and high) during before calving (BCS; time); after calving (BCS; time; BCS × time); the entire study (BCS; time; BCS × time).
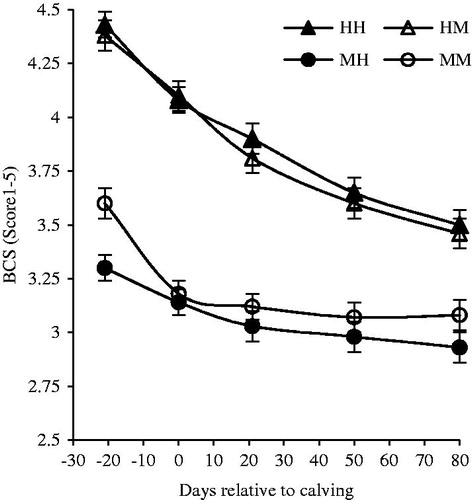
Table 2. Effect of BCS at close-up and previous milk yield (305, DIM) on BCS change (Mean ± SEM) before and after calving in multiparous Holstein dairy cow.
Plasma metabolites and insulin
Plasma glucose, triglyceride and cholesterol concentration were not affected by pre-calving BCS, milk yield and their interaction (Table ). However, the time effect was significant (p <.01) for glucose and cholesterol metabolites.
Table 3. Effect of BCS at close-up and previous milk yield (305, DIM) on concentration of plasma metabolites and insulin (Mean ± SEM) in Holstein dairy cows during transition period (days −21 to 21).
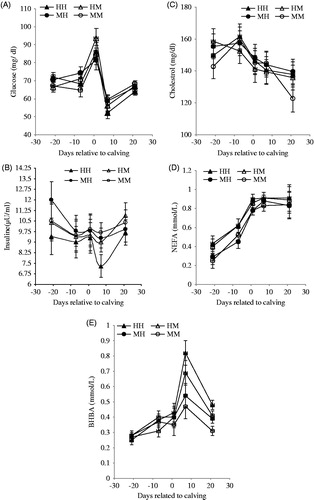
The interaction with time showed that plasma glucose concentration increased in all experimental groups at d 1 and was greater (p <.05) in HM group than the other groups (Figure ). Then, plasma glucose decreased markedly at 7 d after calving and was lower (p <.05) in HH group compared with other groups. BCS and milk yield had no significant effect on plasma insulin concentration. However, the interaction of BCS × milk yield was significant (p <.05) in this regard, and cows grouped as MH had greater (p <.05) plasma insulin than HH cows (10.16 vs 8.90 μIU/mL) throughout the transition period (Table ). At d 7 after calving, the plasma insulin concentration decreased in all groups mainly in the HH group (p <.05) (Figure ). The change of plasma triglycerides concentration during the transition period was not affected by the experimental groups. Plasma cholesterol concentration decreased (p <.05) after calving in all experimental groups (Figure ), and the decreasing rate of cholesterol concentration was greater in MM cow. The effect of BCS level on NEFA and BHBA was significant (p <.05), so high BCS cows had greater NEFA and BHBA concentration than medium BCS cows (Table ). Interaction with time showed that plasma NEFA concentration increased before calving, and peaked at 1–7 d after calving and afterward was relatively constant in all groups (Figure ). Plasma BHBA concentration peaked at 7 d after calving in all groups. At this time, HH and HM groups had greater (p <.05) plasma BHBA compared to MH and MM groups (Figure ).
Figure 2. Effects of close-up BCS and previous milk yield (305-DIM) on plasma metabolites, and insulin in Holstein dairy cows during transition period (days −21 to 21). MM: medium BCS and moderate milk yield; MH: medium BCS and high milk yield; HM: high BCS and moderate milk yield; HH: high BCS and high milk yield.
Oxidative status
The concentrations of plasma albumin and MDA were not affected by pre-calving BCS, previous milk yield and their interaction (Table ). Albumin decreased (p <.05) at 1 d after calving in HM cows (Figure ). The concentration of MDA increased around calving in all groups and HH cows had greatest (p <.05) concentration of MDA (Figure ). Plasma SOD were affected by pre-calving BCS, so the cows with high BCS had lower (p <.05) SOD activity than cows with medium BCS. The interaction of BCS × milk yield on SOD activity tended to be significant (p =.07) (Table ). The HH and HM cows had lower activity of SOD compared to MM and MH cows during the transition period and the lowest activity was observed at 21 d after calving (p <.05) (Figure ). GSH-Px activity was affected by both pre-calving BCS (p <.05) and previous lactation milk yield (p <.05), and their interaction tended to be significant (p =.06) (Table ). Cows with high BCS presented lower (p <.05) GSH-Px activity than cows with medium BCS. On the other hand, cows with high milk yield had higher (p <.05) GSH-Px activity compared to the cows with moderate milk yield. During the transition period, the activity of GSH-Px markedly increased (p <.05) in MH group after calving (Figure ). TAC did not get affected by pre-calving BCS, whereas previously milk yield and interaction of BCS × milk yield tend to be significant (p = .08). TAC increased before calving in all groups (p <.05) and they continued to increase only in the MH group until 7 d after calving (Figure ).
Figure 3. Effects of close-up BCS and previous milk yield (305-DIM) on plasma oxidative status indices in Holstein dairy cows during transition period (days −21 to 21). MM: medium BCS and moderate milk yield; MH: medium BCS and high milk yield; HM: high BCS and moderate milk yield; HH: high BCS and high milk yield.
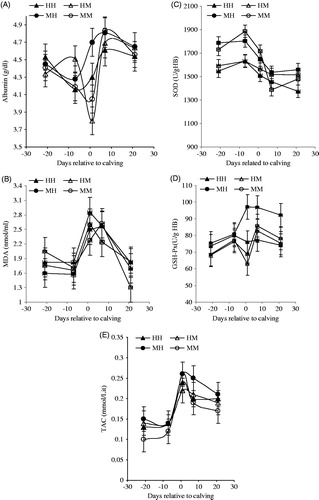
Table 4. Effect of BCS at close-up and previous milk yield (305, DIM) on oxidative status indices (Mean ± SEM) in Holstein dairy cows during transition period (days −21 to 21).
Milk production
Results showed that milk production, fat-corrected milk (FCM) and energy-corrected milk (ECM) were affected (p <.05) by pre-calving BCS (Table ), such that cows with high BCS had higher milk production than cows with medium BCS. Similarly, previous milk yield affected (p <.05) milk production, FCM and ECM such that cows with high milk yield during the previous lactation had higher (p <.05) milk production than that the moderate milk yield groups. Overall, the cows grouped as HH had greatest (p <.05) milk production, FCM and ECM compared to the other groups. Pre-calving BCS, previous lacation milk yield and their interaction had no significant effect on milk fat percentage. However, milk fat production was affected (p <.05) by pre-calving BCS and previous milk yield, so that cows with high BCS had greater milk fat production entire the study (1–80 DIM) than the cows with medium BCS. Milk fat production was different between cows with moderate and high milk yield and the last group had higher (p <.05) milk fat production.
Table 5. Effect of BCS at close-up and previous milk yield (305, DIM) on milk production performance (Mean ± SEM) in Holstein dairy cows during the first 80 DIM (days 1–80).
Discussion
Change in BCS
The cows grouped as HH and HM mobilised greater body fat reserves than the cows grouped as MM and MH that was in agreement to previous reports (Roche et al. Citation2009; Pires et al. Citation2013). However, our finding clarified that the changes in BCS were not affected by previous lactation milk yield.
Plasma metabolites and insulin
The results of the present study indicated that serum glucose increased in all groups before calving (Figure ) and at the same time insulin decreased (Figure ). The increase in plasma glucose concentration might be attributed to cortisol and oestrogen (Weber et al. Citation2013) or inherent hypoinsulinemia which reduce glucose uptake by tissues sensitive to insulin (Bauman Citation2000). Weber et al. (Citation2013) reported a marked decrease in plasma glucose and insulin during early lactation in cows with high liver fat concentration.
Roberts et al. (Citation2012) reported that in North-American dairy systems, multiparous cows with plasma NEFA concentrations greater than 0.8 mmol/L during early lactation have 2–4 times greater risk of culling. In the present study, cows with high pre-calving BCS (HH and HM groups) had a sharp increase in plasma NEFA concentrations which reached above this threshold at calving, suggesting that plasma NEFA concentration was not affected by the previous lactation milk yield. Melendez et al. (Citation2002) demonstrated that maximum concentration of NEFA (0.9–1.2 mEq/L) is related to parturition time with a slow decrease after 3 days postpartum. Plasma BHBA significantly increased during the first week after parturition in all groups and the HH and HM groups had the greatest BHBA levels at this time. The greater plasma BHBA and NEFA concentrations for cows with high pre-calving BCS are in accordance with other studies (Pires et al. Citation2013; Weber et al. Citation2013) and could be explained by high fat mobilisation. Furthermore, this condition could be attributed to the negative energy balance, plasma glucose and its precursors available for energy production by the liver (Weber et al. Citation2013). For this reason, as mentioned earlier, the HH group had lowest plasma glucose and highest BHBA 7 d after calving.
Oxidative status
The physiological events during the transition period might be responsible for some variations in dairy cows’ oxidative status (Celi Citation2011). Results of the present study indicated that the HH cows, which had higher concentrations of NEFA and BHBA, also presented higher oxidative stress. Our observations are in agreement with the findings of Bernabucci et al. (Citation2005), who noted that cows with a pre-calving BCS greater than 3 mobilise more body reserves in the post-partum period and experience more oxidative stress than animals with lower scores. Similarly, cows with high milk yields have higher levels of oxidative than lower yielding animals (Castillo et al. Citation2003; Lohrke et al. Citation2004). While there were no differences in plasma albumin and MDA concentrations between the experimental groups, the MH group showed the highest albumin levels at 1 d after calving. Bernabucci et al. (Citation2005) noted that albumin is exclusively synthesised by the liver, and it is the main source of plasma thiol groups which are considered as a significant element of the extracellular antioxidant defence system against oxidative stress (Celi & Gabai Citation2015). Our results showed that cows with medium BCS and high milk yield (MH) had greater GSH-Px. This result could be ascribed to the better metabolic status of the MH group after parturition. Our finding bring further support to the observation that postpartum homeostatic control of erythrocyte antioxidant enzymes has important effect on incidence of metabolic stress (Bernabucci et al. Citation2005).
Milk production
Dairy cows at the beginning of lactation need to mobilise their body reserves to meet their nutritional demands for milk synthesis (Drackley Citation1999). As mentioned before, cows with high BCS lose about 1 score during the entire study (Table ) and the greater loss of BCS could have sustained the concomitant higher milk production. For this reason, the cows with high BCS showed greater plasma NEFA and BHBA than medium BCS cows (Table ). In line with the results of our study, Pedernera et al. (Citation2010) demonstrated that cows with greater body reserve mobilisation tended to produce more milk than cows with medium or low levels of mobilisation. This finding confirms our results for greater ECM in cows with high close-up BCS. On the other hand, there is some evidence that high milk-producing cows may experience greater oxidative stress and therefore health problem or reproductive disorders (Castillo et al. Citation2003; Lohrke et al. Citation2004; Bernabucci et al. Citation2005). Finally, our results also showed that cows with high BCS had lower activity of GSH-px and SOD, greater BCS loss up to 80 DIM and higher plasma NEFA and BHBA concentrations. Therefore, the cows with high pre-calving BCS (HH and HM groups) may have greater sensitivity to oxidative stress.
Conclusions
The results of the present study showed that cows with high pre-calving BCS regardless of their milk yield potential had higher BCS lose, NEFA and BHBA, and lower erythrocyte GSH-Px activity. So, the cows with high pre-calving BCS need more attention in transition period to reduce their metabolic disorders and maintain their galactopoiesis. Feed supplementation with antioxidants as in this group of cows during the transition period should be considered. Moreover, the cows with medium BCS and moderate milk yield were susceptible to oxidative stress and metabolic disorders. The best metabolic status was observed in cows with medium BCS and high milk yield.
Disclosure statement
The authors report no conflicts of interest. The authors alone are responsible for the content and writing of this article.
Additional information
Funding
References
- Aurousseau B, Gruffat D, Durand D. 2006. Gestation linked radical oxygen species fluxes and vitamins and trace mineral deficiencies in the ruminant. Reprod Nutr Dev. 46:601–620.
- Bauman DE. 2000. Regulation of nutrient partitioning during lactation: homeostasis and homeorhesis revisited. Proceeding of the IX International Symposium on Ruminant Physiology; 1999 Oct 17–21; Pretoria South Africa, p. 311–328.
- Bernabucci U, Ronchi B, Lacetera N, Nardone A. 2005. Influence of body condition score on the relationship between metabolic status and oxidative stress in periparturient dairy cows. J Dairy Sci. 88:2017–2026.
- Bilici M, Efe H, Arif Koroglu M, Avni Uydu H, Bekaroglu M, Deger O. 2001. Anti-oxidative enzyme activities and lipid peroxidation in major depression: alterations by antidepressant treatments. J Affect Disord. 64:43–51.
- Castillo C, Hernandez J, Lopez-Alonso M, Miranda M, Benedito JL. 2003. Values of plasma lipid hydroperoxides and total antioxidant status in healthy dairy cows: preliminary observations. Archives Tierzucht. 46:227–233.
- Castillo C, Hernandez J, Bravo A, Lopez-Alonso M, Pereira V, Benedito JL. 2005. Oxidative status during late pregnancy and early lactation in dairy cows. Vet J. 169:286–292.
- Celi P. 2011. Oxidative stress in ruminants. In: Mandelker L, Vajdovich P, editors. Oxidative stress in applied basic research and clinical practice, studies on veterinary medicine. New York (NY): Humana Press, Springer; p. 191–231.
- Celi P, Gabai G. 2015. Oxidant/antioxidant balance in animal nutrition and health: the role of protein oxidation. Front Vet Sci. 2:48.
- Chan JC, Cheung JC, Stchouwer CD, Emeis JJ, Tong PC, Ko GT, Yudkin JS. 2002. The central role of obesity associated dyslipidaemia, endothelial activation and cytokines in the metabolic syndrome-An analysis by structural equation modeling. Int J Obes Relat Metab Disord. 26:994–1008.
- Drackley JK. 1999. ADSA Foundation Scholar Award. Biology of dairy cows during the transition period: the final frontier? J Dairy Sci. 82:2259–2273.
- Edmonson AJ, Lean IJ, Weaver LD, Farver T, Webster G. 1989. A body condition scoring chart for Holstein dairy cows. J Dairy Sci. 72:68–78.
- Ingvartsen KL, Andersen JB. 2000. Integration of metabolism and intake regulation: a review focusing on periparturient animals. J Dairy Sci. 83:1573–1597.
- Lean IJ, DeGaris PJ, Celi P, McNeill DM, Rodney RM, Fraser DR. 2014. Influencing the future: interactions of skeleton, energy, protein and calcium during late gestation and early lactation. Anim Prod Sci. 54:1177–1189.
- Lohrke B, Viergutz TT, Kanitz W, Gollnitz K, Becker F, Hurtienne A, Schweigert FJ. 2004. High milk yield in dairy cows associated with oxidant stress. Online J Vet Res. 8:70–78.
- Lykkesfeldt J, Svendsen O. 2007. Oxidants and antioxidants in disease: oxidative stress in farm animals. Vet J. 173:502–511.
- Melendez P, Donovan A, Risco CA, Hall MB, Littell R, Goff J. 2002. Metabolic responses of transition Holstein cows fed anionic salts and supplemented at calving with calcium and energy. J Dairy Sci. 85:1085–1092.
- NRC. 2001. Nutrient requirements of dairy cattle. 7th rev. ed. Washington (DC): National Academy of Sciences.
- Odhiambo JF, Farooq U, Dunn SM, Ametaj BN. 2013. Profiles of energy metabolites and haptoglobin in dairy cows under organic management in Alberta farms. Open J Anim Sci. 3:105–113.
- Pedernera M, Celi P, Garci SC, Salvin HE, Barchia I, Fulkerson WJ. 2010. Effect of diet, energy balance and milk production on oxidative stress in early-lactating dairy cows grazing pasture. Vet J. 186:352–357.
- Pires JAA, Delavaud C, Faulconnier Y, Pomiès D, Chilliard Y. 2013. Effects of body condition score at calving on indicators of fat and protein mobilization of periparturient Holstein-Friesian cows. J Dairy Sci. 96:6423–6439.
- Reynolds CK, Aikman PC, Lupoli B, Humphries DJ, Beever DE. 2003. Splanchnic metabolism of dairy cows during the transition from late gestation through early lactation. J Dairy Sci. 86:1201–1217.
- Roberts T, Chapinal N, LeBlanc SJ, Kelton DF, Dubuc J, Duffield TF. 2012. Metabolic parameters in transition cows as indicators for early-lactation culling risk. J Dairy Sci. 95:3057–3063.
- Roche JR, Frggens NC, Kay JK, Fisher MW, Stafford KJ, Berry DP. 2009. Invited review: body condition score and its association with dairy cow productivity, health, and welfare. J Dairy Sci. 92:5769–5801.
- SAS. 2003. SAS User’s Guide, Statistics. Statistical Analysis Systems. Version 9.1 ed. Cary, (NC), USA.
- Schroder UJ, Staufenbiel R. 2006. Invited review: methods to determine body fat reserves in the dairy cow with special regard to ultrasonographic measurement of back fat thickness. J Dairy Sci. 89:1–14.
- Weber C, Hametner C, Tuchscherer A, Losand B, Kanitz E, Otten W, Singh SP, Bruckmaier RM, Becker F, Kanitz W, et al. 2013. Variation in fat mobilization during early lactation differently affects feed intake, body condition, and lipid and glucose metabolism in high-yielding dairy cows. J Dairy Sci. 96:165–180.
- Wullepit N, Hostens M, Ginneberge C, Fievez V, Opsomer G, Fremaut D, De Smet S. 2012. Influence of a marine algae supplementation on the oxidative status of plasma in dairy cows during the periparturient period. Prev Vet Med. 103:298–303.