
Abstract
The aim of this trial was to compare the growth performance and meat yield and composition of SimGoud (Italian Simmental × Goudali, SG) crossbreed young bulls with those of pure Goudali (G) breed. Twenty-five G and 25 SG, from 20 to 41 months, reared together in Cameroon on native pasture were considered. Body size, growth and meat composition were compared. The SG crosses were more sized than the coetaneous pure G, having almost all body dimensions and mass index higher than G. Moreover, SG showed higher body weight at farm and ante-mortem than G, with about four times higher growth rate, but showed a marked loss of weight during transfer to slaughterhouse and lairage time. SG showed higher carcass weight and killing out percentage, in addition to a higher weight of rib steak and ribeye muscle at eighth–ninth rib section level than G. Despite the greater growth, differences between G and SG in beef proximate composition were not found. Genotype had a limited effect on fatty acids profile. However, G beef had greater CLA level, but lower MUFA content than SG. The study showed that G pure breed has much lower in vivo and slaughter performance than their crosses with the Italian Simmental breed, even if the meat composition was not different between the two genotypes. Conversely, despite similar pH of meat, G was more adaptable than SG to the severe transport condition and to the prolonged lairage time.
Introduction
Cameroon, with more than 5.9 million heads of cattle reared, plays a key role in the livestock production in the Central Africa sub-region. In this region, probably because of the limited local production, the trade with European Union for meat of bovine origin increased by four times in the last 5 years (European Commission Citation2016; FAO Citation2016).
In Cameron, beef has an important role in the diet of about 60% of the population (Ngalim Citation2015), constituting an increase of 29% in the last 10 years. This trend is expected to increase again by 107% when the projected population of 48 million of people is attained by the year 2050. On the contrary, the number of cattle reared has been stable in the course of the last 10 years (−0.8%; FAO Citation2016). In a wide survey performed in Cameroon, Nfor et al. (Citation2014a) showed that cattle generally had poor body condition score at slaughter, and low carcass weights, while meats derived from them were characterised by the low intramuscular fat content and high hardness. Moreover, Salifou et al. (Citation2013) highlighted that meat tenderness and nutritional properties are the most important for the consumers in developing countries. Consequently, there is a need to improve beef productivity not only in quantity but also in quality.
Tambi and Maina (Citation2003) reported that the low level of cattle productivity is common in many parts of Africa, such as Central and West Africa. The same authors reviewed that the main constraints that limit the productivity are related to the poor quality of the pasture and feed, health problems and poor genetic potential of cattle. From this point of view, the genetic improvement of cattle can be achieved by crossbreeding. In particular, crossbreeding beef cattle offers two primary advantages: the first is that the crossbred animals exhibit heterosis that allow us to improve traits even with low hereditability, while the second is that the crossbred animals combine the strength of the various breeds used to form the cross (López-Villalobos Citation1998). Wolfová et al. (Citation2007) and Güngör et al. (Citation2006) showed that performance of beef × dairy crosses were much more valuable than those of purebred dairy animals in terms of carcass and body weight, respectively. Moreover, considering that a greater proportion of cattle in Africa are Bos indicus spp. (Mwai et al. Citation2015), crossing Bos indicus × Bos taurus provides the possibility to combine the adaptation to the environment of local breed with the greater productivity of exotic breeds that have been developed through well-designed selection schemes. Indeed, with this kind of crossing, many authors improved the performance of both beef and dairy cattle (Kahi et al. Citation2000; Theunissen et al. Citation2014). From this perspective, the Societé de Développement et d’Exploitation des Productions Animales (SODEPA) in technical collaboration with the Breeders’ Association of Italian Simmental (ANAPRI) is working on an on-farm project to improve the animal production by crossbreeding Goudali (G) breed with the Italian Simmental one. The G, a Bos indicus, is a popular autochthonous beef-type with good growth rate and appreciable tolerance to endemic diseases (Nfor et al. Citation2014a; Ojong et al. Citation2016), while the Italian Simmental is a rustic, ecologically-friendly and dual-purpose Bos taurus breed (Piasentier et al. Citation2009). This controlled crossbreeding programme targets the establishment of a more productive stock with a relatively improved potential for beef and milk that can diversify and improve significantly the income of livestock farmers in Cameroon.
The number of studies focused on the effect of Bos indicus × Bos taurus crossing on meat characteristics is limited (Gama et al. Citation2013) and, information on the subject performed in Africa in order to improve local breeds through crossbreeding are scanty (Smith Citation2015). The aim of this study, therefore, is to assess the performance and meat quality of F1 young bulls obtained by crossing zebu G and Italian Simmental, within the aforementioned project.
Materials and methods
Experimental animals
Three hundred and thirty zebu G cows were recruited to constitute a breeding herd based on the following criteria: be between 5 and 8 years old, with at least two successful parturitions, of good mothering instincts, clinically healthy, nursing a calf of 1–3 months at point of recruitment and be in good body condition. The selected cows were individually identified by the use of plastic ear-tags and corresponding rumen transponders and then cordoned off within 600 ha of the 38,000 ha of Dumbo Ranch (Cameroon), located at Latitude 06°42′N and Longitude 10°25′E. They were organised into five artificial insemination breeding herds. Oestrus was synchronised and the cows bred using frozen 0.25 mL straw-type doses of semen from 13 different Italian Simmental bulls (IS). Each of the IS × G crossbred calf (SimGoud, SG) was identified after calving using a plastic ear-tag and after weaning by a corresponding rumen transponder. To constitute a control against which the performances of the crossbred calves could be monitored, purebred calves born about the same week by pure G cows on a natural mount in the same ranch under the same production environment were equally identified and subjected to the same nutritional plan (herbage grazed on the Western Highland Plateau Savannah pasture plus NaCl supplementation) and zoo-veterinary care, by introducing them together with their dams immediately after calving in the artificial insemination breeding herds.
Grazing and management were essentially extensive and the Western Highland Plateau Savannah pastures were composed principally of Hyparrhenia spp, Panicum maximum, Andropogon guyanensis, and Pennisetum purpurreum (Piot & Rippstein Citation1975). Health management routine involved dipping against ticks, vaccinations against pasteurellosis, contagious bovine pleuropneumonia, black quarter and infectious nodular dermatitis. The animals received de-wormers quarterly and trypanosomosis was controlled by biannual premonition with 1 g isomethamidium chloride solution at 2% concentration.
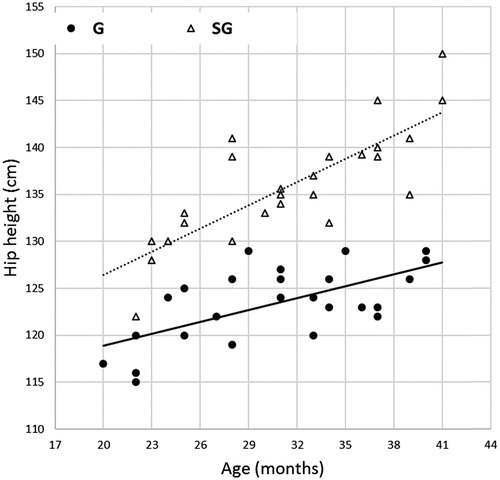
For performance and meat quality assessment, 42 months after the first SG calving, 50 young male bulls, 25 G (from 20 to 40 months) and 25 SG (from 22 to 41 months) from 20 to 41 months were randomly selected within 3-month-width animal cohorts of increasing age to assure a regular and substantially homogeneous age dispersion in the two genetic groups. The age distribution of the experimental young bulls is displayed in Figure .
Figure 1. Plot of the hip height distribution in relationship with the age of young bulls of different genotype (Goudali, G; SimGoud, SG) and regression lines representing the statistically different trend of the body dimension between genotypes.
Body measurements
The main body linear dimensions of bulls were measured and their weights (body weight at farm, BWfarm; Gallagher W210 Weigh Scale, Gallagher Animal Management, Hamilton, New Zealand) were taken in the ranch before transporting them to the slaughterhouse. In particular, the total top line, neck length, hip height, heart girth, flank circumference, rump length and width (at pinbones), shoulder width and chest depth were taken (http://www.bovineengineering.com/linear_male.html). The total top line is the total length of the animal taken from front of the pool to back of the rump. It is obtained from three measurements: neck length, body length (equal to the total top line minus the neck length) and rump length. The neck length is the distance from front of the pool to the middle dip in vertebrate (chine bone) between the shoulder blades. The hip height is the height of the cattle on the vertical line passing through the hips. The thoracic circumference or heart girth is the total distance around the animal taken at heart point. The flank circumference is the total distance around the animal taken at the hips. The chest depth is the distance taken with vertical calliper through the vertical transverse plane passing just to the rear of the point of the elbow. The shoulder width is the horizontal distance between shoulders. The rump length is the distance taken from the hips to the pin bones. The rump or pinbones width is the horizontal distance between the pin bones. The following biometric indexes were then calculated: mass index (MI = body weight at farm × 100/hip height) and chest depth index (CDI = chest depth ×100/hip height).
Animal transfer and slaughtering procedure
The cohort was moved initially on-foot for 8 d over 208 km to Bamenda (Cameroon) and then loaded in unspecialised animal transport trucks, as is commonly practiced by cattle traders, to Douala in an 8 h’ drive over 306 km. To allay stress, the animals were rested for five weeks at the Douala cattle market lairage during which they were grazed intermittently on native pastures on the outskirts of the town close to the market. After this period, the animals were slaughtered in the SODEPA industrial abattoir at Douala, following standard procedures.
After complete bleeding, the head was removed at the atlanto-occipital joint and weighed. The hide was cut along the limbs and down the abdomen then removed manually and weighed. The fore and the hind feet were removed with a knife at the proximal end of the metacarpal and metatarsal joints, respectively, and each was weighed with its hide cover. The tail was separated at the first inter-coccygeal articulation and weighed. After dressing and evisceration, the internal organs and offal were individually weighed. The kidneys and their surrounding fats were left attached to the carcass. Immediately after slaughter, the fifth quarter (FQ) components and the hot carcass weight (CW) were recorded and used to estimate the individual reconstructed ante-mortem BW (BWam), the approximate empty body weight (EBW = BWam − filled gut) and the transfer losses (Tlosses% = 100 × [BWfarm − BWam]/BWfarm). After chilling at 4 °C for 24 h, the half carcasses were weighted to obtain the cold carcass weight (CC) and the killing out percentage on the BWam (KO%).
Meat characteristics
After chilling for 24 h, from the left side of carcass, a sample joint was removed from the eighth to ninth ribs section and dissected in lean, fat, bone and other tissue portion (Andrighetto et al. Citation1996). The Longissimus thoracis muscle from this section was sampled and the pH (pH24) was measured, in three different points, by a pH-meter (HI 8424; Hanna Instruments, Padova, Italy) equipped with a glass electrode (5232; Crison, Barcelona, Spain) and a temperature probe for compensation. The sample was then vacuum-packed, rapidly frozen and stored at −20 °C until proximate and fatty acids analysis.
The proximate composition was performed according to AOAC (Citation2000). For the fatty acids (FA) analysis, the extraction of total lipids was performed according to the procedure of Folch et al. (Citation1957). Then, a total of 15 mg of nonadecanoic acid (C19:0) were added to a 1.5 g sample of minced meat and homogenised in 30 mL of a chloroform-methanol mixture (2:1 v/v) using an Ultra-Turrax homogeniser (T25 basic; Ika-Werke, Staufen, Germany). The sample was subsequently filtered under vacuum through a Whatman filter paper (No. 1820-047). The extract was washed with 8.5 mL of 0.88% (w/v) KCl, mixed vigorously for 60 s and then left overnight at room temperature. The organic phase was separated, and the solvents were evaporated under vacuum at 40 °C. Fatty acid methyl esters (FAME) were prepared using methanolic HCl (Sukhija & Palmquist Citation1988). Lipid samples were mixed with 2 mL of hexane and 3 mL of methanolic HCl in 20 mL glass tubes with Teflon lined caps. The mixture was heated at 70 °C for 2 h and then cooled to room temperature. The FAME were extracted in 2 mL of hexane after the addition of 5 mL of 6% (w/v) K2CO3 and Na2SO4 anhydrous. Samples stayed for 30 min prior to centrifugation at 1000 g for 10 min at 20 °C. The upper lipid layer was then removed, concentrated under N2 and diluted in hexane. The FAME were separated using a Carlo Erba gas chromatograph (GC) (HRGC 5300 mega-series; Rodano, Milano, Italy) fitted with an automatic sampler (A200S; Rodano, Milano, Italy) and a flame ionisation detector (FID). A 1-μL sample was injected in 1:30 split mode. The GC was equipped with a 60 m SP-2380 fused silica capillary column (0.25 mm i.d., film thickness 0.25 μm; Supelco Inc., Bellafonte, PA), and the oven temperature was increased from 160 to 180 °C at 1 °C/min, from 180 to 260 °C at 5 °C/min and then held at 260 °C for 5 min. Helium was used as the carrier gas at the rate of 1.2 mL/min, and FAME were identified using external standards (Supelco 37-component FAME mix including conjugated linoleic acids; Sigma-Aldrich, Milano, Italy). The FAME were quantified using C19:0 as the internal standard and were expressed as the percentage of the total FA that were identified.
Statistical analysis
Statistical analysis was performed using SPSS for Windows (SPSS Inc., Chicago, IL), version 7.5.21 (1989–1997). The normality of the data distribution was tested through the Shapiro–Wilk test. The effect of genotype was evaluated by the analysis of covariance using ‘genotype’ (G versus SG) as a fixed factor and ‘age’ as a covariate, an intra-class covariate when the intra-genotype coefficients were significantly different because of their interaction with genotype. When the covariate effect was significant, the genotype means were adjusted to a covariate mean age of 31 months, and the age coefficients reported in tables. Instead, when the intra-class ‘age*genotype’ effect was not significant, it was removed from the model and only the fixed effect of ‘genotype’ was included and its significance tabulated, provided that even a common slope of ‘age’ tested as an inter-class covariate was not significant; otherwise, the significant inter-class covariate was included in the model and the common age coefficient tabulated. The fixed genotype effect is the comparison between G and SG bulls at the average age of 31 months.
Results and discussion
Body dimensions
The body dimensions of the two genotypes are presented in Table , together with the age coefficient. This coefficient describes the average month variation of the dimension, i.e. the slope of its regression line over the bulls’ age, as graphically represented in Figure for the hip height. For that variable, the age regression coefficients were different between G and SG bulls as denoted by the significant effect of the interaction ‘genotype * age’ (Table ). Moreover, both slope values were significantly different from zero (p < .01; Table ). The SG crosses were more sized than the coetaneous pure G. All the body dimensions, except the neck length, were statistically (p < .05) or numerically (chest depth) larger in the crossbred bulls that also showed higher age coefficients (p < .05). This result is due to the combination of additive and heterosis gene effects. Bearing in mind that the F1 crosses are considered, the expected breed additive contributor and heterosis effect is 50% and 100%, respectively (Gregory & Cundiff Citation1980). At 31 months of age, SG bulls were 9% taller, 11% longer, 24–43% wider, at pin bones and shoulder than the coetaneous pure autochthonous bulls. The measurements of G bulls appear in line with data reported in the literature (Tawah & Rege Citation1996). SG bulls increased their size in comparison with pure G bulls without decreasing their vigour; indeed the heart girth was equal to total top line in both genotypes. A large girth is needed for proper size for vital organs (heart, lungs, glands), and the closer this measure is with the top line, the more vigorous the animal is (http://www.bovineengineering.com/linera_male.html).
Table 1. Adjusted means to 31 months of age and age evolution from 20 to 41 months of body dimensions (cm), mass index (MI, kg/cm*100), and chest depth index (CDI, %) taken at farm, of young bulls of different genotype (Goudali, G; SimGoud, SG).
Large flank measurement is indicative of the presence of meat on rump and it was higher in SG than G (p < .05). The mass index of 31-month old SG males was 48% higher than that of the same aged G (p < .05), which, however, showed a low MI in comparison with that reported by Crimella et al. (Citation2003), based on the ratio with withers height. Indeed, these authors calculated a body weight on height ratio of 230 and 249 kg/cm*100, respectively, for Adamawa G of both sexes weighing 280 and 307 kg, at 24 and 36 months. However, the height at withers corresponding to these values, i.e. 122 and 123 cm for G cattle of 24 and 36 months, are in line with our records. Chest depth and CDI did not differ between genotype (p > .05) and were slightly lower than expected; indeed, CDI for G was 46% instead of 49% as reported by Crimella et al. (Citation2003). The rump length was larger in SG than G bulls (p < .05); however, the percentage the rump makes up of the body length (100 × rump length/[total topline − neck length]) was similar between genotypes (36.4 versus 34.2%, in G versus SG, respectively, p > .05, not tabulated data). SG were wider at shoulder than G bulls (p < .05). Wide shoulders make room for vital organs like heart and lungs (http://www.bovineengineering.com/linera_male.html).
Body weight, carcass and fifth quarter characteristics
As expected, SG showed higher BWfarm than G (p < .05; Table ), with a four times higher growth rate between 20 and 41 months (9.46 versus 2.57 kg/month). Demeke et al. (Citation2003), crossing Simmental breed with three different Bos indicus breeds in tropical Africa improved the yearling weight from 19% to 20%. However, many authors reported that the possible heterosis effect is modulated by environment and production system (Barlow Citation1981; Gama et al. Citation2013). It is interesting to note that SG, despite having higher BWam than G (p < .05), showed a marked loss of weight during transfer and lairage time (6.1%). Conversely, G, during this period, was able to increase BW of 4.4%. Our results could be due to the higher nutrient requirements and/or to the lower adaptability to transfer condition of the crosses, SG, in comparison with the pure breed, G. At slaughter, SG showed higher carcass weight and KO% than G (p < .05; Table ) confirming the superiority of the F1 crosses in comparison with the pure breed. In a survey performed in Cameroon that involved G bulls from different production systems, Nfor et al. (Citation2014a) recorded a hot carcass weight of 152 kg at 4 years. Williams et al. (Citation2001) highlighted a positive heterosis effect on carcass weight crossing Bos taurus and Bos indicus breeds.
Table 2. Adjusted means to 31 months of age and age evolution from 20 to 41 months of weight of body, at farm and ante-mortem, fifth quarter and cold carcass, losses during transfer and killing out percentage of young bulls of different genotype (Goudali, G; SimGoud, SG).
Considering the fifth quarter composition as a percentage of the body mass (Table ), SG showed a significantly lower percentage of tail (p < .01) and filled gut (p < .01), but similar percentage of head, skin and pluck (p > .05) than G. The relative proportion on BW of the fifth quarter components during the period of growth between 20 and 41 months underwent only little variation in both genotypes.
Table 3. Adjusted means to 31 months of age and age evolution from 20 to 41 months of fifth quarter composition (% ante-mortem body weight, BWam) from young bulls of different genotype (Goudali, G; SimGoud, SG).
As reported in Table , SG showed significantly higher weight of rib steak and ribeye muscle at eighth–ninth rib section level than G (p < .05). The covariate, age, was significantly related to weight of rib steak and ribeye muscle for SG (p < .01), but not for G (p > .05). These results indicate that SG had a greater growth than G. In particular, considering the sampling joint composition, SG had higher percentage of lean tissue (p < .05), and similar percentage of fat and bone tissue (p > .05) than G (Table ). Corazzin et al. (Citation2012) in a study that considered Simmental young bulls fed with concentrate reported a sampling joint composition of 64.7% meat, 14.0% fat and 17.0% bone. The huge differences, particularly in fat percentage, between the two studies denote the effect of production system on meat composition. Perotto et al. (Citation2000) crossing Nellore, a Bos indicus breed, with Simmental, at the same fat content (15%), observed an increase, despite not significant, of 2.7% of the percentage of lean meat of sample joint at the twelfth rib. Theunissen et al. (Citation2014), crossing Bos taurus and Bos indicus breeds, observed an heterosis effect of +0.8% on meat yield that was estimated considering the dissection of sample joint at the eighth?tenth rib level. Considering the sample joint and KO results, it could be speculated that SG had better carcass conformation at slaughter than G.
Table 4. Adjusted means to 31 months of age and age evolution from 20 to 41 months of weight and tissue composition of the sampling cut (eighth–ninth rib section) from young bulls of different genotype (Goudali, G; SimGoud, SG).
Meat pH and composition
The pH24 was not different between genotypes (5.58 ± 0.014; p > .05; data not reported), suggesting a normal process of acidification of meat (Page et al. Citation2001). Longissimus thoracis proximate composition is shown in Table . Differences between G and SG were not found (p > .05). Marshall (Citation1994), reviewing the effects of different breed crosses, reported an average positive heterosis effect of 3.8% for marbling. Conversely, Gama et al. (Citation2013), crossing Bos taurus and Bos indicus breeds in pasture finishing conditions, showed a significant heterosis effect for moisture (+1.4%) but not for fat, protein and ash. The above-cited authors explained that heterosis effect is strongly influenced by the animals’ diet. Consequently, in our study, the lack of additive and heterosis effects at slaughter on meat fat content could be due to the restriction in feed availability and the severe conditions of bulls during transfer from farm to slaughterhouse that have caused a probable reduction of the final fat level in muscle. Indeed, the average fat (ether extract) level was low (0.68%) and much lower than the value of 1.34% reported by Nfor et al. (Citation2014b) in G reared in Cameroon and with similar feeding conditions, but transported to slaughterhouse by truck. Considering the low-fat content, below the suggested level to ensure an acceptable beef quality (3% fat; Savell & Cross Citation1988), meat from both genotypes could be poorly palatable. The average protein level found, 20.3%, fell within the range of 20.0–22.9% proposed for beef by Muchenje et al. (Citation2009), but it was lower than those showed by Salifou et al. (Citation2013) in zebu Fulani, of 21.7%, and by Nfor et al. (Citation2014a) in G bulls, of 22.1%, both reared on natural pasture in tropical environment.
Table 5. Means of Longissimus thoracis proximate composition (g/100 g fresh meat) of young bulls of different genotype (Goudali, G; SimGoud, SG) from 20 to 41 months of age.
The total FA weight and their relative proportion in muscle Longissimus thoracis according to genotype and age are shown in Table . The intramuscular fat content of meat was low and did not differ between genotypes, even if the SG beef tended to be fatter than G one (p = .10). However, the FA profile of G beef tended to have a greater content of C14:0 (p < .10), C14:1 (p < .10) and C18:3n-6 (p < .10), and showed a greater CLA level (p < .05) than SG beef. On the contrary, SG beef had higher total MUFA content (p < .01), and particularly C18:1n-9 (p < .01) and C18:1n-7 (p < .01), than G beef. Overall, genotype had a limited effect on FA profile. Bressan et al. (Citation2016) showed higher level of CLA and MUFA in the intramuscular fat of beef of Bos indicus than that of crossbred Bos taurus × Bos indicus bulls, however, in agreement with the results of the present study, also these authors highlighted a minor effect of crossing on FA of beef. Gama et al. (Citation2013) reported a low impact of heterosis on FA profile of beef from bulls fed with pasture-based diets. Moreover, De Smet et al. (Citation2004) explain that differences in FA composition between genotypes are mainly due to differences in fatness. Consequently, the similar diet of animals and fat content of beef may explain the lack of differences between genotypes. Indeed, the level of C18:3n-3 and C18:2n-6, that have dietary origin, was similar between genotypes (p > .05). The average level of PUFA, 17.8% of total FA, was much higher than those reported by Corazzin et al. (Citation2012) and Piasentier et al. (Citation2009) in beef of Italian Simmental young bulls fed with corn silage and hay-based diets. Apart from the effect of the relative high proportion of phospholipids in muscle expected in the very lean experimental animals, this result can be due to the high content of PUFA, and PUFA n-3 in particular that characterises the fresh forage from pasture (Webb & Erasmus Citation2013). Because of the high level of PUFA, the PUFA/SFA ratio, 0.35 ± 0.026 (p > .05; not tabulated data), was higher than the minimum level of 0.1 recommended by Department of Health of the United Kingdom (Citation1994). Conversely, the average n-6/n-3 PUFA ratio (2.17) was lower than the threshold of 4.0 suggested by the Department previously cited for having beneficial effects on human health. However, the n-6/n-3 PUFA ratio obtained in the present study is comparable with that observed by Nfor et al. (Citation2014b) in the beef of bulls of zebu breeds reared on natural pasture in Cameroon. The average CLA percentage falls within the range reported in literature for zebu and zebu derived cattle (0.15–0.43% of the total lipids) raised on natural pastures (De Mendoza et al. Citation2005; Muchenje et al. Citation2009; Salifou et al. Citation2013). With increasing age in both genotypes, there was a tendency of increase of SFA, C18:0 in particular that replaced long-chained PUFA probably because of an increasing in the neutral lipid/phospholipids ratio (Wood et al. Citation2008).
Table 6. Adjusted means to 31 months of age and age evolution from 20 to 41 months of total lipids (g/100 g fresh meat) content and fatty acid profile (% of total fatty acids) of Longissimus thoracis muscle from young bulls of different genotype (Goudali, G; SimGoud, SG).
Conclusions
The results of this study showed that G pure breed has much lower in vivo and slaughter performance than their crosses with Italian Simmental breed, but a similar beef composition characterised by a very low-fat content. This is probably because of the additive and heterosis effects that interact with severe environmental and experimental factors (restriction in feed availability and severe transport conditions). As stated by different authors, the potential improvements of crossing are possible only if feed availability and management conditions are appropriate. Among the lasts, our results highlight the possibility to improve bull’s transfer and pre-slaughter conditions, in order to maximise the crossbreeding effects.
Acknowledgements
Authors acknowledge the National Association of Italian Simmental Breeders (ANAPRI, Italy) for technical assistance and the staff of Societé de Développement et d’Exploitation des Productions Animales [Cameroon Livestock Development and Husbandry Corporation] (SODEPA, Cameroon) for animal sampling and data collection.
Disclosure statement
No potential conflict of interest was reported by the authors.
References
- Andrighetto I, Volpato MR, Andreoli D, Cozzi G. 1996. Impiego del taglio campione alla VIII costa per la stima della composizione della carcassa bovina. Zoot Nutr Anim. 22:311–321.
- AOAC. 2000. Official methods of analysis. Association of Official Analytical Chemistry, 17th ed. Gaithersburg (MD, USA).
- Barlow R. 1981. Experimental evidence for interaction between heterosis and environment in animals. Anim Breed. 49:715–737.
- Bressan MC, Rodrigues EC, de Paula ML, Ramos EM, Portugal PV, Silva JS, Bessa RB, da Gama LT. 2016. Differences in intramuscular fatty acid profiles of Bos indicus and crossbred Bos taurus × Bos indicus bulls finished on pasture or with concentrate feed in Brazil. Ital J Anim Sci. 15:10–21.
- Corazzin M, Bovolenta S, Sepulcri A, Piasentier E. 2012. Effect of whole linseed addition on meat production and quality of Italian Simmental and Holstein young bulls. Meat Sci. 90:99–105.
- Crimella C, Barbieri S, Giuliani MG, Zecchini M. 2003. Body measurements and morphological indexes of a cattle population in the Adamawa region (Cameroon). Ital J Anim Sci. 2(Suppl 1):340–342.
- De Mendoza GM, de Moreno LA, Huerta-Leidenz N, Uzćategui-Bracho B, Beriain MJ, Smith GC. 2005. Occurrence of conjugated linoleic acid in Longissimus dorsi muscle of water buffalo (Bubalus bubalis) and zebu-type cattle raised under savannah conditions. Meat Sci. 69:93–100.
- Department of Health of the United Kingdom. 1994. Nutritional aspects of cardiovascular disease. Report of the health and social subject, vol. 46. London: Her Majesty’s Stationery Office.
- De Smet S, Raes K, Demeyer D. 2004. Meat fatty acid composition as affected by fatness and genetic factors. Anim Res. 53:81–98.
- Demeke S, Neser FWC, Shoeman SJ. 2003. Early growth performance of Bos taurus × Bos indicus cattle crosses in Ethiopia: estimation of individual crossbreeding effects. J Anim Breed Genet. 120:245–257.
- European Commission. 2016. European Commission Statistics. Available from: http://exporthelp.europa.eu/thdapp/display.htm?page=st%2fst_Statistics.html&docType=main&languageId=en
- FAO. 2016. FAOSTAT database. Available from: http://faostat3.fao.org/home/E
- Folch J, Lees M, Sloane Stanley GH. 1957. A simple method for the isolation and purification of total lipids from animal tissues. J Biol Chem. 226:497–509.
- Gama LT, Bressan MC, Rodrigues LV, Moreira OC, Alves SP, Besa RJB. 2013. Heterosis for meat quality and fatty acid profiles in crosses among Bos indicus and Bos taurus finished on pasture or grain. Meat Sci. 93:98–104.
- Gregory KE, Cundiff LV. 1980. Crossbreeding in beef cattle: evaluation of systems. J Anim Sci. 51:1224–1242.
- Güngör M, Akbas Y, Alcicek A, Onenc A. 2006. Growth curve analysis for body weight and dry matter intake in Friesian, Limousin × Friesian and Piemontese × Friesian cattle. Archiv Fur Tierzucht. 49:329–339.
- Kahi AK, Thorpe W, Nitter G, Van Arendodonk GAM, Gall GF. 2000. Economic evaluation of crossbreeding for dairy production in pasture based production system in Kenya. Livest Prod Sci. 65:167–184.
- López-Villalobos N. 1998. Effects of crossbreeding and selection on the productivity and profitability of the New Zealand Dairy Industry [PhD dissertation]. Palmerston North: Massey University.
- Marshall DM. 1994. Breed differences and genetic parameters for body composition traits in beef cattle. J Anim Sci. 72:2745–2755.
- Muchenje V, Dzama K, Chimonyo M, Strydom PE, Hugo A, Raats JG. 2009. Some biochemical aspects pertaining to beef eating quality and consumer health: a review. Food Chem. 112:279–289.
- Mwai O, Hanotte O, Kwon YJ, Cho S. 2015. African indigenous cattle: unique genetic resources in a rapidly changing world. Asian Australas J Anim Sci. 28:911–921.
- Nfor BM, Corazzin M, Fonteh FA, Aziwo NT, Galeotti M, Piasentier E. 2014a. Quality and safety of beef produced in Central African sub-region. Ital J Anim Sci. 13:392–397.
- Nfor BM, Corazzin M, Fonteh FA, Sepulcri A, Aziwo NT, Piasentier E. 2014b. Fatty acid profile of zebu cattle from the Central African sub-region. S Afr J Anim Sci. 44:148–154.
- Ngalim AN. 2015. Cattle rearing systems in the North West Region of Cameroon: historical trends on changing techniques and strategies. J Educ Policy Entrepreneurial Res. 2:175–189.
- Ojong BW, Saccà E, Bessong P, Piasentier E. 2016. Prevalence of bovine dermatophilosis and disease-associated alleles in zebu Goudali cattle and their Italian Simmental crosses ranching in the western highland plateau savannah of Cameroon. Trop Anim Health Prod. 48:1329–1335.
- Page JK, Wulf DM, Schwotzer TR. 2001. A survey of beef muscle color and pH. J Anim Sci. 79:678–687.
- Perotto D, Dos Santos JJ, Moletta JL. 2000. Quantitative carcass traits of zebu and crossbred Bos taurus x zebu. Rev Bras Zootec. 29:2019–2029.
- Piasentier E, Bovolenta S, Moioli B, Orrù L, Valusso R, Corazzin M. 2009. Fatty acid composition and sensory properties of Italian Simmental beef as affected by gene frequency of Montbéliarde origin. Meat Sci. 83:543–550.
- Piot J, Rippstein G. 1975. The productivity, forage value, and dynamics of different cutting intervals of three natural rangeland formations of the Adamaoua plateau in Cameroon. Evaluation and mapping of tropical African rangelands. Bamako (Mali). Available from: http://agris.fao.org/agris-search/search.do?recordID=QM19770198947
- Salifou CFA, Dahouda M, Houaga I, Picard B, Hornick JL, Micol D, Kassa SK, Farougou F, Mensah GA, Clinquart A, et al. 2013. Muscle characteristics, meat tenderness and nutritional qualities traits of Borgou, Lagunaire and zebu Fulani bulls raised on natural pasture in Benin. Int J Anim Vet Adv. 5:143–155.
- Savell JW, Cross HR. 1988. The role of fat in the palatability of beef, pork, and lamb. Designing foods: animal product options in the marketplace. Washington (DC): National Academy Press.
- Smith J. 2015. African livestock transformation. Background paper. Dakar: United Nations Economic Commission for Africa.
- Sukhija PS, Palmquist DL. 1988. Rapid method for determination of fatty acid content and composition of feedstuffs and feces. J Agric Food Chem. 36:1202–1206.
- Tambi NE, Maina OW. 2003. Patterns of change in beef production and consumption in Africa. Rev Off Int Epizoot. 22:965–976.
- Tawah CL, Rege JEO. 1996. Gudali and White Fulani cattle of West and Central Africa. Anim Genet Res Inf. 17:159–178.
- Theunissen A, Scholtz MM, MacNeil MD, Neser FWC. 2014. Breed additive and heterosis effects on feedlot and carcass traits in beef cattle. In: Proceedings 10th World Congress of Genetics Applied to Livestock Production; August 17–22. Vancouver (Canada).
- Webb EC, Erasmus LJ. 2013. The effect of production system and management practices on the quality of meat products from ruminant livestock. S Afr J Anim Sci. 43:413–423.
- Williams JL, Aguilar I, Rekaya R, Bertrand JK. 2001. Estimation of breed and heterosis effects for growth and carcass traits in cattle using published crossbreeding studies. J Anim Sci. 88:460–466.
- Wolfová J, Wolf J, Kvapilik J, Kica J. 2007. Selection for profit in cattle: II. Economic weights for dairy and beef sires in crossbreeding systems. J Dairy Sci. 90:2456–2467.
- Wood JD, Enser M, Richardson RI, Whittington FM. 2008. Fatty acid in meat and in meat products: fatty acids in foods and their health implications. Boca Raton (FL): CRC Press.