
Abstract
The analysis of the maize plant immediately after harvest is essential in order to check the composition and maturity of the plant to optimise the quality of silage. NIRS calibrations were carried out on chopped maize using three spectrophotometers: a laboratory instrument (FOSS NIRSystems 5000 scanning monochromator, FOSS, Silver Spring, MD) and two versions of new-generation portable instruments (poliSPECNIR, PL1 and PL2). The aim was to verify the quality of the transfer of the calibration curves between FOSS, PL1 and PL2 and between PL1 and PL2, obtained by three methods of spectra processing: pre-processing, piecewise direct standardisation (PDS) and direct standardisation (DS). Seventy-six samples of chopped whole maize plant were scanned with the three instruments and were analysed by wet chemistry for dry matter (DM), ash, crude protein (CP), neutral detergent fibre (NDF), acid detergent fibre (ADF), starch and total sugars, to develop calibration equations. Two more datasets of 15 samples each were used for the standardisation of equations and validation. The calibration transfer obtained, according to the values of R2, standard error of prediction and bias, can be considered satisfactory (0.72 > R2 <0.97) for DM, ash and NDF for both poliSPECNIR, while CP and ADF have shown a good accuracy of prediction (0.78 > R2 <0.82) with PL2. Using FOSS as a master instrument, the choice of method of standardisation varies depending on the slave instrument even though the best results are obtained using PDS with PL2. The most accurate predictions are reached using PDS even when PL1 is the master.
Introduction
Maize silage is probably one of the most popular ingredients used at a world level in cattle feeding (Erdman et al. Citation2011). Its nutrient composition and its particle size distribution (Kononoff et al. Citation2003; Marchesini et al. Citation2011) were shown to greatly affect dairy cow dry matter intake (DMI), DM digestibility, site of starch digestion, milk production and quality (Khan et al. Citation2015). Moreover, its composition could affect animal health, due to the variable risk of ruminal acidosis depending on the amount of NDF and starch and on the site of starch degradation (De Nardi et al Citation2013; Marchesini et al. Citation2013; De Nardi et al. Citation2014). However, the maize silage composition is very variable and is affected by many factors related to its cultivation, including genotype and agronomic conditions (Johnson et al. Citation1999; Khan et al. Citation2015). Moreover, also the maize maturity at harvest, the practices adopted during harvesting and finally the ensiling conditions are determinant in modulating the chemical composition of the maize silage. Among these variables, the maturity at harvest was demonstrated to be the most effective in determining the nutritive value of the maize silage, affecting the content and the digestibility of DM, starch and NDF (Cone et al. Citation2008).
Altogether, it is easy to understand the importance of measuring the maturity and composition of maize plant before the ensiling process. In fact, knowing the maize nutritional value gives a scientific base to decide whether it is better delaying the harvest, mechanically processing the plants or choosing one particular ensiling technique in order to optimise the final product (Johnson et al. Citation1999).
For the past years, the analysis of fodder, including maize silage, was performed routinely by laboratories by the use of near-infrared spectroscopy (NIRS), a predictive technique based on the relationship between absorbance/reflectance properties of a sample and its organic nutrient content (Norris et al. Citation1976). This analysis can be performed in laboratories, mainly on dried and ground feed or, directly on-farm, on untreated feed samples by the use of portable diode array spectrometers (Fernández-Ahumada et al. Citation2008). Recently, the advent of innovative diode array spectrometers, based on an high-quality reflecting holographic grating and InGaAs cooled photodiodes, in which the optical background noise is minimised and the stability of measurement is enhanced, broadens enormously the possibilities of application of NIR spectroscopy at farm level, while also allowing its direct application on to the corn harvesting machines, enabling prompt and fast analysis of the nutritional value of the plant during harvesting. The advent of these instruments, however, requires the creation of new calibration curves involving the use of wet chemical analyses on a large number of samples or, to be more efficient, the transfer of very robust curves formed and used on other instruments through transfer of calibrations (Park et al. Citation1999). Calibration transfer between instruments is needed because usually calibration equations that are suitable for one spectrophotometer are not working properly on spectra acquired by other instruments (Soldado et al. Citation2013).
The aim of the present study was to verify the quality of the undried chopped corn calibration transfer between a FOSS NIRSystems 5000 scanning monochromator (FOSS NIRSystems, Silver Spring, MD) and a poliSPECNIR (ITPhotonics, Breganze, Italy), comparing pre-processing (PRP), piecewise direct standardisation (PDS) and direct standardisation (DS) methods. The same methods were used also to compare undried chopped corn calibration transfer between two different poliSPECNIR diode array spectrophotometers belonging to the first and the last generation of the instrument that present some technical differences.
Materials and methods
Spectrophotometers and chemometric tools
A FOSS NIRSystems 5000 scanning monochromator (FOSS NIRSystems, Silver Spring, MD) with a scanning range of 1100–2500nm at 2nm intervals and two poliSPECNIR diode array spectrometers with spectral range from 902 to 1680nm, at 2nm intervals (ITPhotonics, Breganze, Italy), were used. Using the NIRSystems 5000 equipped with transport module, scans were performed with the Natural Product Cup, a rectangular cell with quartz window that allows the irradiation of about a 94cm2 area. Spectra were collected as the average of 32 scans after 16 reference scans and were calculated as the average of three replicates. Spectral data were recorded as log(1/R) using WinISI 2 software V1.05 (Infrasoft International Inc., Port Matilda, PA), where R is the reflectance of the sample. As regards poliSPECNIR, samples were scanned without any sample cells, distributing the material on an aluminium pan (32 × 24cm) and maintaining a thickness of at least 5cm. Spectra were collected as log(1/R) using poliDATA (ITPhotonics, Breganze, Italy). Spectra were recorded as average of 10 second scans, with approximately 9.0msec of integration time per single scan.
Instruments are identified as follows: FOSS NIRSystems 5000 = FOSS; first-generation poliSPECNIR = PL1; and second-generation poliSPECNIR = PL2. Data collected with each instrument were processed by using MATLAB software v 7.7.0.471 (The MathWorks Inc., Natick, MA) and WinISI 2 software because FOSS calibrations (1100–2500nm) were developed using WinISI 2.
Samples and reference data
Samples (n = 106) of chopped whole maize plant were collected from different farms throughout northern Italy during the summer season of 2015. Samples were selected on the basis of their different cultivars, maturity at harvest and wide range of dry matter (DM), to be representative of the variability in maize production. All the samples (about 1 kg each), immediately after collection, were stored at −20 °C until analysis. After thawing, samples were homogenised and scanned at room temperature using FOSS, PL1 and PL2 for comparative purposes. A subsample of each sample was used for wet chemical analyses to obtain reference values. After being oven-dried at 60 °C for 24h and ground to pass a 0.5 mm screen, each subsample was analysed in duplicate for dry matter (DM), ash, crude protein (CP), neutral detergent fibre (NDF), acid detergent fibre (ADF), starch (ST) and total sugars (TS), calculated as the sum of glucose, fructose and sucrose.
The analyses (Table ) were performed according to the following methods: DM (#934.01; AOAC Citation2003), ash (#942.05; AOAC Citation2003), CP (2001.11; AOAC Citation2005), EE (2003.05; AOAC Citation2006), aNDF (ANKOM Technology Citation2015a), ADF (ANKOM Technology Citation2015b), ST (#996.11; AOAC Citation2000) and TS (Charles Citation1981).
Table 1. Mean values, standard deviation (SD), maximal (Max) and minimal (Min) values of DM (%WW) and nutrients (%DM) in chopped undried maize whole plant calibration (S1), validation (S2) and standardisation (S3) sets.
According to the ‘multivariate leverage’ selection algorithm method proposed in MATLAB (Andrew and Fearn Citation2004) and applied to FOSS spectra dataset, the 106 samples were splitted into three subsets: calibration set (S1, 76 samples), standardisation set (S2, 15 samples) and validation set (S3, 15 samples).
Data analysis
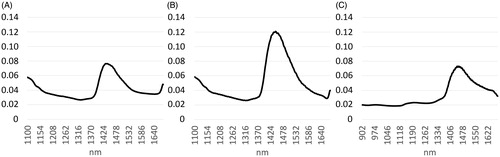
For comparison purposes (Figure ), spectra from FOSS were previously trimmed to 1100–1650nm, a spectral range suitable also for poliSPECNIR, and poliSPECNIR spectra were truncated at 1100–1650nm (at 1650–1680nm, the signal-to-noise ratio for poliSPECNIR worsens). In order to compare the spectra obtained with the three spectrophotometers, root-mean-square (RMS) differences between each spectrum from each instrument were calculated, as reported in Figure .
Figure 1. Mean of trimmed raw spectra (FOSS, PL1and PL2) and of trimmed pre-processed spectra (FOSS_PRP, PL1_PRP, PL2_PRP) for undried maize whole plant (S1, S2 and S3) using FOSS, PL1 and PL2 spectrophotometers, respectively.
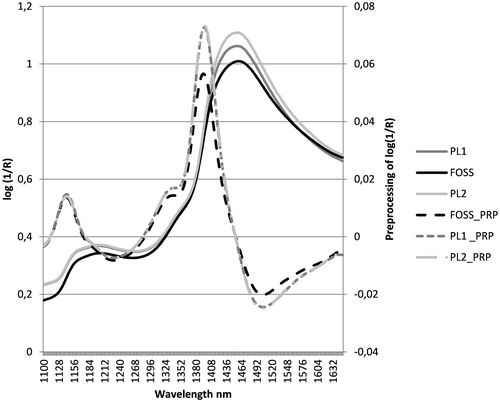
Figure 2. Root-mean-squares (RMSs) calculated at each wavelength between raw spectra of different spectrophotometers collected from all the samples (S1, S2 and S3): A = FOSS vs. PL1, B = FOSS vs. PL2 and C = PL1 vs. PL2.
Spectra for all sets and all instruments were then pre-processed (PRP) to decrease spectral interference due to various effects like particle size and homogeneity (Baker and Barnes Citation1990).
For FOSS, as routine of the laboratory, a MPLS calibration was performed on S1 dataset for DM, ASH, CP, NDF, ADF, ST and TS, using WinISI on full length spectral range (1100–2500 nm), after the following spectra pre-treatment: smoothing gap 4, first derivate gap 4, standard normal variate and detrend.
Moreover, PLS calibrations on S1 dataset were performed using MATLAB on pre-treated spectra and on a reduced spectral range (1100–1650 nm) for each instrument (Table ), to evaluate the quality of the calibration transfer.
Table 2. Number of terms and statistics of cross-validation (CV, S1, n = 76) and validation (VAL, S3 non-standardised, n = 15) for chemical composition of chopped undried maize whole plant using three NIR spectrophotometers at full or trimmed wave length range: FOSS, PL1 and PL2.
The PRP was performed through standard normal variate (SNV), first derivative calculated using a Savitzky–Golay filter with a first-order polynomial and a 15-point window smoothing (order: 1, windows: 15pt) and finally a linear detrend, in line with what reported by Soldado et al. (Citation2013).
The cross-validation was performed by randomly splitting the dataset into 20 groups and was used to optimise PLS equations, selecting the number of latent variables that leads to the lower standard validation error (SECV), which is considered to be the most appropriate statistical parameter to estimate the robustness of the calibration. In WinISI, each variable is associated with the best number of terms (Table ), whereas in MATLAB, it is selected the best number of terms suitable for all the variables.
The S2 dataset (n = 15) was used to clone the spectrophotometers. Other 15 samples of undried maize whole plant (validation set, S3) were scanned and used to verify the accuracy of the clones (Park et al. Citation1999).
Spectra of S2 acquired by FOSS were considered as master set, while those of PL1 and PL2 were regarded as slave sets. In order to make slave spectra similar to the master spectra, three standardisations were tested by using MATLAB software, according to three different approaches: PRP, PDS and DS. The calibration equations derived from the FOSS calibration obtained from S1 dataset (master equations) were applied to the standardised validation set spectra (S3) of PL1 and PL2 according to PRP, PDS and DS. The evaluation on what is the better standardisation method to transfer calibration curves was based on the coefficient of determination (R2), the standard error of prediction (SEP) and bias, as reported by Park et al. (Citation1999). The PDS, DS and PRP standardisation methods were tested also, in the calibration transfer procedures using PL1 as master and PL2 as slave spectrophotometers. For each variable, bias was calculated from the validation set (S3).
Results and discussion
Chemical composition of chopped undried maize samples (S1, S2 and S3) is reported in Table . The high variability of different nutrients, highlighted by the high values of standard deviation and range, confirms the representativeness of the selected samples for the purpose of calibration, standardisation and validation. As expected, variables that show greatest variability are total sugars and starch, whose concentration in chopped whole maize plant affects the silage energy content.
In cross-validation (S1), the reduction of wavelength range (Figure and Table ), as regards the master instrument (FOSS), has led to a decrease in the coefficients of determination and to an increase in SECV for all parameters analysed. The reduction of the coefficients of determination is mild or moderate as regards DM, NDF and ADF, while it is equal to or greater than 50% for CP, ST and TS. Starch and sugars, as for trimmed spectra of FOSS (1100–1650 nm), show higher SECV and lower coefficients of determination in cross-validation for both poliSPECNIR spectrophotometers. As for the other nutrients, PL2 shows values of SECV and R2 similar to, or in the case of ash and CP, even better than those of FOSS trimmed spectra. As regards PL1, it shows a lower R2 for all parameters with the exception of CP (Table ). In validation (Table ), PL2 shows values of R2 and SEP better than those obtained from FOSS trimmed spectra and similar to those obtained with whole FOSS spectra for DM, ash, NDF and ADF. For CP, starch and TS PL2 show lower R2 and higher SEP values instead. The PL1 shows the lowest R2 for all parameters with the exception of TS.
Looking at the spectra in Figure , differences can be seen between FOSS and the other instruments in the absorption bands present at frequencies below 1320 and from 1400 to 1530 nm which correspond, approximately, to one of the water bands (1450 nm) as reported by Wang et al. (Citation2009). The latter difference seems accentuated after pre-treatment of the spectra. The presence of differences between the spectra belonging to FOSS, PL1 and PL2 is shown in Figure in which the RMS is calculated at each wavelength between instruments arranged in pairs.
Table shows that the optimal standardisation method to get the best predictions using the calibration equations of FOSS on S3 varies depending on the spectrophotometer used (PL1 or PL2) to acquire the spectra. Such discrepancy is explained by some differences in construction between PL1 (old-generation) and PL2 (new-generation) poliSPECNIR instruments: PL2 has a different pre-amplifier which increases the linearity of response to the signal.
Table 3. Effect of the standardisation method (PRP vs. PDS vs. DS) on the coefficient of determination (R2), standard error of prediction (SEP) and bias of calibrations for chemical composition of undried maize whole plant (S3, standardised, n = 15) using three spectrophotometers (FOSS, PL1 and PL2).
This has influenced the acquisition of spectra and leads to different requirements for optimising standardisation protocol between instruments. The accuracy of a prediction is determined on the basis of the SEP, R2 and bias values. As regards the PL1 spectra, the highest R2 and the lowest SEP for ash (0.72, 0.29), CP (0.59, 0.32), NDF (0.73, 2.32) and ADF (0.39, 1.47) were obtained using DS, with the exception of DM (0.77,1.85) and TS (0.75, 4.56) whose R2 values were slightly better using PRP. As regards TS, PRP, compared to DS, while having a greater R2, also leads to higher bias and SEP. Concerning spectra of PL2, the differences between the standardisation methods were found to be less noticeable, with almost equivalent values between PDS and DS for ash and CP. The R2 for DM (0.91) and NDF (0.97) instead was higher for PRP, but has been better predicted with the PDS, because the bias and SEP for these parameters (1.87 for DM and 1.39 for NDF) are much lower. The ADF is better predicted by PDS (Table ).
The R2 of starch (R2 <0.2) was very low for all standardisation methods and for the spectra of both poliSPECNIR instruments. The prediction of total sugars has an R2>0.70 only for PL1 spectra, while in contrast the predictions of CP, NDF and ADF have been better for the spectra of PL2. Looking at the predictions of the two instruments, poliSPECNIR after standardisation of the spectra (Table ) can be noted a difference between the two instruments: PL2 normally shows higher R2 and lower SEP compared to PL1 confirming an improvement in the performance of new-generation spectrophotometers. This difference is evident especially for CP and ADF, with one exception for total sugars that are predicted better by PL1. These differences are due to the presence of some differences in the spectral calibration of array diodes and in the constructive differences between instruments (Nicolai et al. Citation2007).
To investigate the possibility of using a poliSPECNIR as master instrument, the three standardisation methods were assessed (S3) to understand what was the most accurate to transfer the calibration equations of PL1 on PL2 spectra (Table ). The PRP and PDS are more accurate than DS and are equivalent to each other. PRP showed higher R2, lower SEP and higher bias for DM and NDF, while PDS was better for ash, CP, ADF and TS.
The predictions of ST and TS are not accurate, likely because their typical absorption bands (834–1161) are at the lower limit of the spectral range used (1100–1650 nm), where the signal-to-noise ratio is lower (Katayama et al. Citation1996). However, it cannot be excluded that the use of a bigger dataset may improve these values. The poor prediction of starch has, however, limited importance because starch is quite inert during ensiling process (Khan et al. Citation2015). The analysis of maize plant in the field, in order to plan the best harvest time and the best ensiling technique, is satisfactory to know the value of DM and NDF (0.73 > R2 <0.97) which increase and decrease, respectively, along with the advancing maturity of the crop (Cammell et al. Citation2000; Phipps et al. Citation2000): variables that are well predicted by the instruments here considered.
The difference in the predictions between FOSS and poliSPECNIR is due to the great diversity of the instruments that have different spectral range and scan mode and is especially amplified using PL1, the old-generation poliSPECNIR. Such differences are accentuated by heterogeneity, high moisture of the matrix and its variability in particle size, because each subsample scanned by the two instruments is different and causes a shift of the spectra (Park et al. Citation1999).
Comparing the SEP and R2 of non-standardised spectra in validation (Table ) with those of the standardised spectra (Table ), it is evident that for PL2, standardisation improves the prediction for CP, starch and TS (although these values remain still low), while prediction remains similar for the other parameters. PL1 standardisation (DS) improves the prediction of all parameters with the only exception of starch. In some cases (e.g. DM and NDF), validation statistics are better in PL2 than in the master instrument (Table ). This is probably due to the random error on the slave instrument (Roggo et al. Citation2007). Overall, the calibration transfer between FOSS and poliSPECNIR is satisfactory even though the transfer to PL2 is better than that to PL1, showing to be accurate for all parameters (R2 has a range between 0.78 and 0.97), except for starch and total sugars.
Despite the calibration transfer for undried whole maize plant from FOSS to the new-generation poliSPECNIR was satisfactory, complying the aim of the study, calibration for chemical composition of whole maize plant can be further improved by increasing the number of samples used in the calibration set.
Conclusions
Taking into account the great diversity among the instruments and the strong inhomogeneity of chopped maize plant, the calibration transfer obtained can be considered satisfactory for the majority of parameters, with the exception of starch and total sugars. Among poliSPECNIR spectrophotometers, the latest version (PL2) shows more accurate predictions than the first generation (PL1) that obtained acceptable predictions only for DM and NDF. Using FOSS as a master instrument, the choice of method of standardisation varies depending on the slave instrument, although the highest coefficients of determinations and the lowest SEP are obtained using PDS with PL2. The most accurate predictions are reached using PDS even when PL1 is the master. It can be concluded that the transfer of calibration curves achieved is good enough to obtain accurate predictions about the composition of the chopped maize plant, using in the field the latest version of the portable NIR instruments tested.
Disclosure statement
The authors report that they have no conflicts of interest.
Additional information
Funding
References
- Andrew A, Fearn T. 2004. Transfer by orthogonal projection: making near-infrared calibrations robust to between-instrument variation. Chemometr Intell Lab Syst. 72:51–56.
- ANKOM Technology. 2015a. Method 12, 4/10/15: Acid Detergent Fiber in Feeds - Filter Bag Technique (for A2000 and A2000I). Macedon (NY): ANKOM Technology; [accessed 2016 Mar 20]. https://www.ankom.com/sites/default/files/document-files/Method_12_ADF_A2000.pdf
- ANKOM Technology. 2015b. Method 13, 4/10/15: Neutral Detergent Fiber in Feeds - Filter Bag Technique (for A2000 and A2000I). Macedon (NY): ANKOM Technology; [accessed 2016 Mar 20]. https://www.ankom.com/sites/default/files/document-files/Method_13_NDF_A2000.pdf
- AOAC, 2000. Official methods of analysis. 17th ed. Gaithersburg (MD): Association of Official Analytical Chemists.
- AOAC, 2003. Official methods of analysis. 17th ed., 2nd revision. Gaithersburg (MD): Association of Official Analytical Chemists.
- AOAC, 2005. Official methods of analysis. 18th ed. Gaithersburg (MD): Association of Official Analytical Chemists.
- AOAC, 2006. Official method of analysis. 18th ed. Gaithersburg (MD): AOAC International.
- Baker CW, Barnes R. 1990. The application of near infra-red spectroscopy to forage evaluation in the Agricultural Development and Advisory Service. In: Wiseman J, Cole DJA, editors. Feedstuff evaluation. London: Butterworths; p. 337–354.
- Charles DF. 1981. Analysis of sugars and organic acids: cane sugar refinery experience with liquid chromatography a sulphonic acid cation-exchange resin. Int Sugar J. 83:169–172.
- Cammell SB, Sutton JD, Beever DE, Humphries DJ, Phipps RH. 2000. The effect of crop maturity on the nutritional value of maize silage for lactating dairy cows. 1. Energy and nitrogen utilization. Anim Sci. 71:381–390.
- Cone JW, Van Gelder AH, Van Schooten HA, Groten JAM. 2008. Effects of forage maize type and maturity stage on in vitro rumen fermentation characteristics. Neth J Agric Sci. 55:139–154.
- De Nardi R, Marchesini G, Plaizier JC, Li S, Khafipour E, Ricci R, Andrighetto I, Segato S. 2014. Use of dicarboxylic acids and polyphenols to attenuate reticular pH drop and acute phase response in dairy heifers fed a high grain diet. BMC Vet Res. 10:277
- De Nardi R, Marchesini G, Stefani A-L, Barberio A, Andrighetto I, Segato S. 2013. Effect of feeding fine maize particles on the reticular pH, milk yield and composition of dairy cows. J Anim Physiol Anim Nutr (Berl). 98:504–510.
- Erdman RA, Piperova LS, Kohn RA. 2011. Corn silage versus corn silage:alfalfa hay mixtures for dairy cows: effects of dietary potassium, calcium, and cation-anion difference. J Dairy Sci. 94:5105–5110.
- Fernández-Ahumada E, Garrido-Varo A, Guerrero-Ginel JE. 2008. Feasibility of diode-array instruments to carry near-infrared spectroscopy from laboratory to feed process control. J Agric Food Chem. 56:3185–3192.
- Johnson L, Harrison JH, Hunt C, Shinners K, Doggett CG, Sapienza D. 1999. Nutritive value of corn silage as affected by maturity and mechanical processing: a contemporary review. J Dairy Sci. 82:2813–2825.
- Katayama K, Komaki K, Tamiya S. 1996. Prediction of starch, moisture, and sugar in sweetpotato by near infrared transmittance. Hortscience. 31:1003–1006.
- Khan NA, Yu P, Ali M, Cone JW, Hendriks WH. 2015. Nutritive value of maize silage in relation to dairy cow performance and milk quality. J Sci Food Agric. 95:238–252.
- Kononoff PJ, Heinrichs AJ, Lehman HA. 2003. The effect of corn silage particle size on eating behavior, chewing activities, and rumen fermentation in lactating dairy cows. J Dairy Sci. 86:3343–3353.
- Marchesini G, De Nardi R, Gianesella M, Stefani A-L, Morgante M, Barberio A, Andrighetto I, Segato S. 2013. Effect of induced ruminal acidosis on blood variables in heifers. BMC Vet Res. 9:98.
- Marchesini G, Segato S, Berzaghi P, Andrighetto I. 2011. Effect of non-forage roughage replacement on feeding behaviour and milk production in dairy cows. Ital J Anim Sci. 10:e44, 171–175.
- Nicolai BM, Beullens K, Bobelyn E, Peirs A, Saeys W, Theron KI, Lammertyn J. 2007. Nondestructive measurement of fruit and vegetable quality by means of NIR spectroscopy: a review. Postharvest Biol Technol. 46:99–118.
- Norris KH, Barnes RF, Moore JE, Shenk JS. 1976. Predicting forage quality by infrared reflectance spectroscopy. J Anim Sci. 43:889.
- Park RS, Agnew RE, Gordon FJ, Barnes RJ. 1999. The development and transfer of undried grass silage calibrations between near infrared reflectance spectroscopy instruments. Anim Feed Sci Technol. 78:325–340.
- Phipps RH, Sutton JD, Beever DE, Jones AK. 2000. The effect of crop maturity on the nutritional value of maize silage for lactating dairy cows. 3. Food intake and milk production. Anim Sci. 71:401–409.
- Roggo Y, Chalus P, Maurer L, Lema-Martinez C, Edmond A, Jent N. 2007. A review of near infrared spectroscopy and chemometrics in pharmaceutical technologies. J Pharm Biomed Anal. 44:683–700.
- Soldado A, Fearn T, Martínez-Fernández A, delaRoza-Delgado B. 2013. The transfer of NIR calibrations for undried grass silage from the laboratory to on-site instruments: comparison of two approaches. Talanta. 105:8–14.
- Wang J, Xu R, Yang S. 2009. Estimation of plant water content by spectral absorption features centered at 1,450 nm and 1,940 nm regions. Environ Monit Assess. 157:459–469.