
Abstract
The consequences of a cattle crossbreeding programme on the genes expression, signalling and metabolic pathways, molecular networks, and biological functions is still indistinctive. In this study differences of five cattle populations in a crossbreeding programme were studied using high throughput sequencing technology to characterise their transcriptome. Holstein (Bos Taurus origin) and Taleshi (Bos indicus origin) as purebred cattle were compared with their crossbreds including 50% sire Taleshi and dam Holstein (50CSN), 50% sire Holstein and dam Taleshi (50CSH) and 75% Holstein (75C). Differentially expressed genes (DEGs) and their related enriched metabolic pathways, transcription up-stream regulators and biological functions were studied by bioinformatics tools of transcriptome analysis. Total expressed transcripts in all populations were 72,812 with 22,627 annotated genes. We found 2262 DEGs in which 251 genes were uniquely expressed in purebreds or crossbreds. Functional analysis of DEGs showed that the immune and inflammatory responses were the most highly-impacted pathways and functions. Among all significantly enriched pathways, eukaryotic translation initiation factor-2 signalling had the highest activation Z-score (5.3) in crossbred compared to purebred cattle. The majority of up-stream regulators of genes including transcription regulators and cytokines were differentially expressed among populations in which their activation Z-score in purebred was more than crossbred cattle. Crossing of Holstein with Taleshi breed resulted lower activity of pathways related to immunity and inflammatory responses. The analysis revealed that the most important differences between studied genotypes, especially between purebred and crossbred cattle, were related to immune function.
Introduction
The indigenous cattle breeds play an important economic role in the rural areas, but, the milk production of them is low compared to Bos taurus breeds. Usually crossbreeding as an alternative technology for improving the performance characteristics is suggested especially in harsh tropical conditions (Menéndez-Buxadera et al. Citation2016). The overall goal of crossbreeding is to harness the positive traits of the two breeds to achieve high production without compromising the resistance to harsh environment. A more efficient way to perform crossbreeding to improve production performance without compromising disease resistance traits is using biological markers (a.k.a., biomarkers) (McDougall et al. Citation2009).
Based on identity (i.e. B. Taurus or Bos indicus origin) and relatedness (i.e. the relationships between breeds), there are large genetic variations between cattle breeds (Bovine HapMap Consortium Citation2009). Despite the existence of several studies on cattle transcriptome (Salleh et al. Citation2017; Wang et al. Citation2017), information about genes expression differences between breeds is scant (Huang et al. Citation2012). Bongiorni et al. (Citation2016a, Citation2016b) investigated the application of RNA sequencing in the two Italian breeds (Maremmana and Chianina) with different history of selection/divergence to analyse the genetic contribution of each breed to meat production and quality. Because of the importance of gene expression in shaping the phenotypes, understanding the transcriptomic differences between breeds is important to unravel the biological difference through analysis of pathways and functions responsible for the differences in production, tolerance and resistance.
Analysis of whole transcriptome is attainable by RNA-Sequencing (RNA-Seq) technology. RNA-Seq is a powerful tool for quantifying gene expression as well as identifying novel transcripts, alternative splicing, and RNA sequence variations (Wang et al. Citation2009). The first investigation about using RNA-Seq technology in cattle was done by Huang and Khatib (Citation2010) with the aim of transcriptome sequencing of bovine embryos. In this study, oocytes were collected from cow ovaries and allowed to mature before they were fertilised with bull semen. Embryos transcriptome in different stages of differentiation were compared to evaluate differential gene expression and alternative splicing. Also Huang et al. (Citation2012) compared peripheral blood transcriptome of three (Holstein, Jersey, and Cholistani) cattle breeds. Holstein and Jersey are B. taurus origins and Cholistani is B. indicus (belongs to harsh environments of Pakistan). They found differences in coding regions of genes that explained the genomics differences of these breeds. Out of 7793425 sequenced nucleotides of genes coding regions only 165 differences observed between Holstein and Jersey and 3383 in Holstein and Cholistani breeds. Of 3383 different nucleotides, 817 resulted in amino acid changes in 627 genes protein. While high similarity was found for Holstein and Jersey breeds transcriptomes, but these two breeds displayed so many differences in their transcriptome compared to Cholistani breed.
Analysis of differentially expressed transcripts between breeds and crossbreeds can help to understand the effects of crossbreeding on phenotypes and genetic differences and, ultimately, can allow identifying biomarkers for crossbreeding programmes. The objective of this study was to uncover the biological differences of purebreds and crossbreds cattle related to a crossbreeding programme by comparative RNA-Seq analysis of whole transcriptome of blood. This crossbreeding programme is running in north of Iran, Guilan province. The understanding of differences in biological pathways and functions may help to design crossbreeding programmes with higher precision.
Materials and methods
Experimental animals
Tail vein peripheral blood samples were collected using heparinised venoject tubes (GD0100SH, Zhejiang Gongdong Medical Technology, China) from 56 animal: 14 purebred Taleshi cattle (N), 8 crossbred cattle with 50% sire Taleshi and dam Holstein (50CSH), 10 crossbred cattle with 50% sire Holstein and dam Taleshi (50CSN), 12 crossbred cattle with 75% Holstein (75C), and 12 purebred Holstein cattle (H). All experimental animals, belong to a national crossbreeding programme, were reared in the same location (Foman city, Guilan province, Iran), farm, food and management conditions. All samples were collected in the same season from female cows in their second or third parturition after morning milking.
Total RNA extraction
The time interval between samples collection and RNA extraction was less than one hour and samples were kept on ice till starting the extraction process. At least 4 mL blood was used for RNA extraction from each sample. First, buffy coat of blood samples was isolated after centrifugation at 2000g for 10 min at 4 °C. White blood cells (WBC) were washed with red blood cell (RBC) lysis buffer (1×) twice and centrifuged at 2000g for 10 min at 4 °C to obtain white pellet of WBC. Total RNA was extracted using Trizol reagent (Invitrogen, CA, USA) from WBC according to previously described protocol (Jiang et al. Citation2013). The purity of the samples was tested by NanoDrop™ device (Thermo Scientific, USA).
Prior RNA-Seq, based on previous reports (Mortazavi et al. Citation2008; Huang and Khatib Citation2010; Salem et al. Citation2012; Huang et al. Citation2012), samples were pooled for each breed. To obtain at least 20 µg of each pooled sample the same amount of total RNA (3 µg/sample) from all samples of each population (i.e. 14 N, 8 50CSH, 10 50CSN, 12 75 C, and 12 H) was used for pooling. Pooling which can be used to decrease the number of samples may also increase the power to detect differentially expressed genes (DEGs) due to the biological averaging and pooling bias, that is the difference between the value measured in the pool and the mean of the values measured in the corresponding individual replicates (Kendziorski et al. Citation2005; Rajkumar et al. Citation2015). However, there are some limitations; for instance, the biological variability among the samples of the same population cannot be used to assess statistical differences. Prior RNA-Seq, RNA integrity of pooled samples was assessed by using Agilent 2100 Bioanalyzer (Agilent RNA 6000 Nano Kit). The RNA integrity number for the pooled samples was between 8.0 and 8.6.
Library construction and sequencing
Total RNA was digested by DNaseІ (NEB) and purified by oligo-dT beads (Dyna beads mRNA purification kit, Invitrogen, USA), then purified mRNA was fragmented into 130 base pair with heat in first strand buffer. First-strand cDNA was synthesised using N6 primer, first strand master mix, and super script II reverse transcription (Invitrogen, USA). Reaction conditions were 25 °C for 10 min, 42 °C for 40 min, and 70 °C for 15 min. The second strand master mix was added to synthesise the second-strand cDNA (16 °C for 1 h). The cDNA was Purified using Agencourt® AMPure® XP PCR purification kit (Agencourt, USA).
The final library was quantitated in two ways for validation: the average of molecule length was determined using the Agilent 2100 Bioanalyzer instrument (Agilent DNA 1000 Reagents), and quantification of the library was performed by real-time quantitative PCR (RT-qPCR) using TaqMan probes. The qualified libraries were amplified on cBot to generate the cluster on the flow cell (TruSeq PE cluster kit V3–cBot–HS, Illumina). The amplified flow cell was sequenced, pair ended, on the HiSeq 2000 device (TruSeq SBS KIT-HS V3, Illumina) with read length of 100 base pair (BGI-Shenzhen, China).
Mapping reads to the reference genome, assembly of transcripts, estimation of abundance, and identification of differentially expressed genes (DEGs)
Tophat2 with Bowtie2 (version 2.0.4) was applied to align mRNA sequence reads to the reference genome (bosTau4), segment mapping algorithm to discovering splice junctions, and indel search to discover insertions and deletions (Huang and Khatib Citation2010; Huang et al. Citation2012; Kim et al. Citation2013). The accepted hits outputs of Tophat2 were applied to Cufflinks to assemble transcripts and then estimation of their abundances (Trapnell et al. Citation2010; Huang et al. Citation2012). Cufflinks estimates genes expression (fragments per kilo base exon per million mapped fragments, or FPKM). We defined 0.1 as a minimum for cut-off of abundance. Cuffmerge as part of Cufflinks, merges all Cufflinks assemblies together, so we used one single assembled output with all transcripts (Trapnell et al. Citation2010). To obtain DEGs between purebred and crossbred populations, we used JMP® Genomics software (SAS Institute, USA). The ANOVA model for JMP® Genomics software included type of breed (i.e. purebred or crossbred) as main effect and replicate of breed type (n = 2 for purebred and n = 3 for crossbreds) as random effect. FDR-based procedure was applied for multiple comparisons. Furthermore, we used JMP® Genomics software (SAS Institute, USA) to draw heat map and dendrogram correlation graphs for expressed transcripts of studied populations.
Pathway, function, chromosome, and up-stream regulators analysis
IPA (Ingenuity Pathway Analysis; Ingenuity System Inc., USA) software were employed to perform functional analysis of DEGs (FDR <0.05). The whole dataset with gene ID, p-values, expression ratios, and FDR were uploaded into IPA. The up-stream regulators analysis from IPA produces a Z-score, which is an estimate of the status of the up-stream regulator using the level of gene expression of known target genes. Z‐scores greater than 2 or smaller than −2 are considered biologically significant.
Results
RNA sequencing and assemble transcripts
The summary of reads mapping (read mapping rate, discordant and concordant alignments, and number of insertions, deletions and splice junctions) is shown in Table . The highest number of insertions, deletions and splice junctions were in Taleshi population and the highest concordant alignments were detected in Holstein. The lowest concordance was observed in 50CSH population (Table ). Total expressed transcripts in all populations were 72,812 with 22,627 annotated genes. Out of these genes, 335, 172, 189, 188 and 148 genes were breed-specific in Taleshi, Holstein, 75C, 50CSN, and 50CSH populations, respectively (Figure ). The highest correlations were obtained between 50CSN and 50CSH populations and also Taleshi and Holstein populations (Figure ). The dendrogram of genes expression pattern revealed two different branches among five studied populations, one for purebred populations and the other for three crossbred populations (75C population showed separate branch among crossbred populations) (Figure ). This clustering tree showed general difference of purebred and crossbred cattle and a convincing reason to compare these two populations by analysis of differentially expressed transcripts. We performed differential expression testing and DEGs functional analysis for highly correlated populations (i.e. 50CSH vs. 50CSN and N vs. H). Because of low number of DEGs, no affected pathway, function and up-stream regulator was observed.
Figure 1. Venn diagram of the number of unique and common expressed genes among the five studied populations. 75C: 75% Holstein crossbred; 50CSN: 50% crossbred sire Taleshi and dam Holstein; 50CSH: 50% crossbred sire Holstein and dam Taleshi.
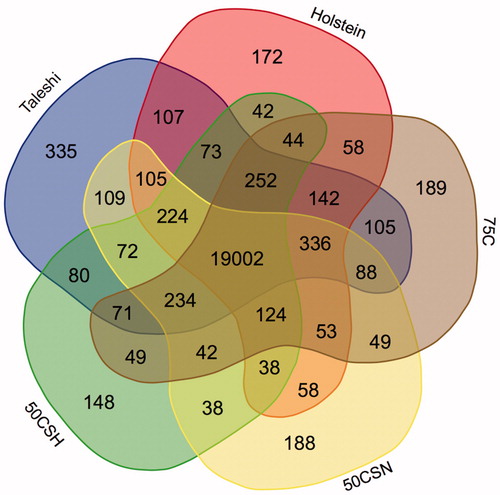
Figure 2. Heat map of correlation and dendrogram of measured transcripts among the five studied populations. 75C: 75% Holstein crossbred; 50CSN: 50% crossbred sire Taleshi and dam Holstein; 50CSH: 50% crossbred sire Holstein and dam Taleshi; H:Holstein; N: Taleshi (native).
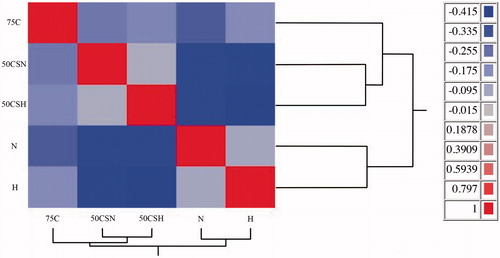
Table 1. Summary of sequencing and mapped reads for each population (H = Holstein, N = Taleshi (native), 75C = 75% Holstein crossbred, 50CSN =50% crossbred sire Taleshi and dam Holstein, and 50CSH =50% crossbred sire Holstein and dam Taleshi).
The top 10 more highly expressed annotated transcripts in each population are reported in Supplementary Appendix 1. Three of these genes are coding for ribosomal subunits. ATP6 (Adenosine triphosphate synthase 6), RPLP1 (ribosomal protein, large, P1) and B2M (beta-2-microglobulin) were the top expressed genes in all populations. ATP6 is a subunit of ATP synthase in mitochondria that is responsible for final step of oxidative phosphorylation (Chen et al. Citation2007). RPLP1 gene encodes a ribosomal phosphoprotein that is a component of 60S subunit of ribosomes (Martinez-Azorin et al. Citation2008). B2M gene encodes beta-2-microglobuline protein, a component of MHC class I molecules (Ardeniz et al. Citation2015). Among the highly expressed transcripts there was also micro RNA miR-126 that is a specific and highly expressed microRNA in vessel endothelial cells and has key roles in controlling arteriogenesis and angiogenesis (Van Solingen et al. Citation2009).
Differential expression genes
All the expression ratio, p-value and q-value of expressed transcripts analysed using JMP Genomics software are available in GEO datasets with GSE79677 accession number. A total of 1318 unique genes were only expressed in one of the crossbred or purebred populations, 703 genes only expressed in crossbred and 615 genes in purebred populations. The statistical analysis of purebreds vs. crossbreds using JMP Genomics identified 2262 DEGs.
Differences of pathways, up-stream regulators, and functions and diseases between crossbred and purebred populations
Figure represents 50 enriched pathways of differentially expressed genes between crossbred and purebred populations. IPA software displayed only two highly enriched pathways with a –log p > 2 for crossbred vs. purebred comparison (Figure ). The most enriched pathway in crossbred vs. purebred comparison was the eukaryotic translation initiation factor-2 (EIF2) signalling (−log p > 17 and Z-score = 5.33). Figure shows 96 highly effected up-stream regulators with an absolute Z-score ≥2 for crossbred vs. purebred group. Analysis revealed 11 categories for up-stream regulators and most of these were classified in transcription regulators (28%) and cytokines (19%), which the majority of these regulators showed lower activity in crossbreds compare to purebreds (Figure ). Only 14 of 96 up-stream regulators were showed higher activity in crossbreds compare to purebreds. Of these, three up-stream regulators (miR-155, miR-141-3p, and miR-122-5p) with higher activity in crossbreds compare to purebreds were classified in microRNAs category which is 75% (3 of 4) of all effected microRNAs. Most activated and inhibited up-stream regulator in crossbreds compare to purebreds was classified in transcription regulators category and belongs to MYC (activation Z-score = 4.3) and SMARCA4 (activation Z-score = −4.2), respectively.
Figure 3. Top 50 enriched pathways of differentially expressed genes between crossbred and purebred cattle. Enrichment of pathways among differentially expressed genes (DEG) between crossbreds and purebreds uncovered by Ingenuity Pathway Analysis. They are the –log10 p-value of enrichment (p = .01 and –log10 p = 2) denoted by the horizontal red bar and the ratio between the number of DEG/number of genes in pathway denoted by the horizontal dot plot.
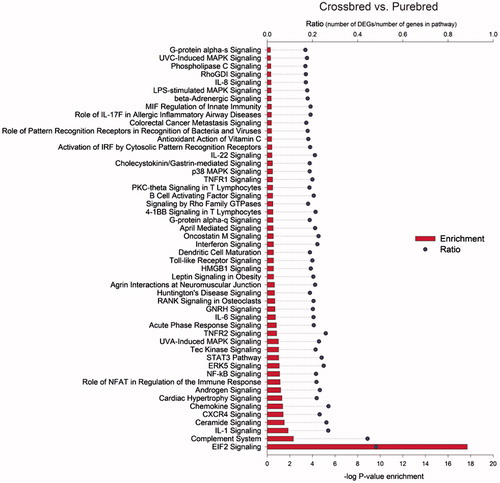
Figure 4. Highly affected transcription up-stream regulators in crossbred vs. purebred comparison. The analysis provides the more plausible prediction of the status of the up-stream regulators (i.e. activated or inhibited) by computing a Z-score. The up-stream regulators are grouped by functional categories with an absolute activation Z-score ≥2. Positive Z-score denotes up-stream regulators that are more activated in crossbreds vs. purebreds while negative Z-score denotes up-stream regulators that are more activated in purebreds vs. crossbreds. Positive expression ratio indicated that up-stream regulators were more activated in crossbreds vs. purebreds while negative expression ratio indicated that up-stream regulators were more activated in purebreds vs. crossbreds.
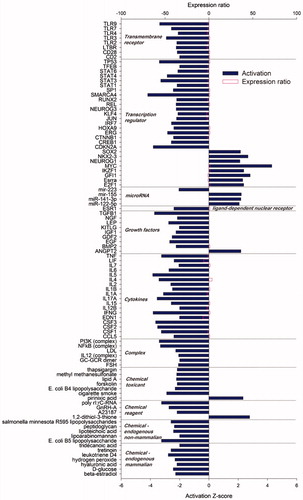
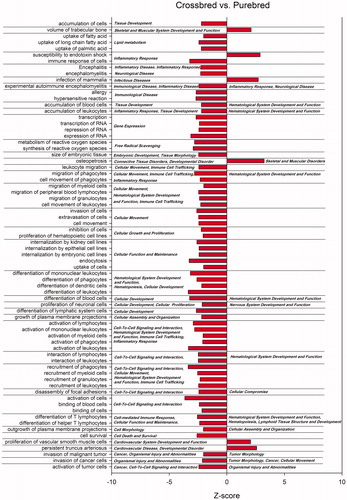
Figure displayed enriched biological functions and diseases of differentially expressed genes among crossbreds and purebreds. Analysis revealed 72 diseases and bio functions had Z-score absolute value ≥2 for crossbred vs. purebred group comparison. Most of the diseases and functions had a lower activation in crossbreds compared to purebreds (66 of 72 or almost 92%) which the majority of them were classified in immune and inflammatory functions and diseases. Few functions had a higher activation Z-score in crossbreds compared to purebreds comparison. These functions were related to cell death of immune cells, morbidity or mortality, neonatal death, and organismal death. Highest Z-score were related to immunity and inflammatory responses, activation of immune cells (especially leukocytes) and recruitment of phagocytes and differentiation of leukocytes (Figure ). Infection of mammary is an inflammatory reaction of the udder tissue which showed higher activity (Z score = 2.73) in crossbreeds compared to purebreds. This is probably due to lower activity of immune and inflammatory responses in crossbreds.
Figure 5. Most affected biological functions and diseases among differentially expressed genes by crossbreds vs. purebreds comparison. Using Ingenuity Pathway Analysis, functions and diseases with an absolute Z-score ≥2 are reported as significant enriched pathways (p < .05) based on prediction of activation on purebreds (negative Z-score) or crossbreds (positive Z-score). The main category of the each function and disease is reported on the right.
Discussion
In recent years there has been increased attention to crossbreeding in rural areas. For example, Taylor, Jersind, Jerthar, Karan Swiss, Karan Fries, Sunandini, Frieswal, Phule-Triveni and Vrindavani are all new crossbreds of Indian indigenous cattle with Holstein-Friesian and Jersey breeds (Wakchaure et al. Citation2015). There are at least six native cattle populations in Iran including Sarabi, Golpayegani, Sistani, Dashtyari, Najdi and Taleshi belonging to indicine (B. indicus) breeds. Taleshi cattle breed has the largest population in Iran. During the last 15 years, the number of crossbred cattle in Iran has increased rapidly ranging from 2,425,000 in 2002 to 4,373,000 in 2009 (Kamalzadeh et al. Citation2008). Crossbreeding programme for Taleshi and Holstein cattle has been done with the aim of improving milk and meat production. According to the reports of Iranian National Animal Breeding Center and Promotion of Animal Products (INABC-PAP), average milk yield in Holstein, Taleshi and Holstein × Taleshi crossbreds were 28.1, 4.7 and 10.3 kg/day, respectively. Therefore, it is necessary to comprehensive study of Taleshi cattle crossbreeding and its consequences.
Heatmap and dendrogram correlation graph of expressed transcripts of studied populations showed two branches with the highest correlations for 50CSH and 50CSN and also N and H populations. Because of low number of DEGs from differential expression testing for 50CSH vs. 50CSN and N vs. H comparisons no affected functions was observed. In order to understand the effects of crossbreeding we compared transcripts of purebred and crossbred populations. Using comparison group approach in this paper, when different conditions was merged in only one condition (for crossbred three crossbred populations and for purebred two purebred populations were considered as one condition), more DEGs was discovered.
The most enriched pathway in crossbred vs. purebred comparison was EIF2 signalling pathway. The first step in protein synthesis involves the ribosomal selection of mRNAs to be translated and identification of translational start sites using a set of eukaryotic translation initiation factors (EIFs). EIF2 is a guanosine triphosphate (GTP) binding protein that specifies the initiation of protein synthesis in ribosomes. The most important function of EIF2 is the delivery of charged methionyl-tRNA to ribosomes and identification of the translational start site (Kolitz and Lorsch Citation2010). Thus, the EIF2 is critical for translation.
The positive Z-score is indicative of higher activation of translation in the group comparison of crossbreds vs. purebreds. Majority of the up-stream regulators were classified as transcription regulators and cytokines and most of them were more inhibited in crossbred compared to purebreds. Most activated and inhibited up-stream regulator in crossbreds compare to purebreds was MYC and SMARCA4, respectively. Positive and negative regulation of an expansive network of target genes displayed Myc reprogrammes cells to drive proliferation or to induce cell death (Chang et al. Citation2008). SMARCA4 is a member of SWI/SNF family of proteins involved in repair of stress-induced DNA damages and programmed DNA repair events (Kim et al. Citation2012). Inhibition of cytokines is an indicative of lower activity of immune and inflammatory responses in crossbreds compared to purebreds. As shown in Figures the significantly enriched pathways, up-stream regulators and functions related to immunity and immune responses were deemed to have a negative Z-score (i.e. more activated in purebreds). This data is indicative of a higher sensitivity of crossbreds to disease and inflammatory responses in the same condition with purebreds.
Conclusion
In summary, our study indicated that crossbreds of Holstein with Taleshi breed compared to the purebreds had lower induction of immunity and inflammatory responses. To the best of our knowledge, this is the first study where high throughput sequencing technology was used to characterise the functional differences between purebreds and crossbreds resulted from a bovine crossbreeding programme. The analysis allowed identifying disease-associated pathways such as infection of mammalia by comparison of crossbred vs. purebred. These results may help to better understanding of heterosis and bovine crossbreeding programmes.
Disclosure statement
No potential conflict of interest was reported by the authors.
Additional information
Funding
Related Research Data
References
- Ardeniz Ö, Unger S, Onay H, Ammann S, Keck C, Cianga C, Gerçeker B, Martin B, Fuchs I, Salzer U, et al. 2015. β2-Microglobulin deficiency causes a complex immunodeficiency of the innate and adaptive immune system. J Allergy Clin Immunol. 136:392–401.
- Bongiorni S, Gruber CEM, Bueno S, Chillemi G, Ferrè F, Failla S, Moioli B, Valentini A. 2016a. Transcriptomic investigation of meat tenderness in two Italian cattle breeds. Anim Genet. 47:273–401.
- Bongiorni S, Gruber CEM, Chillemi G, Bueno S, Failla S, Moioli B, Ferrè F, Valentini A. 2016b. Skeletal muscle transcriptional profiles in two Italian beef breeds, Chianina and Maremmana, reveal breed specific variation. Mol Biol Rep. 43:253–268.
- Bovine HapMap Consortium. 2009. Genome wide survey of SNP variation uncovers the genetic structure of cattle breeds. Science 324:528–532.
- Chang TC, Yu D, Lee YS, Wentzel EA, Arking DE, West KM, Dang CV, Thomas-Tikhonenko A, Mendell JT. 2008. Widespread microRNA repression by Myc contributes to tumorigenesis. Nat Genet. 40:43–50.
- Chen R, Runswick MJ, Carroll J, Fearnley IM, Walker JE. 2007. Association of two proteolipids of unknown function with ATP synthase from bovine heart mitochondria. FEBS Lett. 581:3145–3148.
- Huang W, Khatib H. 2010. Comparison of transcriptomic landscapes of bovine embryos using RNA-Seq. BMC Genomics 11:711.
- Huang W, Nadeem A, Zhang B, Babar M, Soller M, Khatib H. 2012. Characterization and comparison of the leukocyte transcriptomes of three cattle breeds. PLoS One 7:e30244.
- Jiang Z, Uboh CE, Chen J, Soma LR. 2013. Isolation of RNA from equine peripheral blood cells: comparison of methods. Springerplus 2:1–6.
- Kamalzadeh A, Rajabbaigy M, Kiasat A. 2008. Livestock production systems and trends in livestock industry in Iran. J Agri Soc Sci. 4:183–188.
- Kendziorski C, Irizarry RA, Chen KS, Haag JD, Gould MN. 2005. On the utility of pooling biological samples in microarray experiments. Proc Natl Acad Sci USA. 102:4252–4257.
- Kim D, Pertea G, Trapnell C, Harold P, Kelley R, Salzberg SL. 2013. TopHat2: accurate alignment of transcriptomes in the presence of insertions, deletions and gene fusions. Genome Biol. 14:R36.
- Kim Y, Fedoriw AM, Magnuson T. 2012. An essential role for a mammalian SWI/SNF chromatin-remodeling complex during male meiosis. Development 139:1133–1140.
- Kolitz SE, Lorsch JR. 2010. Eukaryotic initiator tRNA: finely tuned and ready for action. FEBS Lett. 584:396–404.
- Martinez-Azorin F, Remacha M, Ballesta JP. 2008. Functional characterization of ribosomal P1/P2 proteins in human cells. Biochem J. 413:527–534.
- McDougall S, Parker KI, Heuer C, Compton CWR. 2009. A review of prevention and control of heifer mastitis via non-antibiotic strategies. Vet Microbiol. 134:177–185.
- Menéndez-Buxadera A, Palacios-Espinosa A, Espinosa-Villavicencio JL, Guerra-Iglesias D. 2016. Genotype environment interactions for milk production traits in Holstein and crossbred Holstein–Zebu cattle populations estimated by a character state multibreed model. Livest Sci. 191:108–116.
- Mortazavi A, Williams BA, McCue K, Schaeffer L, Wold B. 2008. Mapping and quantifying mammalian transcriptomes by RNA-Seq. Nat Methods. 5:621–628.
- Rajkumar AP, Qvist P, Lazarus R, Lescai F, Ju J, Nyegaard M, Mors O, Børglum AD, Li Q, Christensen JH. 2015. Experimental validation of methods for differential gene expression analysis and sample pooling in RNA-Seq. BMC Genomics. 16:548.
- Salleh MS, Mazzoni G, Höglund JK, Olijhoek DW, Lund P, Løvendahl P, Kadarmideen HN. 2017. RNA-Seq transcriptomics and pathway analyses reveal potential regulatory genes and molecular mechanisms in high- and low-residual feed intake in Nordic dairy cattle. BMC Genomics. 18:258.
- Salem M, Vallejo RL, Leeds TD, Palti Y, Liu S, Sabbagh A, Rexroad CE, Yao J. 2012. RNA-Seq identifies SNP markers for growth traits in rainbow trout. PLoS ONE. 7:e36264.
- Trapnell C, Williams BA, Pertea G, Mortazavi A, Kwan G, Van Baren MJ, Salzberg SL, Wold BJ, Pachter L. 2010. Transcript assembly and quantification by RNA-Seq reveals unannotated transcripts and isoform switching during cell differentiation. Nat Biotechnol. 28:511–515.
- Van Solingen C, Seghers L, Bijkerk R, Duijs JM, Roeten MK, van Oeveren-Rietdijk AM, Baelde HJ, Monge M, Vos JB, de Boer HC, et al. 2009. Antagomir-mediated silencing of endothelial cell specific microRNA-126 impairs ischemia-induced angiogenesis. J Cell Mol Med. 13:1577–1585.
- Wakchaure R, Ganguly S, Para PA, Praveen PK, Kumar A, Sharma S. 2015. Development of crossbred cattle in India: a review. Int J Adv Res Technol. 5:75–77.
- Wang X, Zhang Y, Zhang X, Wang D, Jin G, Li B, Xu F, Cheng J, Zhang F, Wu S, et al. 2017. The comprehensive liver transcriptome of two cattle breeds with different intramuscular fat content. Biochem Biophys Res Commun. 490:1018–1025.
- Wang Z, Gerstein M, Snyder M. 2009. RNA-Seq: a revolutionary tool for transcriptomics. Nat Rev Genet. 10:57–63.