
Abstract
The knowledge of milk proteome has been greatly enhanced by technological advances in the proteomics field as the use of the two-dimensional differential in-gel electrophoresis, a gel-based approach which allowed the analysis of proteins from complex mixtures and the comparing of several protein samples in the same experiment. The aim of this study was to characterise the whole milk proteomic profile in Girgentana dairy goat breed by two-dimensional differential in-gel elecrophoresis. The obtained representative 2D whole milk proteomic map showed a general picture of the protein distributions over the pH 3–10 NL including about 100 spots, most of them organised like a spot train. Among differentially abundant spots in the three experimental conditions, milk fat globule EGF factor 8 protein, β-lactoglobulin, β-casein and serum albumin were successfully identified. The three-dyes system employed in two-dimensional differential in-gel electrophoresis (2D-DIGE) analysis allowed us to obtain a global representation of the Girgentana whole milk proteome. These preliminary results could be used to generate a milk reference proteomics map for the Girgentana goat breed.
Introduction
In the animal production field, proteomics has become a fundamental research tool for proteins characterisation, biomarker discovery for food quality and authentication process. Milk proteins have been subject of intense research for over 50 years and proteomic techniques have been used to study milk and dairy products (O’Donnell et al. Citation2004; Manso et al. Citation2005). Proteomic studies have been specifically aimed at: (i) the characterisation of milk fat globules (MFGs) (Cebo et al. Citation2010; Pisanu et al. Citation2011, Citation2012; Spertino et al. Citation2012; Murgiano et al. Citation2013); (ii) the pathophysiological status of mammary gland (Beddek et al. Citation2008; Rawson et al. Citation2012); (iii) the monitoring of animal health and the identification of new biomarkers for the early diagnosis of udder diseases in dairy animals (Bendixen et al. Citation2011; Chiaradia et al. Citation2013). Studies on goat were performed in order to characterise milk protein polymorphisms by sodium dodecyl sulfate-polyacrylamide gel electrophoresis (SDS-PAGE) and two dimensional PAGE (2D-PAGE) analysis (Kumar et al. Citation2013) or to analyse and compare milk protein composition by proteomics approaches gel-based and gel-free (da Costa et al. Citation2014; Cunsolo et al. Citation2015). Recently, a new proteomic approach, two-dimensional differential in-gel electrophoresis (2D-DIGE), has been increasingly used to find new biomarkers, as it is able to overcome the shortcomings of conventional 2D-PAGE, to analyse simultaneously several samples, and to use an internal standard of mixed samples on all gels for inter-gel alignment and relative quantification of spots (Marouga et al. Citation2005; McNamara et al. Citation2010). 2D-DIGE was applied on MFGs proteins to study their composition in goats with different genotypes at αs1-casein locus (Cebo et al. Citation2012). This method was also applied to investigate the proteomic changes occurring in MFGs of Sarda sheep naturally infected by pathogens (Addis et al. Citation2011), to analyse the bovine mammary epithelial cells during lactation (Janjanam et al. Citation2014) and to study the proteome of mammary gland tissue in water buffalo (Jena et al. Citation2015).
Goat milk is of great importance in many countries, as it is essential for survival and well-being of infants and elderly with cow milk protein allergic reactions (Haenlein Citation2001, Citation2004). One of the most important factors in the recent increased consumption of goat milk and dairy products in the world is the beneficial effect on human health fully recognised by the scientific community (Silanikove et al. Citation2010; Yangilar Citation2013; García et al. Citation2014; Tripathi Citation2015). Goat milk has an acceptable, attractive scent and taste, and can be consumed as an alternative to cow milk because it is most tolerable (i.e. less allergenic) (Park and Guo Citation2006; Park and Haenlein Citation2007), and more digestible (Jandal Citation1996; Bevilacqua et al. Citation2001; Lara-Villoslada et al. Citation2004).
The Girgentana goat is an old Sicilian autochthonous breed. The economic importance of this breed was based on direct retail (door to door sales) of milk used for human consumption. The impositions of sanitary regulations have prohibited both the breeding of these animals within urban farms, and the direct sale of the milk. Therefore, due to sanitary policies, the size of the Girgentana population decreased almost 90% in 20 years. In fact, over recent years this breed has become almost extinct (Mastrangelo et al. Citation2017). Therefore, it could be interesting to evaluate the possibility of revitalising interest in the milk produced by this breed in order to regain an important economic role in the production of quality ‘drinking milk’ requested for particular food products, such as milk for infants, and in the production of niche products (Mastrangelo et al. Citation2013; Sardina et al. Citation2015). The aim of this study was to characterise the whole milk proteomic profile in Girgentana goat breed exploiting the potentiality of 2D- to compare the different expressions of proteins: (i) in the first lactation stage among two flocks, (ii) in three time points during lactation, (iii) within the two flocks. Variations of protein expression emerged by 2D-DIGE analysis were analysed through liquid chromatography/mass spectrometry (LC-MS/MS).
Materials and methods
Sample collection and processing
Girgentana goat bulk milk samples were collected from two different flocks located in Agrigento and Palermo provinces. Sample collection was performed from November 2013 to May 2014. For each flock, F1 (Agrigento area) and F2 (Palermo area), three time points during lactation were considered for sampling: 30 d (M1), 80 d (M2) and 150 d (M3) after kidding, respectively. Milk samples (F1M1, F1M2, F1M3, F2M1, F2M2, F2M3) were mixed with a protease inhibitor solution (Protease inhibitor mix, GE Healthcare Life Sciences, Little Chalfont, UK), quantified using 2D-Quant kit (GE Healthcare Life Sciences, Little Chalfont, UK), and purified with 2-D Clean-Up Kit (GE Healthcare Life Sciences, Little Chalfont, UK) following protocols suggested by manufacturer. Before electrophoretic analysis, samples were mixed with DNase (100 μg/mL) and RNase (50 μg/mL) and diluted to the final concentration of 5 μg/μL within lysis buffer (30 mM Tris, 7 M Urea, 2 M Thiourea, 4% CHAPS pH 8.5). Quality of protein samples was checked loading 30 μg onto 12% SDS-PAGE, staining the gel with SYPRO® Ruby Protein Gel Stain (Life Technologies, Carlsbad, CA) according to manufacturer’s protocol. Before differential analysis, one whole milk sample was obtained by mixing aliquots of 1 mL of each collected samples (F1M1, F1M2, F1M3, F2M1, F2M2, F2M3). A representative 2D-map was obtained loading 30 μg of protein for SYPRO® Ruby (Life Technologies, Carlsbad, CA) staining and 500 μg for Coomassie Blue R-250 staining of the milk pooled sample. Gel images were acquired using the EttanDIGE imager scanner (GE Healthcare Life Sciences, Little Chalfont, UK) for SYPRO® Ruby staining and Molecular Imager VersaDoc MP Imaging System (Bio Rad, Hercules, CA) for Coomassie Brilliant Blue R-250 staining, according to manufacturer’s protocol.
Protein pools preparation and labelling
Protein pools (M1, M2, M3, F1 and F2) and not pooled samples (F1M1 and F2M1) were labelled using DIGE-specific dyes Cy2, Cy3 or Cy5 (GE Healthcare Life Sciences, Little Chalfont, UK) according to the manufacturer’s instructions. A total of 50 μg of proteins was mixed with 400 pmol of CyDyes and incubated on ice in the dark for at least 30 min. The reaction was stopped by addition of 10 mM lysine and incubated on ice for 10 min. All samples were dye-swapped by labelling with both Cy3 and Cy5 dyes in order to eliminate the dye-specific bias. For each experiment, internal standard was prepared by mixing equal amounts of the analysed samples and labelled with Cy2.
Protein pools strategy was used to analyse more samples in the same experiment. Two pools were prepared for the differential analysis among lactation periods and geographical areas. In details, M1, M2 and M3 pools were obtained by mixing equal amounts of F1M1+F2M1, F1M2+F2M2 and F1M3+F2M3 samples, respectively. F1 and F2 pools were prepared by mixing equal amounts of F1M1 + F1M2 + F1M3 and F2M1 + F2M2 + F2M3 samples, respectively.
2D-DIGE analysis
The labelling schemes and the number of casted gels for each DIGE experiment were reported in supplementary material (Supplementary material Tables S1, S2 and S3). For isoelectric focussing (IEF), DeStreak rehydration solution (GE Healthcare Life Sciences, Little Chalfont, UK) containing 0.68% v/v IPG buffer (GE Healthcare Life Sciences, Little Chalfont, UK) and 10 mM DTT, was added to each mix up to final volume of 340 μL. IEF was performed using pH range 3–10 NL 18 cm-IPG strips (GE Healthcare Life Sciences, Little Chalfont, UK). Strips were rehydrated for 1 h with proteins solution at room temperature. EttanIPGphor 3 IEF System (GE Healthcare Life Sciences, Little Chalfont, UK) was used for IEF performing a 30 V pre-step followed by six steps: 200 V for 1 h; 300 V for 30 min; a gradient linearly increased from 300 to 3500 V during 3 h; 3500 V for 1 h; another linear gradient from 3500 to 8000 V during 30 min; 8000 V for 8 h; reaching the desired total 76,000 Vh. All steps were performed at 20 °C using 40 μA per strip. After IEF, IPG strips were saturated for 10 min with an equilibration buffer containing 6 M urea, 30% v/v glycerol, 2% w/v SDS, 50 mM Tris-HCl pH 6.8, 0.02% bromophenol blue and 1% w/v DTE. Then, thiol groups were blocked by substituting DTE with 2.5% w/v iodoacetamide in the equilibration buffer. Focused proteins were separated on 12.5% polyacrylamide gels (SDS-PAGE) according to Laemmli (Citation1970) protocol at 10 °C in an Ettan DALTsix Electrophoresis System (GE Healthcare Life Sciences, Little Chalfont, UK). The same run conditions were used to perform the experiments. Image acquisition was carried out with Typhoon™ FLA 9500 scanner. For each experiment, an area containing the most intense spots was selected and spot saturation was checked on each of the resulting Cy2-, Cy3- and Cy5-images. Once satisfactory images were obtained, the gels were scanned using the same set-up voltage values for Cy2, Cy3 and Cy5 and setting the image resolution to 100 μm.
Table 1. Protein spots showing differences in protein abundance in F1M1 vs F2M1 milk samples comparison identified by LC-MS/MS. For a full definition of milk samples, see “Sample collection and processing”.
Table 2. Protein spots showing differences in protein abundance for M1/M2 and M1/M3 milk samples comparisons identified by LC-MS/MS. For a full definition of milk samples, see “Protein pools preparation and labelling”.
Protein visualisation and image analysis
Image Master 2D Platinum version 7.0 DIGE software (GE Healthcare Life Sciences, Little Chalfont, UK) was used for data analysis. In a first step, estimated number of spots was set to 2500 and spots were co-detected in individual gels. In a second step, protein spots were automatically detected and then matched among individual gels. Finally, the lists of spots were reviewed manually in order to remove any artefact and identify clear and shoulder spots in each spots report. The individual spot abundance was automatically calculated from 2D-gels as mean spot volume, i.e. integration of optical density over spot area, and normalised to the Cy2-labelled internal pooled protein standard. Protein spots which showed more than 1.5-fold change in spot volume (increased for up-regulation or decreased for down-regulation), with a statistically significant ANOVA value (p ≤ .05), were considered differentially represented, and further selected for the identification by mass spectrometry (MS) analysis.
2D preparative analysis, spots picking and protein identification
A total of three gels were casted as preparative ones and 500 μg of proteins were loaded on each preparative gel composed by samples F1M1 and F2M1 for the first one, M1, M2 and M3 pools for the second one and F1 and F2 pools for the third one. First and second dimension electrophoresis were carried out using the same experimental conditions set up for the analytical gels. Gels were stained with Coomassie Blue R-250 and visible protein spots of interest were manually excised. After picking, each spot was transferred into a tube containing 1.5 mL acetonitrile and stored at 4 °C until MS analysis. Spots were identified in outsourcing through LC-MS/MS analysis by the Proteomics facility of Porto Conte Ricerche (Sardinia). Briefly, excised spots were destained and subjected to in-gel digestion. Hydrolysis was carried out with trypsin (50–100 ng per spot) overnight at 37 °C. The resulting mixtures of peptides were analysed by LC-MS/MS on an ion trap (XCT Ultra 6340) equipped with a nano high-performance liquid chromatography (HPLC) system (HP1200) with a chip cube (Agilent Technologies, Palo Alto, CA). Parameters of MS method were: capillary voltage 1730 V ICC Trap smart target 300,000 and maximal accumulation time 100 ms. Raw files were analysed using the Proteome Discoverer software (version 1.4; Thermo Scientific, Bremen, Germany) using Sequest-HT as a search engine and selecting the following parameters: database UniProtKB, taxonomy built by joining FASTA sequences of Bos, Capra hircus and Ovis aries, enzyme trypsin, precursor mass tolerance 250 ppm, fragment mass tolerance 0.5 Da, cysteine carbamidomethylation as fixed modification, conversion of the N-terminal glutamine to pyroglutamic acid and oxidation of methionine, as variable modifications. The percolator algorithm was used for significance and validation of the identification (p-value <.01e q-value <.05).
Results and discussion
Monodimensional and bidimensional analysis
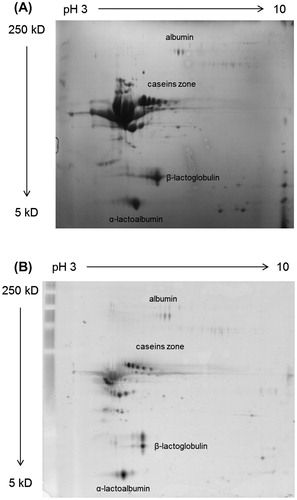
Figure showed the SDS-PAGE analysis of F2M1, F2M2, F2M3, F1M1, F1M2 and F1M3 protein samples (from lanes 2 to 7). In all samples, it was possible to observe: a higher molecular weight profile bands corresponding to immunoglobulins, lactoferrin and serum albumin; the caseins zone in which two large diffuse bands were present; and two defined bands at lower molecular weight corresponding to β-lactoglobulin and α-lactalbumin proteins (Figure ). The representative 2D whole milk proteomic map obtained with different protein amounts and staining methods (Figure ) showed a general picture of the protein distributions over the pH 3–10 NL (Figure ). About 100 spots were found, most of them organised like a spot train, due to great polymorphism and extensive post-translational modification events occurring in milk proteins (Moioli et al. Citation1998). Qualitative analysis performed on the 2D gels showed an electrophoretic pattern similar to that reported by other authors (D’auria et al. Citation2005; Olumee-Shabon et al. Citation2013). In fact, it was possible to identify the caseins zone, two areas of spots with low molecular weights corresponding to β-lactoglobulin and α-lactalbumin, and an isoelectric series with high molecular weight corresponding to albumin zone. Staining methods employed to detect proteins on the gels, allowed to characterise the global 2D protein profile of whole milk with a good resolution, and protein quality was considered suitable for the further differential analysis.
Figure 1. SDS-PAGE analysis of whole milk samples. Lanes from 2 to 7 =F2M1, F2M2, F2M3, F1M1, F1M2, F1M3; molecular weight marker = lanes 1. SDS-PAGE: sodium dodecyl sulfate-polyacrylamide gel electrophoresis. For a full definition of milk samples, see “Sample collection and processing”.
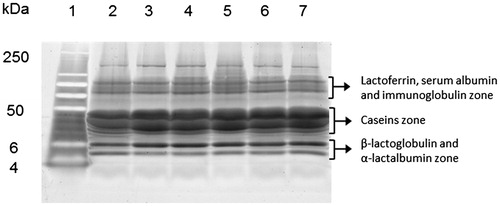
Figure 2. 2D-map of whole milk pooled sample (obtained with all milk samples F1M1+F1M2+F1M3+F2M1+F2M2+F2M3) of Girgentana goat with Coomassie Blue R-250 (A) and SYPRO® Ruby (B) staining. For a full definition of milk samples, see “Sample collection and processing”.
Differential proteomic analysis on whole milk at early stage of lactation
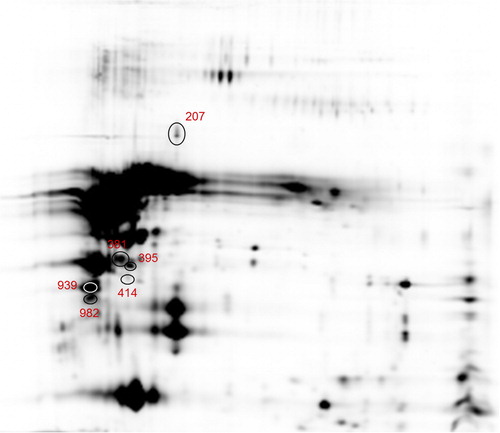
The overlay images for the emission fluorescence channels of Cy2, Cy3 and Cy5 were showed in Supplementary material (Figure S1). From the four gels, a total of 401 protein spots were successfully resolved and matched. Among these, many isoforms were present resulting from post-translational modifications and/or processing. Proteins labelled with Cy3 and Cy5 were compared and normalised with Cy2 labelled samples. This methodology enabled the normalisation of the Cy3/Cy2 and Cy5/Cy2 intra-gel ratios between gels due to the signal from the Cy2 internal standard, which was present in each gel. The manual revision of the spot lists was performed to identify clear and shoulder spots. After filtering the dataset to remove not informative data, a total of 185 spots were identified (Supplementary material Table S4). Among these, 68 clear spots were differentially abundant, of which 41 up-regulated and 27 down-regulated in F1M1 vs F2M1, respectively. Differentially abundant shoulder spots were 21 in F1M1 vs F2M1 of which 8 up-regulated and 13 down-regulated. Among differentially abundant spots, a group of six (Supplementary material Table S5) were successfully identified in outsourcing. Protein identification was considered robust if at least two unique peptides were assigned in LC-MS/MS analysis. Among picked spots, two were assigned to β-casein using a medium filter. Table showed the results for the identified spots indicated with a circle on Figure (Table and Figure ). Spot ID 207 was identified as β-lactoglobulin, the major whey protein in the milk of ruminants. β-lactoglobulin has been identified in milk of several species (Sawyer and Kontopidis Citation2000; Sawyer Citation2013) but it has not been found in milk of mammals such as lagomorphs, rodents and humans (Kontopidis et al. Citation2004). Although no clear physiological functions have been defined for β-lactoglobulin, a role in the transport of retinol and fatty acids has been suggested (Perez and Calvo Citation1995). In goat, no variants producing amino acid change have been characterised at DNA level and only one goat β-lactoglobulin isoform has been identified until now (Folch et al. Citation1996). β-lactoglobulin expression level was found higher in F1M1 than F2M1. This difference could be explained considering what was reported by Chianese et al. (Citation2000) which analysed milk samples of Girgentana goat by HPLC analysis. These authors showed the different relative amount of β-lactoglobulin with respect to total whey protein content (β-lactoglobulin and α-lactalbumin together). Spot IDs 381, 395 and 414 were identified as κ-casein. The κ-casein fraction plays an important role in the formation, stabilisation and aggregation of casein micelles affecting the technological and nutritional properties of milk (Boettcher et al. Citation2004; Kubarsepp et al. Citation2005). Spot ID 939 was identified as β-casein and spot ID 982 as αs1-casein. The αs1-casein represents the most extensively investigated fraction in goat species. Polymorphism at αs1-casein locus has been shown to affect not only the quantity of casein in goat milk, but also the structural and nutritional characteristics and technological properties of milk (Martin et al. Citation2002; Rijnkels Citation2002). Among the differentially abundant proteins identified at early stage of lactation, β- and κ-casein resulted more abundant in F2M1 than F1M1. Montalbano et al. (Citation2014), in a study based on a RP-HPLC method for separation and quantification of αs1-casein genetic variants in Girgentana goat milk, showed that A, B, and F alleles were associated with a content of αs1-casein in milk of 3.2 ± 0.4, 5.4 ± 0.5, 0.7 ± 0.1 g/L, respectively. Moreover, in another study, the same authors performed the quantification of two β-casein alleles: C = 3.0 ± 0.8 g/L and C1 = 2.0 ± 0.7 g/L, respectively (Montalbano et al. Citation2016). Using genotyping data from our previous studies on CSN2 (Tortorici et al. Citation2014) and CSN3 (Di Gerlando et al. Citation2015) casein gene polymorphisms in Girgentana breed, we estimated the allele frequencies for both loci and their distribution in our flocks (Supplementary material Table S6). The frequencies of C allele at β-casein and A allele at κ-casein were higher in F2 than F1. Based on these results, we could explain the major abundance at early stage of lactation for the spots identified as β- and κ -caseins by 2D-DIGE analysis as an effect of a different allelic distribution among flocks.
Figure 3. Differential abundant protein spots identified by LC-MS/MS in F1M1 vs F2M1 milk samples comparison (207 = β-lactoglobulin, 381, 395 and 414 = κ-casein; 939 = β-casein; 982 = αS1-casein). LC-MS/MS: liquid chromatography/mass spectrometry. For a full definition of milk samples, see “Sample collection and processing”.
Differential proteomic analysis on whole milk among lactation periods
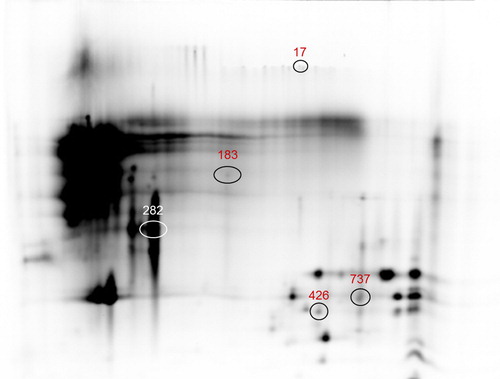
The overlay images for the emission fluorescence channels of Cy2, Cy3 and Cy5 were reported in Supplementary material Figure S2. From the six gels, a total of 2041 spots were successfully resolved and matched among all gels. In Supplementary material Table S7, a summary of results after the removal of not informative data was reported. A total of 117 spots were in common among M1, M2 and M3. Among these, 21 clear spots resulted differentially abundant, of which 1 up-regulated and 20 down-regulated in M1 vs M2. Only two shoulder spots were differentially abundant and both of them down-regulated in M1 vs M2. Comparison between M1 and M3 showed 28 differentially abundant clear spots of which 26 were down-regulated and two up-regulated, while only four shoulder spots were found down-regulated in M1 vs M3. No spots with fold change ≥1.5 were found between M2 and M3. A group of eight differentially abundant spots between M1 vs M2, and M1 vs M3 comparisons, were picked for MS identification. Protein identity was assigned for five over eight spots (Supplementary material Table S8). In fact, three spots were excluded because only a unique peptide was detected in the spectrometric analysis. Information on spots identities were reported in Table , whereas Figure showed their position on the 2D-map (Table and Figure ). For the spot ID 17, MS analysis allowed assigning identity for one epidermal growth factor of fat globules, the Milk Fat Globule EGF factor 8 (MFG-E8 or lactadherin). This glycoprotein of 398 amino acids and 44.65 kDa represents one of the major proteins of fat globules membrane, and is involved in membrane vesicles secretion and exosomes exocytosis mechanisms (Cebo et al. Citation2010, Citation2012). Some authors reported a relationship between lactadherin gene expression and milk fat secretion process in goat (Qu et al. Citation2011). Cebo et al. (Citation2012) suggested a role for lactadherin in the milk fat secretion process. The increase in lactadherin expression level in M2 and M3 vs M1 could be explained with its biological function. In fact, MFG-E8 is involved in different apoptosis-related processes, including mammary gland remodelling, and it is required in the clearance of apoptotic cells and MFGs during the mammary gland involution process (Atabai et al. Citation2005; Hanayama and Nagata Citation2005). The first stage of mammary gland involution involves the widespread apoptosis of the alveolar epithelial cells, which reverses the striking growth of the glands during the previous cycle of proliferation (Lund et al. Citation1996). The higher level of lactadherin in M3 vs M1 period (150 d vs 30 d after kidding), could be due to the increased synthesis occurring at the first phase of mammary gland involution process. Spot ID 282 has been identified as β-lactoglobulin. Our data showed that β-lactoglobulin content was higher in M2 and M3 than in M1. Differences in whey goat proteins amount during lactation were also reported by Hejtmankova et al. (Citation2012), which showed, in agreement with our results, an increased content of β-lactoglobulin at the end of lactation. Spots with IDs 183, 426 and 737 were identified as β-casein. Caprine β-casein was investigated by MS analysis in Argentata dell’Etna goat breed (Galliano et al. Citation2004), while a truncated β-casein form associated with a null allele was detected and sequenced in Rossa Mediterranea goat breed (Cunsolo et al. Citation2005). Despite the spots identified as β-casein migrated far from the caseins region, it is presumable that they were peptide fragments. It is known that raw milk contains several endogenous proteolytic activity represented by two of major enzymatic systems: plasmin and lysosomal enzymes (Fox and Kelly Citation2006). In milk, there are also present cathepsin and elastase, lytic enzymes whose primary source is represented by somatic cells, which are naturally present in milk (Li N et al. Citation2014) and which have an important key role in proteolysis of casein fraction (Santillo et al. Citation2009). The higher β-casein level in M3 vs M1 could be due to the milk yield decrease at the end of lactation leading to concentration effect, considering that β-casein is the most abundant casein in caprine milk.
Figure 4. Differential abundant protein spots identified by LC-MS/MS in M1 vs M2, M1 vs M3, and M2 vs M3 milk samples comparisons (17 = MFG EGF-factor 8; 183, 426 and 737 = β-casein; 282 = β-lactoglobulin). For a full definition of milk samples, see “Protein pools preparation and labelling”. LC-MS/MS: liquid chromatography/mass spectrometry. MFG EGF-factor 8: Milk fat globule epidermal growth-factor 8.
Differential proteomic analysis on whole milk between geographical areas
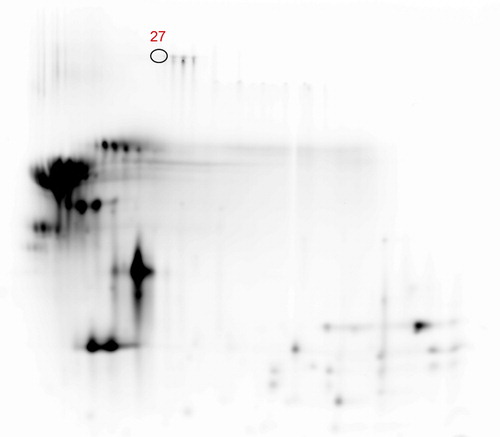
Analysis of DIGE gels resolved and matched a total of 401 spots. Supplementary material Figure S3 showed the overlay images of Cy2-, Cy3- and Cy5-fluorescent dyes. Filtered data set contained only one spot with a fold change ≥1.5 and, therefore, a higher level in F1 vs F2 (Supplementary material Table S9). Spot ID 27 (Figure ) was identified by MS as serum albumin of Capra hircus species (UniProtKB Accession number B3VHM9) with seven unique peptides and sequence coverage of 12.18 (Figure ). Serum albumin, with molecular weight of 66.3 kDa and pI of 5.58, represents the main carrier protein of the plasma involved in the transport of steroids, fatty acids and thyroid hormones in the blood stream. Serum albumin is present in milk as a consequence of permeability of the epithelial lining in the mammary gland. Increased serum albumin levels were used as indicators of mammary gland health status (Leitner et al. Citation2004). Serum albumin was found increased drastically in cow after infection with Escherichia coli as a consequence of a bigger permeability of the blood-milk barrier (Boehmer et al. Citation2008, Citation2010; Li X et al. Citation2014). The increment of serum albumin milk content showed in our work could be explained as an effect of the inflammatory state of animals belonging to the flock F2, which contributed to bulk milk sample. In a recent study, Olumee-Shabon et al. (Citation2013) observed little changes, based on apparent spot intensity, in the abundance level of serum albumin between 2D gels of both normal and infected goat milk. They used a fluorescent method based on Sypro Ruby dye to stain proteins on 2D gels and performed a qualitative analysis without reporting spots quantification values for the analysed condition. Even though our results were not in agreement with the minimal changes in abundance observed by Olumee-Shabon et al. (Citation2013), 2D-DIGE method used in the present study allowed us to quantify exactly the relative abundance of serum albumin in the compared samples and it can be considered more efficient and reproducible than a qualitative analysis based on fluorescent stain (Chevalier and Kelly Citation2010).
Figure 5. Differential abundant protein spot identified by LC-MS/MS in F1 vs F2 comparison. (27 = serum albumin). LC-MS/MS: liquid chromatography/mass spectrometry. For a full definition of milk samples, see “Protein pools preparation and labelling”.
Conclusions
Little knowledge exists on the whole proteomic profile and no reference map has been published until now for this goat breed. This work represents the first 2D-DIGE application for the characterisation of Girgentana goat whole milk proteome. Although the bulk milk contains several variables that can affect the obtained results, this study provided a general picture of the proteomic profile of milk of Girgentana goat, allowing to identify all the different expressed proteins in the three experiments. Therefore, it will be possible to use these preliminary results as the starting point for the construction of a reference map of whole milk proteins for Girgentan goat breed in order to evaluate the possibility of revitalising interest in its milk to regain an important economic role.
Supplemental Material
Download Zip (1.3 MB)Ethical approval
Sampling was carried out within the frame of milk recording scheme (following an A4 recording scheme), hence no permission from the animal research ethics committee was necessary.
Acknowledgements
The authors thank the Porto Conte Ricerche Proteomics facility for protein spots identification.
Disclosure statement
No potential conflict of interest was reported by the authors.
Additional information
Funding
Related Research Data
References
- Addis MF, Pisanu S, Ghisaura S, Pagnozzi D, Marogna G, Tanca A, Biosa G, Cacciotto C, Alberti A, Pittau M. 2011. Proteomics and pathway analyses of the milk fat globule in sheep naturally infected by Mycoplasma agalactiae provide indications of the in vivo response of the mammary epithelium to bacterial infection. Infect Immun. 79:3833–3845.
- Atabai K, Fernandez R, Huang X, Ueki I, Kline A, Li Y, Sadatmansoori S, Smith-Steinhart C, Zhu W, Pytela R, et al. 2005. Mfge8 is critical for mammary gland remodeling during involution. Mol Biol Cell. 16:5528–5537.
- Beddek AJ, Rawson P, Peng L, Snell R, Lehnert K, Hamish EW, Jordan TW. 2008. Profiling the metabolic proteome of bovine mammary tissue. Proteomics. 8:1502–1515.
- Bendixen E, Danielsen M, Hollung K, Gianazza E, Miller I. 2011. Farm animal proteomics-a review. J Proteomics. 74:282–293.
- Bevilacqua C, Martin P, Candalh C, Fauquant J, Piot M, Roucayrol AM, Pilla F, Heyman M. 2001. Goats’ milk of defecti e aS1-casein genotype decreases intestinal and systemic sensitization to β-lactoglobulin in guinea pigs. J Dairy Res. 68:217–227.
- Boehmer JL, Bannerman DD, Shefcheck KJ, Ward JL. 2008. Proteomic analysis of differentially expressed proteins in bovine milk during experimentally induced Escherichia coli mastitis. J Dairy Sci. 91:4206–4218.
- Boehmer JL, Ward JL, Peters RR, Shefcheck KJ, McFarland MA, Bannerman DD. 2010. Proteomic analysis of the temporal expression of bovine milk proteins during coliform mastitis and label-free relative quantification. J Dairy Sci. 93:593–603.
- Boettcher PJ, Caroli A, Stella A, Chessa S, Budelli E, Canavesi F, Ghiroldi S, Pagnacco G. 2004. Effects of casein haplotypes on milk production traits in Italian Holstein and Brown Swiss cattle. J Dairy Sci. 87:4311–4317.
- Cebo C, Caillat H, Bouvier F, Martin P. 2010. Major proteins of the goat milk fat globule membrane. J Dairy Sci. 93:868–876.
- Cebo C, Lopez C, Henry C, Beauvallet C, Ménard O, Bevilacqua C, Bouvier F, Caillat H, Martin P. 2012. Goat αs1 casein genotype affects milk fat globule physicochemical properties and the composition of the milk fat globule membrane. J Dairy Sci. 95:6215–6229.
- Chevalier F, Kelly AL. 2010. Proteomic quantification of disulfide-linked polymers in raw and heated bovine milk. J Agric Food Chem. 58:7437–7444.
- Chianese L, Portolano B, Troncone E, Pizzolongo F, Ferranti P, Addeo F, Alicata ML, Pilla F, Calagna G. 2000. The quality of Girgentana goat milk. Proceedings of the Seventh International Conference on Goats; Tours, France. p. 946–949.
- Chiaradia E, Valiani A, Tartaglia M, Scoppetta F, Renzone G, Arena S, Avellini L, Benda S, Gaiti A, Scaloni A. 2013. Ovine subclinical mastitis: proteomic analysis of whey and milk fat globules unveils putative diagnostic biomarkers in milk. J Proteomics. 83:144–159.
- da Costa WKA, de Souza EL, Beltrão-Filho EM, Vieira Vasconcelos GK, Santi-Gadelha T, de Almeida Gadelha CA, Franco OL, de Cássia Ramos do Egypto Queiroga R, Magnani M. 2014. Comparative protein composition analysis of goat milk produced by the Alpine and Saanen breeds in Northeastern Brazil and related antibacterial activities. PLoS ONE. 9:e93361.
- Cunsolo V, Galliano F, Muccilli V, Saletti R, Marletta D, Bordonaro S, Foti S. 2005. Detection and characterization by high-performance liquid chromatography and mass spectrometry of a goat β-casein associated with a CSN2 null allele. Rapid Commun Mass Spectrom. 19:2943–2949.
- Cunsolo V, Fasoli E, Saletti R, Muccilli V, Gallina S, Righetti PG, Foti S. 2015. Zeus, Aesculapius, Amalthea and the proteome of goat milk. J Proteomics. 128:69–82.
- D'auria E, Agostoni C, Giovannini M, Riva E, Zetterström R, Fortin R, Greppi GF, Bonizzi L, Roncada P. 2005. Proteomic evaluation of milk from different mammalian species as a substitute for breast milk. Acta Paediatrica. 94:1708–1713.
- Di Gerlando R, Tortorici L, Sardina MT, Monteleone G, Mastrangelo S, Portolano B. 2015. Molecular characterization of k-casein gene in Girgentana dairy goat breed and identification of two new alleles. Ital J Anim Sci. 14:3464.
- Folch JM, Coll A, Hayes HC, Sànchez A. 1996. Characterization of a caprine beta-lactoglobulin pseudogene, identification and chromosomal localization by in situ hybridization in goat, sheep and cow. Gene. 177:87–91.
- Fox PF, Kelly AL. 2006. Indigenous enzymes in milk, overview and historical aspects-part 1. Int Dairy J. 16:500–516.
- Galliano F, Saletti R, Cunsolo V, Foti S, Marletta D, Bordonaro S, D'Urso G. 2004. Identification and characterization of a new β-casein variant in goat milk by high-performance liquid chromatography with electrospray ionization mass spectrometry and matrix-assisted laser desorption/ionization mass spectrometry. Rapid Commun Mass Spectrom. 18:1972–1982.
- García V, Rovira S, Boutoial K, López MB. 2014. Improvements in goat milk quality, a review. Small Ruminant Res. 121:51–57.
- Haenlein GFW. 2001. Past, present, and future perspectives of small ruminant dairy research. J Dairy Sci. 84:2097–2115.
- Haenlein GFW. 2004. Goat milk in human nutrition. Small Ruminant Res. 51:155–163.
- Hanayama R, Nagata S. 2005. Impaired involution of mammary glands in the absence of milk fat globule EGF factor 8. Proc Natl Acad Sci USA. 102:16886–16891.
- Hejtmankova A, Pivec V, Trnkova E, Dragounova H. 2012. Differences in the composition of total and whey proteins in goat and ewe milk and their changes throughout the lactation period. Czech J Anim Sci. 57:331.
- Jandal JM. 1996. Comparative aspects of goat and sheep milk. Small Ruminant Res. 22:177–185.
- Janjanam J, Singh S, Jena MK, Varshney N, Kola S, Kumar S, Kaushik JK, Grover S, Dang AK, Mukesh M, et al. 2014. Comparative 2D-DIGE proteomic analysis of bovine mammary epithelial cells during lactation reveals protein signatures for lactation persistency and milk yield. PLoS ONE. 9:e102515.
- Jena MK, Janjanam J, Naru J, Kumar S, Kumar S, Singh S, Mohapatra SK, Kola S, Anand V, Jaswal S, et al. 2015. DIGE based proteome analysis of mammary gland tissue in water buffalo (Bubalus bubalis): lactating vis-a-vis heifer . J Proteomics. 119:100–111.
- Kontopidis G, Holt C, Sawyer L. 2004. Invited review: beta-lactoglobulin: binding properties, structure, and function. J Dairy Sci. 87:785–796.
- Kubarsepp I, Henno M, Viinalass H, Sabre D. 2005. Effect of k-casein and β-lactoglobulin genotypes on the milk rennet coagulation properties. Agron Res. 1:55–64.
- Kumar A, Rout PK, Mohanty BP. 2013. Identification of milk protein polymorphism in indian goats by 2D gel electrophoresis. J Proteomics Bioinform. 6:001–004.
- Laemmli UK. 1970. Cleavage of structural proteins during the assembly of the head of bacteriophage T4. Nature. 227:680–685.
- Lara-Villoslada F, Olivares M, Jiménez J, Boza J, Xaus J. 2004. Goat milk is less immunogenic than cow milk in a murine model of atopy. J Pediatr Gastroenterol Nutr. 39:354–360.
- Leitner G, Merin U, Silanikove N. 2004. Changes in milk composition as affected by subclinical mastitis in goats. J Dairy Sci. 87:1719–1726.
- Li N, Richoux R, Boutinaud M, Martin P, Gagnaire V. 2014. Role of somatic cells on dairy processes and products: a review. Dairy Sci Technol. 94:517–538.
- Li X, Ding XZ, Wan YL, Liu YM, Du GZ. 2014. Comparative proteomic changes of differentially expressed whey proteins in clinical mastitis and healthy yak cows. Genet Mol Res. 13:6593–6601.
- Lund LR, Rømer J, Thomasset N, Solberg H, Pyke C, Bissell MJ, Dano K, Werb Z. 1996. Two distinct phases of apoptosis in mammary gland involution: proteinase-independent and -dependent pathways. Development. 122:181–193.
- Manso MA, Leonil J, Jan G, Gagnaire V. 2005. Application of proteomics to the characterisation of milk and dairy products. Int Dairy J. 15:845–855.
- Marouga R, David S, Hawkins E. 2005. The development of the DIGE system: 2D fluorescence difference gel analysis technology. Anal Bioanal Chem. 382:669–678.
- Martin P, Szymanowska M, Zwierzchowski L, Leroux C. 2002. The impact of genetic polymorphisms on the protein composition of ruminant milks. Reprod Nutr Dev. 42:433–459.
- Mastrangelo S, Sardina MT, Tolone M, Portolano B. 2013. Genetic polymorphism at the CSN1S1 gene in Girgentana dairy goat breed. Anim Prod Sci. 53:403–406.
- Mastrangelo S, Tolone M, Montalbano M, Tortorici L, Di Gerlando R, Sardina MT, Portolano B. 2017. Population genetic structure and milk production traits in Girgentana goat breed. Anim Prod Sci. 57:430–440.
- McNamara LE, Dalby MJ, Riehle MO, Burchmore R. 2010. Fluorescence two dimensional difference gel electrophoresis for biomaterial applications. J R Soc Interface. 7:S107–S117.
- Moioli B, Pilla F, Tripaldi C. 1998. Detection of milk protein genetic polymorphisms in order to improve dairy traits in sheep and goats, a review. Small Ruminant Res. 27:185–195.
- Montalbano M, Segreto R, Di Gerlando R, Mastrangelo S, Sardina MT. 2016. Quantitative determination of casein genetic variants in goat milk: application in Girgentana dairy goat breed. Food Chem. 192:760–764.
- Montalbano M, Tortorici L, Mastrangelo S, Sardina MT, Portolano B. 2014. Development and validation of RP-HPLC method for the quantitative estimation of αs1-genetic variants in goat milk. Food Chem. 156:165–169.
- Murgiano L, D'Alessandro A, Zolla L, Valentini A, Pariset L. 2013. Comparison of milk fat globule membrane (MFGM) proteins in milk samples of Chianina and Holstein cattle breeds across three lactation phases through 2D IEF SDS PAGE — a preliminary study. Food Res Int. 54:1280–1286.
- O’Donnell R, Holland JW, Deeth C, Alewood P. 2004. Milk proteomics. Int Dairy J. 14:1013–1023.
- Olumee-Shabon Z, Swain T, Smith EA, Tall E, Boehmer JL. 2013. Proteomic analysis of differentially expressed proteins in caprine milk during experimentally induced endotoxin mastitis. J Dairy Sci. 96:2903–2912.
- Park YW, Guo MR. 2006. Goat milk products, processing technology, types and consumption trends. In: Park YW, Haenlein GFW, editors. Handbook of milk of non-bovine mammals. Ames (IA): Blackwell Publishing; p. 449.
- Park YW, Haenlein GFW. 2007. Goat milk, its products and nutrition. In: Hui YH, editor. Handbook of food products manufacturing. New York (NY): Wiley; p. 448–486.
- Perez MD, Calvo M. 1995. Interaction of beta-lactoglobulin with retinol and fatty acids and its role as a possible biological function for this protein: a review. J Dairy Sci. 78:978–988.
- Pisanu S, Ghisaura S, Pagnozzi D, Biosa G, Tanca A, Roggio T, Uzzau S, Addis MF. 2011. The sheep milk fat globule membrane proteome. J Proteomics. 74:350–358.
- Pisanu S, Ghisaura S, Pagnozzi D, Falchi G, Biosa G, Tanca A, Roggio T, Uzzau S, Addis MF. 2012. Characterization of sheep milk fat globule proteins by two-dimensional polyacrylamide gel electrophoresis/mass spectrometry and generation of a reference map. Int Dairy J. 24:78–86.
- Qu Y, Liu Y, Ma L, Sweeney S, Lan X, Chen Z, Li Z, Lei C, Chen H. 2011. Novel SNPs of butyrophilin (BTN1A1) and milk fat globule epidermal growth factor (EGF) 8 (MFG-E8) are associated with milk traits in dairy goat. Mol Biol Rep. 38:371–377.
- Rawson P, Stockum C, Peng L, Manivannan B, Lehnert K, Ward HE, Berry SD, Davis SR, Snell RG, McLauchlan D, et al. 2012. Metabolic proteomics of the liver and mammary gland during lactation. J Proteomics. 75:4429–4435.
- Rijnkels M. 2002. Multispecies comparison of the casein gene loci and evolution of casein gene family. J Mammary Gland Biol Neoplasia. 7:327–345.
- Santillo A, Kelly AL, Palermo C, Sevi A, Albenzio M. 2009. Role of indigenous enzymes in proteolysis of casein in caprine milk. Int Dairy J. 19:655–660.
- Sardina MT, Tortorici L, Mastrangelo S, Di Gerlando R, Tolone M, Portolano B. 2015. Application of microsatellite markers as potential tools for traceability of Girgentana goat breed dairy products. Food Res Int. 74:115–122.
- Sawyer L. 2013. β-lactoglobulin. In: McSweeney PLH, Fox PF, editors. Advanced dairy chemistry. Proteins: basics aspects, Vol. 1A, 4th ed. New York, NY: Springer; p. 211–259.
- Sawyer L, Kontopidis G. 2000. The core lipocalin, bovine beta-lactoglobulin. Biochim Biophys Acta. 1482:136–148.
- Silanikove N, Leitner G, Merin U, Prosser CG. 2010. Recent advances in exploiting goat's milk: quality, safety and production aspects. Small Ruminant Res. 89:110–124.
- Spertino S, Cipriani V, De Angelis C, Giuffrida MG, Marsano F, Cavaletto M. 2012. Proteome profile and biological activity of caprine, bovine and human milk fat globules. Mol BioSyst. 8:967–974.
- Tortorici L, Di Gerlando R, Mastrangelo S, Sardina MT, Portolano B. 2014. Genetic characterisation of CSN2 gene in Girgentana goat breed. Ital J Anim Sci. 13:3414–3722.
- Tripathi MK. 2015. Comforts in quality and production of goat milk. J Adv Dairy Res. 3:e115.
- Yangilar F. 2013. As a potentially functional food, goats’milk and products. J Food Nutr Res. 1:68–81.