
 ?Mathematical formulae have been encoded as MathML and are displayed in this HTML version using MathJax in order to improve their display. Uncheck the box to turn MathJax off. This feature requires Javascript. Click on a formula to zoom.
Abstract
Multivariate statistical techniques were used to characterise the differences between precocious and non-precocious Nellore females regarding the phenotypic expression of various reproductive and productive traits. Information of 13,105 females was used in a correspondence analysis to describe the relationship of heifer early pregnancy and the categorical variables (stayability and visual scores). Moreover, principal component and factor analyses were used to investigate the relationship between early pregnancy and the continuous variables. These statistical techniques allow synthesising the information of a large set of random and correlated traits in a reduced set of uncorrelated latent variables generated as linear combinations of the original dataset. In this study, principal component and factor analyses indicated that sexually precocious females present higher weight gain from weaning to yearling, backfat thickness, longevity, and cumulative productivity than non-precocious females. In the correspondence analysis, precocious females were associated with score 4, which is between the intermediate and the extremely high expression, of conformation, muscling, finishing precocity and size, and with value 1 (favourable) of stayability. All these findings indicate that the use of precocious females could benefit the overall performance of a herd since they present higher growth rate, better product quality and higher lifetime productivity than non-precocious cows.
Multivariate statistical techniques were used to investigate the relationship pattern of complex traits in Nellore cattle.
The anticipation of heifer reproductive life was favourably associated with cumulative productivity and longevity in beef cattle.
Using precocious females could benefit all production phases of a herd.
Highlights
Introduction
In an integrated beef cattle production system, economic important traits are related to growth, reproductive efficiency, and production. Growth traits (weights, weight gains at young ages, and visual scores), meat quality indicator traits (ultrasound-measured longissimus muscle area and subcutaneous fat thickness), and female reproductive traits (age at first calving, early pregnancy, days to calving, cumulative productivity, stayability, and longevity) are among the most relevant for the beef industry.
In some Brazilian Nellore breeding programmes, females have been exposed to reproduction with about 15–17 months of age, in an attempt to identify those sexually precocious. Anticipating heifer reproductive life may increase herd profitability (Day and Nogueira Citation2013). However, studies about the effects of this reproductive management on females productive life are scarce in the literature (Terakado et al. Citation2015). Considering the multidimensional nature of production systems in which a number of traits related to reproduction, growth and meat quality are of interest, it becomes important to evaluate the impact of the anticipation of heifers reproductive life on their reproductive and productive performance.
When various random and strongly associated traits are of interest, multivariate statistical techniques can be used to reduce the data dimensionality, allowing to test the desired effects in a smaller set of uncorrelated latent variables generated as linear combinations of the observed traits (Hotelling Citation1933). With these exploratory techniques researchers can cope with issues of considerable complexity, such as the relationships between multivariate complex phenotypes, by capturing the data variability into latent variables of easy interpretation (Milstein et al. Citation2005; Macciotta et al. Citation2006). Various studies have been carried out aiming to investigate the phenotypic relationships between sexual precocity and production traits in cattle (Short and Bellows, Citation1971; Buskirk et al. Citation1995; Day and Nogueira, Citation2013; Terakado et al. Citation2015). However, most of these were in Bos taurus and, practically, none with multivariate statistical techniques. The aim of the present study was to use multivariate exploratory techniques to compare the phenotypic expression of precocious and non-precocious Nellore (Bos indicus) females for various productive and reproductive traits.
Material and methods
Animal Care and Use Committee approval was not necessary because the data used in this study come from a commercial Nellore population. All animal procedures were approved by the ethical committee of the School of Agricultural and Veterinary Science (FCAV/UNESP). Protocol number 18340/16.
Farm management and dataset
The dataset used in the present study was from a Nellore breeding programme with animals distributed in various regions of Brazil. Animals are raised on pasture, mainly of Brachiaria sp. and Panicum maximum grasses, with a stocking rate ranging from 1.2 to 1.6 AU/ha and access to mineral salt ad libitum.
Basically, at birth, all calves are weighed, identified with a unique code and assigned into management groups. Cows and calves are kept together until weaning that occurs when the offspring is at about 7 months of age. At weaning and at yearling, the animals are weighed and evaluated for the visual scores of conformation, finishing precocity, and muscling. The weaning and post-weaning weight gains and visual scores are then included in the selection index. Approximately 80% of the females born on the farms remain in the herd to become dams and 25% of the males become bulls.
The reproductive management adopted in the farms is based on two breeding seasons: (1) fall season, in which females at about 15 to 17 months of age (with approximately 280 kg of body weight) are allowed to breed for 60 days to identify sexually precocious animals; (2) summer season, in which all females are exposed to reproduction for a period of 90 days. Thus, heifers that do not conceive in the first season have a second opportunity in the summer season and those (dams and heifers) that do not conceive in this season are culled.
A total of 13,105 Nellore females were used and all of them had phenotypic information for all traits. These animals were offspring of 1096 sires and 9838 dams. EP was obtained classifying each female as precocious (heifers with age at first calving equal or lower than 30 months) or non-precocious (heifers with age at first calving higher than 30 months). In this dataset, 43.46% and 56.54% were precocious and non-precocious, respectively.
A correspondence analysis was used to describe the relationship of EP and the categorical variables (stayability and scores of conformation, finishing precocity, muscling, and size). The relationship between EP and the continuous variables (weight gains from birth to weaning and from weaning to yearling, backfat thickness at yearling, days to second calving, age at first calving, longevity, and cumulative productivity) were analysed using both principal components and factor analysis.
For stayability, the value of 1 was attributed to a female that weaned at least three calves until 76 months of age (34.70% of the females); otherwise zero (65.30% of the females). For the visual scores, all measured at yearling, the values ranged from 1 to 5, the lowest and the highest phenotypic expression, respectively, and were attributed by three examiners to each animal based on the contemporary group. Conformation score is associated with the amount of meat in the carcase. Finishing precocity refers to the potential of the animal to reach the minimum finishing level. Muscling score is evaluated by observing the animal degree of muscle development, and the ratio between length and height is considered for the score of size (Koury Filho et al. Citation2009).
Only females with age at first calving from 20 to 40 months, and with an interval between the first and second calving from 270 to 365 days were considered for principal component and factor analyses. Days to second calving was defined as the difference between the dates of the second calving and of the first day of the respective breeding season. Longevity was calculated as the difference between the dates of the last weaned calf and the cow birth. Cumulative productivity was defined according to the equation proposed by Lôbo et al. (Citation2000):
where
is the cumulative productivity in kilograms of weaned calves per dam/year;
is the calves weight mean at weaning adjusted for 210 days of age;
is the total number of calves produced by the female;
is a constant equal to 365 days, which permits to express annual fertility;
is the age of dam at last calving, and
is a constant equal to 550 days.
The descriptive statistics for the continuous traits are summarised in and in for the categorical traits (visual scores).
Figure 1. Proportional distribution of visual scores of conformation (CS), finishing precocity (FP), muscling (MS), and size (SS) in 13,105 Nellore females.
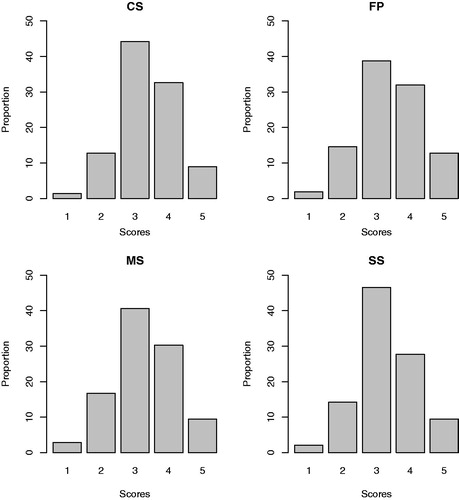
Table 1. Descriptive statistics for the traits used in both principal component and factor analysis.
Multivariate statistical analysis
Principal component and factor analyses
Principal component analysis consists of transforming an original set of random variables, , into another set of equivalent dimension,
, called principal components. This analysis seeks to redistribute the variation observed in the variables (original axes) in such a way as to obtain an orthogonal set of uncorrelated axes, trying to preserve the original variability as much as possible (Hotelling Citation1933). The components are obtained by extraction of associated eigenvalues and eigenvectors from the correlation matrix through diagonalization. This technique allows dimension reduction of the original set of variables, allowing to group similar individuals by means of two- and three-dimensional graphical representations of easy geometric interpretation (Jolliffe Citation1972, Citation1973). On the other hand, factor analysis, also used to study the patterns of relationship between variables, is based on the analysis of linear dependence to reduce the number of traits to a smaller set of hypothetical variables, called factors (Johnson and Wichern Citation1998). Both principal components and factor analysis are used to reduce the data dimensionality by extracting a new set of latent variables (i.e. principal components and factors, respectively) that account for the relevant information contained in the observed variables (Macciotta et al. Citation2006).
Only principal components with eigenvalues higher than 1 (Kaiser Citation1958) were used in graphical representations (biplots) (Gabriel Citation1971) to analyse the association between females sexual precocity with productive and reproductive traits. In addition, by using factor analysis and the Varimax rotated method (Kaiser Citation1958), the scores of animals for each extracted factor were used as response variable in an analysis of variance including sexual precocity category (precocious or non-precocious) as classificatory variable.
The trait loadings in factor analysis can be interpreted as the correlation between factors and traits (Milstein et al. Citation2005). Based on this information, discriminant traits of each factor (traits with an absolute value of correlation higher than 0.5) were identified. Subsequently, only the discriminant traits were used for interpretation of variance analysis results (Milstein et al. Citation2005).
Correspondence analysis
Correspondence analysis is an appropriate technique to analyse categorical data grouped in two-way or multi-way tables. In this method, the chi-square concept is used to standardise frequencies and to form the basis for the construction of associations. This statistical approach converts a matrix of data into a particular type of graphical representation, called perceptual map, in which rows and columns of the matrix are simultaneously represented in a reduced dimension by points on a graph. The total variability in the original data is called inertia and this variation is broken down in each axis of the perceptual map (Lebart et al. Citation1984).
Software
Data editing and multivariate statistical analysis were performed using the R software (R Development Core Team Citation2013). Prcomp and factanal functions of the stats package were used for principal component and factor analyses, respectively. Correspondence analysis was performed using the mjca function of the ca package (Nenadic and Greenacre Citation2007).
Results and discussion
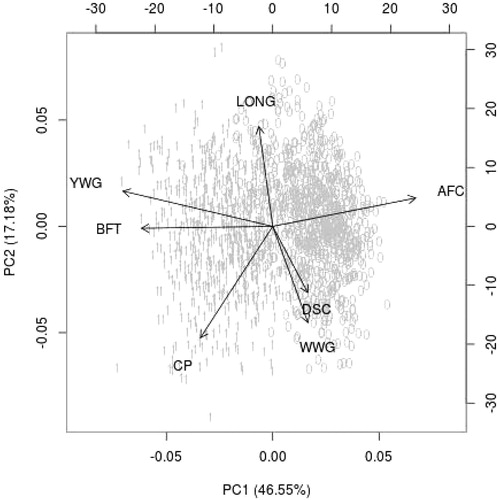
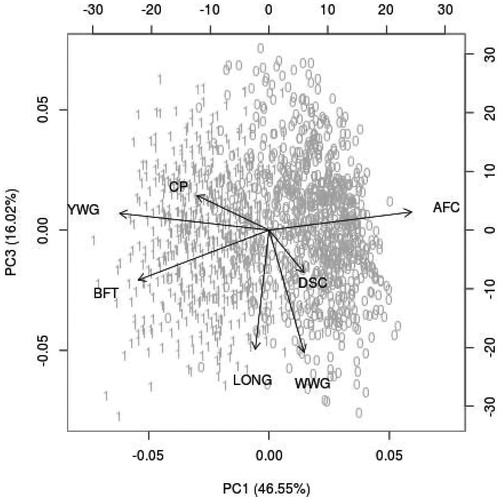
Only the first three principal components attained the Kaiser criterion (). These components explained 63.88% of the original data variability. The traits with discriminant power (traits exhibiting correlation with the components higher than 0.50) for each component were: (i) PC1: weight gain from weaning to yearling, age at first calving, and backfat thickness at yearling; (ii) PC2: longevity and cumulative productivity; (iii) PC3: weight gain from birth to weaning and longevity (). Days to second calving showed no discriminant power in any of the principal components.
Table 2. Eigenvalues (), variance percentage (VP), and cumulative variance percentage (CVP) explained by principal components.
Table 3. Correlation coeficients between traits with the three first principal components.
Traits loading signals in the principal components showed that lower age at first calving (precocious females) is related to higher weight gain from weaning to yearling and backfat thickness ( and ). These results corroborate with Short and Bellows (Citation1971) who observed that small differences in postweaning gain have an important effect on age at puberty. Additionally, Buskirk et al. (Citation1995) reported that increasing the postweaning gain of heifers favours their reproductive performance and fat thickness, confirming the dependence of female reproductive function on body fat.
Figure 2. Distribution of the precocious (1) and non-precocious (0) dams, and of the traits: weight gain from birth to weaning (WWG), weight gain from weaning to yearling (YWG), backfat thickness at yearling (BFT), age at first calving (AFC), days to second calving (DSC), cumulative productivity (CP), and longevity (LONG), considering the first two principal components (PC1 and PC2).
In factor analysis, the first three extracted factors were selected since they presented eigenvalues higher than 1. The set of traits represented by each of these factors were: (i) factor 1: weight gain from weaning to yearling, age at first calving, and backfat thickness at yearling; (ii) factor 2: weight gain from birth to weaning; (iii) factor 3: longevity (). Therefore, only these traits were used for the interpretation of the analysis of variance, which showed significant difference (p < .01) between precocious and non-precocious females for the factor 1 and the factor 3 (). Considering the average values of the discriminat traits in these two factors, the variance analysis indicated that precocious females had greater weight gain from weaning to yearling, backfat thickness at yearling and longevity and lower age at first calving than non-precocious (), corroborating with principal component analysis findings.
Table 4. Factors after rotation and its corresponding values.
Table 5. Mean of the precocious (P) and non-precocious (NP) dams for the scores in each factor and for the growth, reproduction, and production traits.
There was no evidence of association between growth rate from birth to weaning and sexual precocity (). Effects of gain from birth to weaning on reproductive traits are not expected, once the animals are strongly influenced by maternal ability during this period (Mwansa et al. Citation2002).
Cumulative productivity was not associated with any of the factors considered. The lack of association of this trait with a specific latent variable in factor analysis could be due to the fact that this trait comprises variables such as pregnancy rate, reproductive periodicity and dams productive ability (kg of calves produced during their life) (Lôbo et al. Citation2000; Azevêdo et al. Citation2005). However, principal component analysis revealed a favourable association between the anticipation of reproductive life and cumulative productivity in Nellore animals (). Furthermore, improvement of cumulative productivity may contribute to reduce the average calving interval in Nellore cattle (Grossi et al. Citation2016).
Figure 3. Distribution of the precocious dams (1) and non-precocious (0), and of the traits: weight gain from birth to weaning (WWG), weight gain from weaning to yearling (YWG), backfat thickness at yearling (BFT), age at first calving (AFC), days to second calving (DSC), cumulative productivity (CP), and longevity (LONG), considering the first and the third principal components (PC1 and PC3).
Factor analysis indicated that precocious females longevity differ significantly from non-precocious (). Precocious females have more time for body recovery after first calving than non-precocious, since at the begining of the second breeding season they have already weaned their calves. From a physiological point of view, this practice can increase the probability of these females to become pregnant in the subsequent breeding season. Reviews of Day and Nogueira (Citation2013) and Diskin and Kenny (Citation2014), indicated that beef heifers conceiving at early age and at the begining of their first breeding season, tend to calve earlier in subsequent years and to remain longer in the herd than those conceiving later. Moreover, both events, puberty and its time of occurrence during the first breeding season will affect beef cattle productivity and profitability. Similarly, Terakado et al. (Citation2015), working with Nellore breed, observed that sexually precocious females remain in the herd for a longer period compared with non-precocious.
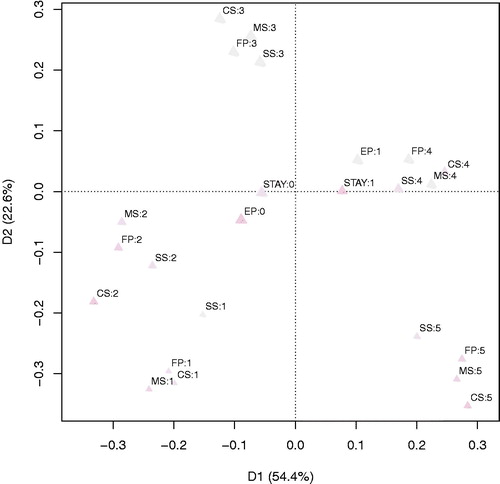
The two most important dimension of the perceptual map generated in the correspondence analysis () explained 77% of the original variation contained in the categorical phenotypes, and exhibited that female sexual precocity category or early pregnancy was specifically associated with the score 4 for all visual scores (conformation, finishing precocity, muscling, and size). These results indicate that precocious heifers are between intermediate (score 3) and extreme (score 5) animals. Further studies are necessary in order to determine whether yearling visual scores could be used as an indicative of animals phenotypically superior for sexual precocity. Correspondence analysis results also showed that early pregnancy was associated with score 1 (favourable) for stayability, highlighting the greater ability of sexually precocious females to remain productive in the herd compared to non-precocious (Day and Nogueira Citation2013; Diskin and Kenny Citation2014; Terakado et al. Citation2015).
Figure 4. Perceptual map, dimensions 1 and 2 (D1 and D2) and their respective inertia for the traits: early pregnancy (EP), stayability (STAY), success (1), and failure (0) scores, measured at yearling and ranging from 1 to 5, of conformation (CS), finishing precocity (FP), muscling (MS), and size (SS).
In the present study, heifer early pregnancy was associated with accelerated postweaning development (weight gain and fat deposition). Interestingly, the growth pattern of these heifers was not related to that of animals with extreme scores of conformation, finishing precocity, muscling or size at yearling. Sexually precocious females were also related to higher longevity and cumulative productivity, indicating that the anticipation of heifer reproductive life could be directly associated to herd profitability. These findings corroborate with Brumatti et al. (Citation2011), who found that sexual precocity is one of the most economically relevant traits in beef cattle. In further analysis, we intend to study the genetic relationships of the same group of traits considered here to determine whether selecting for sexual precocity could also result in favourably genetic change in these reproductive and productive traits.
Conclusions
Our results showed clear evidences that female sexual precocity phenotypic expression in Nellore cattle is favourably associated with traits related to growth rate, product quality, longevity, and productivity, suggesting that the anticipation of heifer reproductive life could benefit the whole herd production efficiency.
Funding Data
This work was supported by the Sao Paulo Research Foundation (FAPESP) [grants: #2009/16118-5 and #2013/25621-8] and by the National Council for Scientific and Technological Development (CNPq) [grant #150862/2017-2].
Acknowledgments
The authors acknowledge Gensys for providing the data.
Disclosure statement
The authors declare no conflicts of interest.
References
- Azevêdo DMMR, Martins Filho R, Lôbo RNB, Lôbo RB, Moura AAAN, Pimenta Filho EC, Malhado CHM. 2005. Produtividade acumulada (PAC) das matrizes em rebanhos nelore do norte e nordeste do Brasil. Rev Bras Zootec. 34:54–59.
- Brumatti RC, Ferraz JBS, Eler JP, Formigonni IB. 2011. Desenvolvimento de índice de seleção em gado de corte sob o enfoque de um modelo bioeconômico. Arch Zootec. 60:205–213.
- Buskirk DD, Faulkner DB, Ireland FA. 1995. Increased postweaning gain of beef heifers enhances fertility and milk production. J Anim Sci. 73:937–946.
- Day ML, Nogueira GP. 2013. Management of age at puberty in beef heifers to optimize efficiency of beef. Anim Front. 3:6–11.
- Diskin MG, Kenny DA. 2014. Optimising reproductive performance of beef cows and replacement heifers. Animal. 8:27–39.
- Gabriel KR. 1971. The biplot graphical display of matrices with applications to principal component analysis. Biometrika. 58:453–467.
- Grossi DA, Berton MP, Buzanskas ME, Chud TCS, Grupioni NV, Paz CCP, Lôbo RB, Munari DP. 2016. Genetic analysis on accumulated productivity and calving intervals in Nelore cattle. Trop Anim Health Prod. 48:207–210.
- Hotelling H. 1933. Analysis of a complex of statistical variables into principal components. J Educ Psychol. 24:417–441.
- Johnson RA, Wichern DW. 1998. Applied multivariate statistical analysis. 4th ed. Upper Saddle River (NJ): Prentice-Hall, Inc. p. 816.
- Jolliffe IT. 1972. Discarding variables in a principal component analysis. II: Artificial data. J R Stat Soc. 21:160–173.
- Jolliffe IT. 1973. Discarding variables in a principal component analysis. II: Real data. J R Stat Soc. 22:21–31.
- Kaiser HF. 1958. The varimax criterion for analytic rotation in factor analysis. Psychometrika. 23:187–200.
- Koury Filho W, Albuquerque LG, Alencar MM, Forni S, Silva JAV, Lôbo RB. 2009. Estimativas de herdabilidade e correlações para escores visuais, peso e altura ao sobreano em rebanhos da raça Nelore. Rev Bras Zootec. 38:2362–2367.
- Lebart L, Morineau A, Warwick K. 1984. Multivariate descriptive statistical analysis. New York (NY): John Wiley.
- Lôbo RB, Bezerra LA, Oliveira HN. 2000. Avaliação genética de animais jovens, touros matrizes. Ribeirão Preto, Brasil: Universidade de São Paulo/GEMAC.
- Macciotta NPP, Vicario D, Cappio-Borlino A. 2006. Use of multivariate analysis to extract latent variables related to level of production and lactation persistency in dairy cattle. J Dairy Sci. 89:3188–3194.
- Milstein A, Islam MS, Wahab MA, Kamal AHM, Dewan S. 2005. Characterization of water quality in shrimp ponds of different sizes and with different management regimes using multivariate statistical analysis. Aquacult Int. 13:501–518.
- Mwansa PB, Crews DH, Jr., Wilton JW, Kemp RA. 2002. Multiple trait selection for maternal productivity in beef cattle. J Anim Breed Genet. 119:391–399.
- Nenadic O, Greenacre M. 2007. Correspondence analysis in R, with two- and three-dimensional graphics: the CA package. J Stat Soft. 20:1–13.
- R CORE TEAM. 2013. R: A language and environment for statistical computing. Vienna, Austria: R Foundation for statistical computing. http://www.R-project.org.
- Short RE, Bellows RA. 1971. Relationships among weight gains, age at puberty and reproductive performance in heifers. J Anim Sci. 32:127.
- Terakado APN, Pereira MC, Yokoo MJ, Albuquerque LG. 2015. Evaluation of productivity of sexually precocious Nelore heifers. Animal 9:938–943.