
 ?Mathematical formulae have been encoded as MathML and are displayed in this HTML version using MathJax in order to improve their display. Uncheck the box to turn MathJax off. This feature requires Javascript. Click on a formula to zoom.
Abstracts
The factors that affect residual feed intake (RFI) of two chicken breeds (Ross as commercial and Isfahan as Iranian local breed with low and high RFI, respectively) were examined. We sequenced their liver transcriptomes using RNA-Seq while focusing on the identification of important candidate genes, which might influence RFI and growth rate. The differential gene expression analysis revealed that 121 and 279 known genes were significantly up- and down-regulated in the local breed, respectively. QTL enrichment analysis revealed that 63 down-regulated genes in the local breed were enriched in the QTL regions related to feed efficiency traits. Moreover, the functional enrichment analysis showed that the down-regulated genes in the native chickens were mainly involved in the different metabolic processes, such as carboxylic acid metabolic process and response to stress. The Differentially Expressed Genes explored between the chickens of the two breeds led to the identification of some important candidate genes for further breed improvement programmes, including RSAD2, IL15, LIPI, EGR1 and DUSP16. These findings will be a useful resource for the biological investigations of RFI-related genes in Isfahan local chickens and may provide some clues for understanding the molecular genetic mechanisms in other chicken breeds.
A global view of transcriptome differences in the liver tissues of commercial and local chicken breeds with different RFI values is obtained.
This investigation will contribute to the improvement of chicken genome annotation through the identification of novel transcripts and novel gene.
Some important candidate genes related to RFI is obtained.
highlights
Introduction
The ever-increasing population of the world and the need for food, especially proteins, have made it most essential to satisfy humans’ food requirements (Liu et al. Citation2011). In recent years, poultry has become a major protein source for humans. In the previous decade, many of the features related to the functions of chickens have been substantially improved by a genetic selection through crossing the different varieties to meet the increasing global need for chicken meat (Liu et al. Citation2011; Rekaya et al., Citation2013). As a result of this selection, different commercial breeds such as Ross have been developed for a faster growth rate and higher feed efficiency. In contrast, native chicken breeds are considered as an important reservoir of genetic traits developed over thousands of years (Pirkhezranian et al. Citation2015). There are many different native chickens in Iran. Among them, Isfahan chicken is a native and dual-purpose breed with the ability to provide both eggs and meat, which are mainly distributed in Isfahan and the neighbouring provinces (Yousefi Zonuz et al. Citation2013). Isfahan chicken has many desirable traits, such as good adaptation to the local environmental conditions, relatively low maintenance requirements and strong resistance to diseases. However, its growth rate and feed efficiency are not comparable with the commercial breeds and the genetic basis of such differences is still not well understood (Salehinasab et al. Citation2015). Therefore, it will be very valuable to unravel the genetic mechanisms underlying the differences between native and commercial chicken breeds for a quick genetic improvement of Isfahan local breed.
Management of the production cost is of the main interest in the poultry industry and the largest production cost is typically related to feed. In this line, previous researchers showed that feed conversion ratio (FCR) has the largest effect on the production cost. Therefore, there is a clear economic and environmental interest in improving animal FCR. Hence, animal breeding programmes for improving the meat production have generally focussed on improving the growth rate, conversion rate, and meat yield (Aggrey et al. Citation2010). The main criteria for assessing feed efficiency are FCR and residual feed intake (RFI). FCR is the ratio of feed intake (FI) to body weight gain (BWG). It is a widely used performance measure and a measure of a bird’s efficiency in converting feed mass into an increased body mass. This trait is not normally distributed while having no true mean and variance and cannot be improved by a direct selection (Atchley and Anderson Citation1978). Therefore, due to some inappropriate statistical features and biological reasons, FCR is not a good indicator of feed efficiency (Aggrey et al. Citation2010).
RFI is the difference between the actual and expected FIs necessary to meet the requirements of the maintenance and production of an animal over a test period. Thus, more efficient animals (with low or negative RFI) are expected to reduce FI except for performance in the same way as the animals with a high RFI do. There is a range of inter-individual differences in FI within a population, which cannot be explained and interpreted by metabolic body weight, body weight (BW), and egg mass (EG). These differences in FI are reflected in the differences in RFI (Ojano-Dirain Citation2004a). Hence, RFI that is genetically independent of body size and growth can be a better index for improving feed efficiency. Due to the phenotypic independence of metabolic BW and BWG, improving feed efficiency through RFI has been recommended in different species (Kutner et al. Citation2004).
Previous studies have demonstrated that there are some genes, which may have an important role in controlling RFI by affecting the digestive system and metabolic processes (Herd and Arthur Citation2009). Some studies have revealed that higher efficiency for converting feed into meat in animals can be caused by changes in the gene expressions of an electron transport chain. These investigations indicated that animals with higher RFI may suffer from the failure in transporting electrons/protons, which leads to reducing the efficiency of ATP production by mitochondrial genes and leaving a negative effect on FCR (Luiting et al. Citation1991; Johnson et al. Citation2003; Ojano-Dirain 2004; Iqbal et al. Citation2005). In addition, several previous studies have reported some candidate genes and QTLs involved in RFI through different methods, such as genome-wide association studies (GWAS) and gene expression profiling (Tran et al. Citation2014; Xu et al. Citation2016). However, despite these attempts (Cushman and Bohnert Citation2000), there is still not enough information on the genetic basis of RFI to establish a method for distinguishing animals with high and low RFI values. Hence, the candidate genes relating to feeding efficiency in chickens are not well understood. Gene expression profiling is one of the widely used methods for unravelling the mechanisms, which underlie complex traits such as RFI (Tizioto et al. Citation2015; Zhou Citation2015). Next-generation sequencing and RNA-Seq technology have become widely applied in recent years to provide a unique opportunity to identify the genes and pathways that are associated with complex traits and also explore the unknown genes on a global scale in all types of organisms (Bakhtiarizadeh et al. Citation2016). RNA-Seq as a powerful, precise, and highly sensitive method has revolutionised the quantitative determination of gene expressions (Wang et al. Citation2009; Ozsolak and Milos Citation2011).
Here, we used RNA sequencing to profile liver transcriptome and thereby identify the transcriptional variations and biological pathways between the two chicken breeds with different RFI values (Ross 708 and Isfahan chicken). To the best of our knowledge, this is the first study to investigate the molecular genetic mechanisms affecting the RFI values of Isfahan chickens and a commercial breed. Our findings may help explain the RFI differences of the two breeds. Moreover, the results of this study can be useful in the line-breeding programmes, which may be helpful to improve stock breeding with better RFI.
Materials and methods
Animals and RFI calculation
All of the procedures involving animals were approved by the Animal Care and Use Committee at Animal Science Research Department, Safiabad Agricultural and Natural Resources Research and Education Center where the experiment was conducted.
We used liver samples from two chicken breeds, including Ross 708 as a commercial breed with low RFI and Isfahan chicken as a local breed with high RFI. To record the individual daily feed intake (DFI) and daily BWG of each breed, 60 roosters were transferred to individual cages after being randomly selected. The chickens of both groups were raised in a birdhouse located in Safiabad Agricultural and Natural Resources Research and Education Center under similar conditions of breeding management (temperature, humidity and light). Temperature was initially set at 32 °C on d 1 and linearly decreased by 0.5 °C per day to reach a temperature of 24 °C on d 26 and kept constant thereafter, also feed and water ad libitum.
The FI and BWG were measured at 24–42 days of age. RFI is calculated as the difference between the actual and expected FI. RFI calculation requires measurement of the actual individual animal FI and individual BW. The individual BW was investigated during the experiment so as to calculate the mean BW (MBW), metabolic BW (MBW0.75) and daily BWG. Using the model, estimation of RFI index was done as follows:
where FI, RFI, MBW0.75 and BWG are the daily feed intake, RFI, metabolic body weight and daily body weight gain, respectively. In addition, b0, b1 and b2 indicate the intercept and partial regression coefficients, respectively. The linear model fit function (lm) was implemented in R to calculate the RFI estimates.
RNA extraction and sequencing
At the age of 42 days post-hatch, 10 birds were randomly selected from each breed and sacrificed. Then, 1–2 g of their liver tissues were excised from similar parts of each bird. The collected samples were immediately put in liquid nitrogen and then stored at −80 °C for further use (RNA sequencing) (Druzhyna et al. Citation2008). Total RNA was extracted from the liver samples harvested from 10 high and 10 low RFI chicken using TRIzol reagent (Invitrogen, Carlsbad, CA) based on the manufacture’s protocol.
RNA purity and concentration were monitored using Nano Drop (Thermo Scientific™ Nano Drop 2000) and gel electrophoresis. The 28S/18S ratio for the RNA samples ranged from 1.8 to 2. Three RNA samples from the same breed were pooled (by mixing together equal quantities of RNA) to generate a total of 4 pooled RNA samples (two samples in each breed) and were sent to BGI company (Shenzhen, China). Furthermore, in BGI company, RNA integrity number (RIN) was accessed through an Agilent Bio analyser 2100 system. Only the RNA samples with a RIN of larger than 7 were utilised for cDNA library construction. All the samples were subjected to a paired-end sequencing of 2 × 150 bp on the Illumina HiSeq 2000 platform (Illumina, San Diego, California, USA).
RNA-Seq data analysis
Before read alignment, the quality of raw sequence reads was checked using the FastQC program and nucleotide calls with a quality score of 28 or higher were considered very good quality (Andrews, Citation2010).
The raw reads were trimmed using Trimmomatic version 0.35 to remove the adaptors and filter the low-quality reads with the parameters:ILLUMINACLIP: adapters.fasta:2:20:10, TRAILING:20, MAXINFO:120:0.9, which balanced the read length and quality (Bolger et al. Citation2014). The quality of the raw reads was assessed prior to and after quality trimming with FastQC (version 11.2).
The processed reads were then aligned to the chicken reference genome using hierarchical indexing for spliced alignment of transcripts (HISAT2, version2.0.4) (Kim et al. Citation2015). HISAT2 is a fast and sensitive alignment programme, which is a successor to both HISAT and TopHat2 (http://ccb.jhu.edu/software/hisat2/index.shtml). The reference genome for the chicken (Galgal4) and the annotated file were obtained from the Ensembl database (http://asia.ensembl.org/info/data/ftp/index.html).
Cufflinks (version 2.2.1) supplied by the Ensembl annotation was used to perform a reference annotation-based transcript assembly for each sample (Trapnell et al. Citation2012). Gene expression quantification was performed using FPKM (fragments per kilobase of exon per million reads) value as reported in Cufflinks output. To improve the expression estimates, the genome reference sequence was supplied for sequence-specific bias correction. Moreover, to account for the differences in the library sizes, abundances of the transcripts were upper-quartile-normalized. Then, all the assembled transcripts from all the samples were merged using Cuffmerge to improve the overall quality of the assembly by merging the novel and common transcripts into a single assembly and remove artefact constructions. Finally, the DEGs (differentially expressed genes) across the two breeds were identified using Cuffdiff with FPKM upper-quartile normalisation (to improve the strength of the differential expression calls for less abundant transcripts) and according to a model, which is based on the negative binomial distribution. A false discovery rate of ≤.05 was applied to consider a gene as being differentially expressed.
Functional enrichment and annotation analyses
To identify the biological functions associated with the DEGs, the enriched gene ontology (GO) terms (BP, Biological Process) and Kyoto Encyclopedia of Genes and Genomes (KEGG) pathways were investigated using the database for annotation, visualisation and integrated discovery (DAVID, version 6.8) (Dennis et al. Citation2003). To do this, those up-regulated in the native and commercial breeds were fed into DAVID, separately. As only the annotated genes can be used by DAVID, all the novel genes were removed. A hypergeometric test was performed and the calculated p-values were corrected for multiple comparisons through Benjamini–Hochberg method with the p-value cut-off set at .05.
To analyse if any of the DEGs was genetically associated with RFI, a colocalisation analysis of these genes with QTL was performed. We first downloaded all the chicken QTLs associated with the feed efficiency traits (FI, FCR, feed efficiency and RFI) obtained from Animal QTL db (http://www.animalgenome.org/cgi-bin/QTLdb/GG/index, Release 31) (Hu et al. Citation2012). Then, the positions of the DEGs were compared with the positions of the QTLs. The genes with the start and end positions within the QTL regions were considered as successfully annotated in the QTLs. In addition, the positions of all the known protein-coding genes in the chicken genome (based on the Ensembl annotation file release 84) were compared with the positions of the QTLs. Finally, a hypergeometric enrichment test was conducted to assess the enrichment of the DEGs in the QTLs associated with the feed efficacy traits compared to all the genes in the chicken genome.
Real-time PCR (RT-PCR) validation
RT-PCR was used to technically validate the repeatability and accuracy of the DEGs identified by RNA-Seq (Yi et al. Citation2015). The RNAs isolated from the two breeds were used to construct a cDNA library using the first strand cDNA synthesis kit (Thermo Fisher co., Waltham, Massachusetts, USA) as described by the manufacturer. The RT-PCR reactions were carried out using the Roche SYBR Green PCR Kit according to the manufacturer’s instructions. Three independent technical replicates of each sample were subjected to RT-PCR analysis. RT-PCR primers were designed using Primer5.0 software. The primer sequences are provided in (Supplementary Table 1). CT-method was utilised to quantify the changes in the gene expression, whereas GAPDH served as a reference for normalisation. The CT-values for each gene under each condition were calculated using 2−ΔΔCT method. To compare the results of RT-PCR with the sequencing-based results, we transformed the mean 2−ΔΔCT value for each gene into a fold change.
Results
Phenotype measurements
To elucidate the potential mechanisms explaining the RFI differences in the chickens, we compared the two chicken breeds with different growth rates and RFI values. The DFI and average daily Gain (ADG) were measured and the RFI values were determined from these data. One hundred and twenty chickens from the two breeds (n = 60 per breed) with different RFI values were compared at 42 days of age. A summary of the phenotype measurements of these chickens is shown in Table . As expected, the MBWs of the commercial chickens (low RFI) were significantly heavier than those of the native chickens (high RFI) at the end ofthe test (p < .01), whereas the native chickens (high RFI) consumed a significantly less FI than the low-RFI birds during the test (p < .01). The difference in the mean RFI values between the high- and low-RFI chickens was highly significant (p < .001). As it can be seen in Table , the local breed had the RFI values of 13.430 ± 5.393 (g/day) compared with –11.212 ± 4/435 (g/day) for the commercial breed during 19 days (day 24–42) of the experiment.
Table 1. The average WGs and DWGs, FIs and RFIs of the local and commercial chickens.
Summary of the RNA-Seq data
Cluster analysis was performed with the CummeRbund package within the R environment (in the gene and isoform expression levels) to investigate if samples from the same breed cluster together. The results revealed that both of the breeds were grouped in distinct clusters (Supplementary Figures 2 and 3), which indicated a clear difference between the transcriptome profiles of the two breeds.
A total of four cDNA libraries were sequenced from the liver tissues of the two breeds. In addition, a total of 70,520,819 pairs of 150-bp in the length reads with an average of 17.6 million read pairs per sample were generated (Table ). Based on quality check reports, the averaged quality score of sequence reads is high and GC contents for both samples of the native and commercial chickens were 45% and 46%, respectively (Table ). After trimming the low-quality reads, more than 69 million paired reads were obtained for a comparative analysis. After aligning the clean reads with the chicken genome, ∼83% reads were successfully aligned (Table ) with ∼60% of the reads mapped to the exonic regions, ∼18% of them mapped to the intergenic regions, ∼22% of them mapped to the intronic regions, and the remaining reads mapped to the intronic/intergenic overlapping regions.
Table 2. The number of RNA-Seq reads and mapping rates of the two breeds.
Gene expression profile and differential expression analysis
The abundance of gene expression measured by the FPKM and biological replicates of both breeds exhibited a similar FPKM distribution (Supplementary Figure 1). The results of merging the assembled transcripts in the different samples by Cuffmerge depicted that a total of 14,817 genes were expressed in both breeds. Of these, 14,387 (76%) and 14,363 (76%) genes were expressed in the native and commercial breeds, respectively. Comparison of our results with the chicken annotation file (Ensembl release 84) revealed that 17,033 (90%) of the Ensembl transcript regions were presented in our data.
To characterise the transcriptional variations occurring between the liver tissues of the two breeds, we conducted a differential gene expression analysis. Out of all the genes, which were annotated in the chicken genome, 400 genes were differentially expressed based on the comparison of RNA-Seq data between the two breeds after correction for multiple testing (Figure ).
Figure 1. The volcano plot for the differentially expressed genes. Right upper dots denotes the up-regulated genes in the native breed; left upper dots denotes the up-regulated genes in the commercial breed; lower dots denotes the genes with no significant changes.
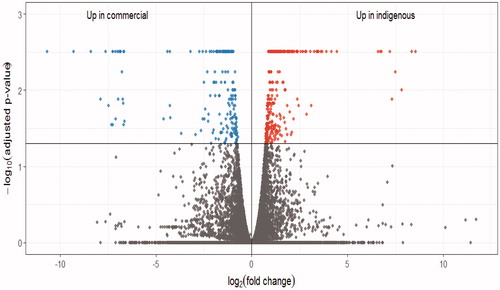
Moreover, 87 DEGs were detected within the unannotated parts of the chicken genome, which could be considered as novel genes. Out of the 400 known genes, four genes were expressed only in the local breed, whereas only one gene was expressed in the commercial breed. In addition, out of 87 novel genes, only 23 and five genes were expressed in the native and commercial breeds, respectively. The differential gene expression analysis revealed that 121 and 279 of the 400 known genes were up- and down-regulated in the local breed, respectively. Also, out of 87 novel genes, 63 and 24 genes were identified to be up- and down-regulated in the local breed, respectively. The top 10 annotated up- and down-regulated genes in the local breed are presented in Table . Moreover, a complete list of DEGs is provided in (Supplementary Table 2).
Table 3. Top 10 known up- and down-regulated genes in the local breed.
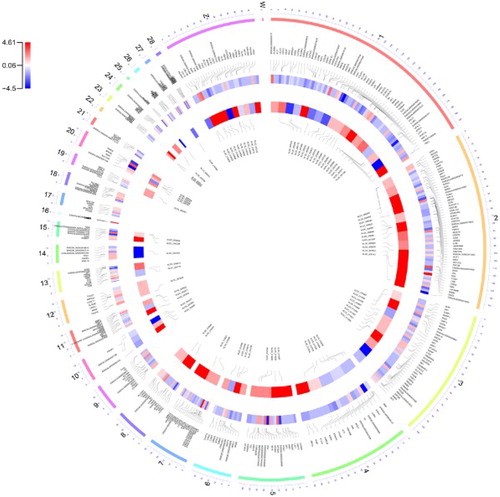
All the DEGs identified in this study were interspersed throughout the chicken genome (Figure ), thus providing supportive evidence that RFI followed a polygenic model of inheritance.
Figure 2. A circus plot showing the chromosomal distribution of the known and novel differentially expressed genes. Each circle from the periphery to the centre represents the following specifications: chromosomal location, the positions of the known genes in the genome, log2-fold change of the commercial to the native breed for the known genes, log2-fold change of the commercial to the native breed for the novel genes and their positions in the genome.
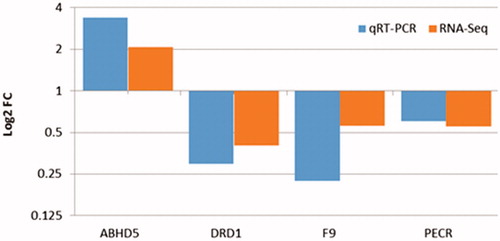
To validate the RNA-Seq expression profiles, four DEGs were randomly selected for qRT-PCR using the same RNA samples utilised for RNA-Seq. The comparative results of the Log2-fold changes predicted by RNA-Seq and qRT-PCR are shown in Figure . The qRT-PCR analysis confirmed that all the selected DEGs were differentially expressed between the two chicken breeds, suggesting that the RNA-Seq results were accurate and reproducible (Figure ).
Figure 3. Validation of the differentially expressed genes in the liver tissues of the native and commercial chickens. qRT-PCR: Quantitative Real time Polymerase chain reaction; RNA-Seq: RNA Sequencing.
Functional analysis
A functional enrichment analysis was applied to link the DEGs to the functional categories they might belong to. Analysis of gene ontology enrichment for the down-regulated genes in the local breed indicated that 102 biological processes were significantly enriched, which were mainly associated with metabolic and immune system processes (Supplementary Table 3 and Table ). Enrichment of the KEGG pathways was further performed to investigate the biological functions of these genes. The results demonstrated that the genes were significantly enriched only in one pathway (primary immunodeficiency), in which six associated genes were presented. In contrast, no significant results were found for the up-regulated genes in the local breed through the GO and pathway analysis. The functional enrichment analysis revealed that the metabolic processes and immune responses were the mainly changed processes in the liver tissues of the local breed compared to those of the commercial breed.
Table 4. Significantly enriched GO terms for the down-regulated genes in the local breed.
With the development of genome technology, many candidate QTLs and genetic markers affecting feed efficiency were reported in chicken (De-Koning et al. Citation2003; De-Koning et al. Citation2004; Hansen et al. Citation2005; Mignon-Grasteau et al. Citation2015; Jin et al. Citation2016; Xu et al. Citation2016). Here, we integrated RNA-Seq with the information from the animal QTL database to identify the potential DEGs influencing RFI. From the chicken QTL database, 211 QTLs representing four different phenotypic traits associated with feed efficiency were extracted for the present study. In this context, 2292 out of all the 18,346 Ensembl protein-coding genes were located in the 110 different QTL regions. Also, out of 303 and 184 down- and up-regulated genes in the local breed, 75 genes (on 16 different chromosomes) and 24 genes (on 11 different chromosomes) were successfully annotated into 32 and 15 different QTLs, respectively (Supplementary Table 4). Based on a hypergeometric enrichment test, the down-regulated genes in the local breed were significantly enriched in the QTLs (P = 1.79 × 10⁻⁹), inferring that these genes tended to be strongly associated with feed efficiency. Out of these 75 down-regulated genes in the local breed, seven genes were novel. Interestingly, one of these seven novel genes located on chromosome 1 was annotated by four different QTLs associated with FI. Of the 68 known down-regulated genes in the local breed, 50, 13 and 23 different genes were found in the QTL regions related to FI, feed efficiency, and FCR, respectively. The down-regulated genes in the local breed, which were localised to more than one QTL are shown in Table . Among these genes, RSAD2 (Hoque et al. Citation2009), MAOA, GPR34 and SLC9A9 (Xu et al. Citation2016), and EGR1 and IL15 (Yi et al. Citation2015), which are involved in feed efficiency and RFI or has a known role in the growth rate, were the most interesting functional candidate genes responsible for feed efficiency in chicken. In the current research, an integrated analysis with the QTL database further suggested 68 known and 7 novel genes (e.g. RSAD2, IL15, LIPI and EGR1) as the important candidates involved in RFI in chicken (Supplementary Table 4).
Table 5. List of the down-regulated genes in the local breed, which were localised in more than one QTL based on feed efficiency.
Discussion
In this study, we characterised the transcriptome profiling of liver tissue from two breeds of chickens with different RFI values using RNA-Seq technology with the primary focus on the critical genes involved in RFI. We identified important biological processes, key genes and novel transcripts associated with RFI, which can be applied to improve the understanding of the genetic mechanisms underlying the differences in RFI and growth rate in chicken. To the best of our knowledge, our study was the first report on transcriptome profiling of liver tissue in Isfahan chicken using RNA-Seq technology.
The previous studies reported a possible correlation between physical activity and RFI variation in poultry, pigs and beef cattle (Luiting and Urff Citation1991; Herd and Arthur Citation2009). Also, it is well known that the major physiological processes, including FI and digestion, metabolism, physical activity and thermoregulation have important roles in RFI variation (Luiting et al. Citation1991; Herd and Arthur Citation2009; Barea et al. Citation2010; Boschetti et al. Citation2016). In this line, our results showed that Isfahan native chickens had a slow growth rate, a higher level of physical activity and more predicted RFI (Table ) than the commercial breed. Hence, the digestibility’s of energy and nutrients seemed to be lower in the native compared with the commercial breed. In contrast, it is documented that body gain can lead to the differences of feed efficiency in birds with different RFI values (Iqbal et al. Citation2004; Ojano-Dirain et al. Citation2005; Ranjbar et al. Citation2010; Reeve and Lightowlers Citation2012). Therefore, one of the reasons for the different RFI values in Isfahan native chickens and commercial breeds could be assigned to the different body gains of these breeds.
In this study, we obtained a total of 400 known DEGs, of which 279 and 121 genes were up- and down-regulated in the commercial compared with the local breed, respectively. In addition to the known genes, we found 87 significantly differentially expressed novel genes, which could be valuable to improve chicken genome annotation. Our results demonstrated that the RNA-Seq data generated by this study were broadly representative of the chicken liver transcriptome. For example, the QTL enrichment analysis revealed that the down-regulated genes in the local breed were significantly enriched in the QTL regions of chickenfeed efficiency, which then suggested that these genes could be considered as candidate genes for further investigation. In addition, the previous studies showed the existence of several genes capable of playing significant roles in RFI variation rate by influencing metabolic processes and the digestive system (Herd and Arthur Citation2009). In agreement with the previous study (Yi et al. Citation2015), the results of GO enrichment analysis indicated that the down-regulated genes in the local breed were mainly involved in the different metabolic processes, including organic acid metabolic process, carboxylic acid metabolic process, monocarboxylic acid metabolic process, oxyacid metabolic process, small-molecule metabolic process, single-organism metabolic process, biological adhesion and response to stress. Most of these terms were related to nutrients (fatty acids, carbohydrates and proteins) and metabolism. It is well known that lipid and protein metabolisms are the important factors in feed efficiency. Interestingly, it has been reported that organic acids inhibit the competition of intestinal bacteria with the host for the available nutrients via elevating the acidic level in the digestive system and increasing the helpful bacteria in the intestine, thus resulting in reduced conversion rate and improved WG through better digestion, absorption and less waste of nutrients (lactic acid bacteria) (Dibner and Buttin Citation2002). Therefore, the higher RFI in the native compared with the commercial breed could be interpreted by the lower expression of these genes in the local breed.
Carboxylic acids are a group of organic compounds, which also contain fats. The contents of short-chain carboxylic acids in the digestive system of non-ruminants reflect the FI and production rate in their digestive systems by anaerobic microorganisms from fermentable materials. These acids perform a number of important supervisory functions in the digestive system through nerve tracts or humeral pathways and lead to the development of mucus level, cell proliferation, differentiation, production of cumin and enzymes, motility and digestion (Partanen and Mroz Citation1999; Mroz et al. Citation2006). Therefore, overexpression of the genes involved in the carboxylic acid metabolic process in the commercial compared with the local breed was in agreement with their lower RFI values. These genes could be considered as the key genes for improving RFI in the local breed.
Moreover, some of the significantly enriched GO terms were associated with fat metabolisms, such as monocarboxylic acid and oxyacid metabolic processes. Interestingly, it has been shown that there is a relationship between lipid metabolism and feed efficiency (Nafikov and Beitz Citation2007; Karisa et al. Citation2014). For example, by increasing the fat sources in a broiler diet, the FI amount is decreased and feed efficiency is improved (Firman et al. Citation2010). After absorption, lipids can be oxidised to yield ATP and consigned as a precursor for other bioactive molecules. Also, the majority of the previous studies introduced lipids as the concentrated energy sources, which can affect growth and feed efficiency. This comes into effect through some factors like the reduced passage rate of the digesta through the gastrointestinal traits, thus allowing for better nutrient absorption and utilisation (Latshaw Citation2008). Hence, one of the reasons for lower feed efficiency in the local breed could be attributed to the lower expression of these genes, which lead to an incomplete lipid metabolism.
We found 26 genes involved in the response to a cytokine, which was down-regulated in the native chickens. Cytokines are a group of proteins that are soluble in water, secreted from a variety of cells mostly in response to a stimulus, and responsible for transporting messages between cells (Hardman et al. Citation2001). Moreover, cytokines are an important component of the immune response, whereas the over-production of pro-inflammatory cytokines can lead to a negative impact on the impairment of intestinal integrity and epithelial function and subsequently reduced feed efficiency (McKay and Baird Citation1999). One of the important genes in this category is RSAD2, which is known as a lipid content modulator that affects the lipid/protein ratio in the liver (Mashaly et al. Citation2004). Up-regulation of this gene in low-RFI pig breeds was reported in the previous study, suggesting that this gene can affect RFI by regulating energy loss through lepton metabolism and fatty acids (Hoque et al. Citation2009).
In addition, in our study, 41 down-regulated genes in the local breed were identified to be important for a small-molecule metabolic process, including AOX1, CYP2R1 and CCR2. Mitochondria produce 90% of the ATP in the body and induce the formation of Reactive Oxygen Species (ROS) that can be harmful to cells when produced in excess (Adam vizi and Chinopoulos Citation2006). AOX1 is a xenobiotic metabolising protein, which plays an important role in ROS synthesis (Neumeier et al. Citation2006; Terao et al. Citation2006). When ROS are produced in excess, they may cause oxidative stress, damage proteins and DNA and initiate lipid peroxidation (Ježek and Hlavatá Citation2005). The previous studies revealed a higher production of ROS in the breast muscles of birds with higher feed efficiency (Johnson et al. Citation2003; Ojano-Dirain et al. Citation2004a; Iqbal et al. Citation2005; Krueger et al. Citation2008). This is in agreement with the results of the present study. Therefore, AOX1 causes an enhanced metabolism in the body. In this line, a difference between the metabolism of liver mitochondria and a more production of ROS in chickens and pigs with higher feed efficiency has already been reported (Bottje and Carstens Citation2009; Grubbs et al. Citation2013a, Citation2013b). In the results, AOX1 higher expression in the commercial breed was consistent with the higher RFI in this breed. This gene can be considered as an important candidate for future breeding programmes in Isfahan native chickens. CYP2R1 encodes a member of cytochrome P450 superfamily of enzymes, which catalyses many reactions involved in the metabolism and synthesis of cholesterol, steroids and other lipids. As discussed above, lipid metabolism and cholesterol biosynthesis are identified to be associated with RFI (Karisa et al. Citation2014). Furthermore, our finding was consistent with the previous report that CCR2 expression is significantly up-regulated in chicken with high feed efficiency (Zhou Citation2015).
In the present study, we detected a reduced expression of the genes associated with a single-organism metabolic process in the local breed. Some of the important genes in this category were LIPI, GUCY2C and IL15.LIPI gene (lipase I) plays a vital role in regulating the metabolism of nutrients and fats (Davis et al. Citation2015). Lipoprotein lipase activity in adipose tissue has been reported as the main factor affecting the amount of fat accumulation in carcases (Lu et al. Citation2006). On the basis of a previous study, chickens with low-feed efficiency have more abdominal fat and appear to partition the energy obtained from diet to accumulate more fat (Zhuo et al. Citation2015). Here, LIPI down-regulation in the local breed could be attributed to the lower efficiency of this breed in terms of the metabolism of nutrients and fats, which could lead to its increased RFI compared with those of the commercial chickens. GUCY2C got involved in different biological functions, such as cell signalling, molecular transport, small-molecule biochemistry and nucleic acid metabolism (Xiao et al. Citation2011). Interestingly, a previous report indicated that the mice with GUCY2C signalling deficiency have defective satiety responses after their feed intakes and as a result of overeating suffered from obesity-related disorders (Valentino et al. Citation2011). Hence, the higher FI in the native compared with the commercial breed might have been caused by GUCY2C down-regulation. Interleukin-15 (IL15) is a cytokine highly expressed in the muscle tissue. According to the cell culture experiments, it has been suggested to act as a circulating myokine that inhibits adipose tissue deposition. In addition, this gene can regulate the environmental metabolism of glucose and differentiation of fat cells (Lu et al. Citation2011). Therefore, down-regulation of this gene in the local breed could cause an increased fat deposition. This finding was also consistent with the previous study reporting more abdominal fat in the chickens with low feed efficiency as discussed above (Zhuo et al. Citation2015). The commercial breed exhibited higher expression of the genes involved in the single-organism metabolic process, which might explain why this breed had better feed efficiency than the local breed.
In addition to the discussed functional groups, we found several genes, including AGMO, FTCD, MPC1, ME1, FADS1, PLA2G4A and DIO1, which were up-regulated in the commercial breed and had related the functions to feed efficiency. There is a negative correlation between the feed conversion efficiency of poultry and their body fat depositions (Tzeng and BECKER Citation1981; Gandomani et al. Citation2014). Furthermore, RFI has been shown to have a high correlation with obesity on carcase composition in the cows of Limousine, Hereford and Charolaise (Herd and Bishop Citation2000) and with back fat in pigs (Hoque et al. Citation2007). In this line, the role of AGMO in regulating fat concentration in human and other animals by acting on the nervous system and cytokine in signal transduction has been reported (Hua et al. Citation2012). This gene is the only recognised enzyme, which breaks the alkyl-glycerol ether bond (Taguchi and Armarego Citation1998). Down-regulation of this gene in the native chickens seemed to increase their body fats and RFI values. It is well known that folic acid deficiency leads to growth retardation and poor feed efficiency in poultry (Pesti Citation1991; Sahin et al. Citation2003. Interestingly, FTCD encodes an enzyme, which links histidine catabolism to folate metabolism (Blancquaert et al. Citation2010). MPC1 is a member of the Mitochondrial Pyruvate Carrier (MPC) family, which is required for the efficient regulation of hepatic gluconeogenesis (Malone et al. Citation2007). Gluconeogenesis generates ATP to supply the necessary energy for cells (Wang et al. Citation2016). Down-regulation of MCP1 in the livers of the native chickens might be indicative of the reduced production of ATP that affected their RFI levels. The relationship between cholesterol biosynthesis and feed efficiency has been reported in the previous reports (Nafikov and Beitz Citation2007; Karisa et al. Citation2014). ME1, which is involved in the biosynthesis of cholesterol (Claire D’Andre et al. Citation2013), was identified as a down-regulated gene in the chicken breed with higher RFI. PLA2G4A gene affects fat metabolism, asteroid biosynthesis and metabolic pathways (Hamill et al. Citation2013; Yi et al. Citation2015). Changes in the expression of this gene may make a difference in the abilities of body metabolism in both high- and low-RFI breeds and lead to different levels of RFI in these breeds (Lückstädt and Mellor Citation2011). The biosynthesis of unsaturated long-chain fatty acids provides higher metabolisable energy than the saturated ones (Glaser et al. Citation2010; Lattka et al. Citation2010). FADS1 encodes the fatty acid delta-5 desaturase, a portion involved in fat metabolism pathway, which catalyses the biosynthesis of unsaturated fatty acids (Crespo and Esteve-Garcia Citation2001). It has been reported that DIO1 has a higher expression in chickens with better feed conversion efficiency, thus showing a higher body metabolism in these chickens (Aggrey et al. Citation2010). It is well known that thyroxine is the sole stimulator of metabolism. In this line, it has been reported that thyroid hormone concentration is affected by the selection for growth traits, such as body size in rats (Cartwright et al. Citation1980). As the commercial breed had a larger body size than the local breed, they seemed to probably have a higher concentration of thyroid hormones than the local breed. In contrast, dietary thyroxine (T4) can increase feed efficiency and growth characteristics in chicken (He et al. Citation2006). In addition, T4 administration at a level of 1.2 ppm has been shown to produce higher feed efficiency and a greater muscle protein synthesis in broiler chickens (Suthama et al. Citation1989). In this study, DIO1 was significantly up-regulated in the liver of the commercial compared with the local breed, which suggested that it might increase RFI in the local breed by changing thyroxin level and reducing body metabolism. Based on the above discussions, the mentioned genes may be the promising candidate genes for improving feed efficiency.
We also found some of the up-regulated genes in the local breed, such as ABCG5, ABCB1LB, PECR, IGF2BP1, PHKA1, DUSP16, PECR, FADS6 and MUT genes. For instance, PECR (Peroxisomal Trans-2-Enoyl-CoA Reductase) is an enzyme, which can shorten very long-chain fatty acids (Gorgas et al. Citation2006). Hence, it seems that the high expression of this gene leads to the metabolism of fats and the production of energy and heat. Given the slow growths and high physical activities of the native chickens, most of these energies seemed to be wasted. Consistently, it has been shown that the synthesis of fats (anabolism) in low-RFI birds is higher compared with that of the high-RFI ones (Xu et al. Citation2016). PHKA1, PHKB and PHKG1 are 3 subunits of the PhK complex, which catalyse the Ca2+-related phosphorylation of glycogen phosphorylate in the skeletal muscle and stimulate the breakdown of glycogen (Nadeau et al. Citation2012). Mutations in PHKA1 cause glycogen storage disease type 9D, which is also known as X-linked muscle glycogenesis. The previous studies revealed that glycogen content in the breast muscles of chickens is negatively correlated with growth rate and breast muscle function and positively correlated with the carcase fat of birds (Le Bihan-Duval et al. Citation2001; Alnahhas et al. Citation2014). Therefore, PHKA1 overexpression in the local breed probably augmented the stored fat in the chickens’ carcases through glycogen metabolism and resulted in their lower growth rates and higher RFI values than those of the commercial breed. DUSP16 gene encodes a Mitogen-Activated Protein Kinase (MAPK) phosphatase that is a member of the protein phosphatase subfamily. MAPKs are effective in controlling FI or RFI and this effect may originate from different pathways, such as hormones and growth factors with these phosphatases being able to affect FI through the activities of receptor tyrosine kinases (Hayes et al. Citation2011). The enhanced expression of DUSP16 seems to change RFI amount through encoding a higher amount of MAPK and affecting FI amount in chickens. Therefore, the reduced expressions of these genes in the commercial breed are functionally relevant to the feed efficiency and lower RFI values in this breed.
Conclusions
Our study provided a global view of transcriptome differences in the liver tissues of two chicken breeds (commercial and local breeds) with different feed efficiencies and RFI values. We identified 400 known protein-coding genes differentially expressed in the liver tissues of the two breeds significantly. Function enrichment analysis of the DEGs revealed some of the underlying genetic mechanisms that regulate RFI in chickens. These findings will be a useful resource for the biological investigations of feed efficiency-related genes in Isfahan native chickens and may provide some clues for understanding the molecular genetic mechanisms in other chicken breeds. The results of this investigation will contribute to the improvement of chicken genome annotation through the identification of novel transcripts and novel genes.
Supplemental Material
Download (2.5 MB)Disclosure statement
The authors declare that they have no competing interests.
Additional information
Funding
Related Research Data
References
- Adam Vizi V, Chinopoulos C. 2006. Bioenergetics and the formation of mitochondrial reactive oxygen species. Trends Pharmacol Sci. 27:639–645.
- Aggrey SE, Karnuah AB, Sebastian B, Anthony NB. 2010. Genetic properties of feed efficiency parameters in meat-type chickens. Genet Sel Evol. 42:25.
- Alnahhas N, Berri C, Boulay M, Baeza E, Jégo Y, Baumard Y, Chabault M, Bihan duval L. 2014. Selecting broiler chickens for ultimate pH of breast muscle: analysis of divergent selection experiment and phenotypic consequences on meat quality, growth, and body composition traits. J Anim Sci. 92:3816–3824.
- Andrews S. 2010. FastQC: a quality control tool for high throughput sequence data. http://www.bioinformatics.babraham.ac.uk/projects/fastqc/ http://www.bioinformatics.babraham.ac.uk/projects/
- Atchley WR, Anderson D. 1978. Ratios and the statistical analysis of biological data. Syst Zool. 27:71–78.
- Bakhtiarizadeh MR, Hosseinpour B, Arefnezhad B, Shamabadi N, Salami SA. 2016. In silico prediction of long intergenic non-coding RNAs in sheep. Genome. 59:263–275.
- Barea R, Dubois S, Gilbert H, Sellier P, Van milgen J, Noblet J. 2010. Energy utilization in pigs selected for high and low residual feed intake. J Anim Sci. 88:2062–2072.
- Blancquaert D, Storozhenko S, Loizeau K, De Steur H, De Brouwer V, Viaene J, Ravanel S, Rébeillé F, Lambert W, Van Der Straeten D. 2010. Folates and folic acid: from fundamental research toward sustainable health. Crit Rev Plant Sci. 29:14–35.
- Bolger AM, Lohse M, Usadel B. 2014. Trimmomatic: a flexible trimmer for Illumina sequence data. Bioinformatics. 30:2114–2120.
- Boschetti E, Bordoni A, Meluzzi A, Castellini C, Dal-Bosco A, Sirri F. 2016. Fatty acid composition of chicken breast meat is dependent on genotype-related variation of FADS1 and FADS2 gene expression and desaturating activity. Animal. 10:700–708.
- Bottje W, Carstens G. 2009. Association of mitochondrial function and feed efficiency in poultry and livestock species. J Anim Sci. 87:E48–e63.
- Cartwright AL, Leatherwood JM, Eisen EJ. 1980. Thyroid hormones and efficiency of energy utilization in mice selected for body weight. J Nutr. 110:1262–1273.
- Crespo N, Esteve-Garcia E. 2001. Dietary fatty acid profile modifies abdominal fat deposition in broiler chickens. Poult Sci. 80:71–78.
- Cushman JC, Bohnert HJ. 2000. Genomic approaches to plant stress tolerance. Curr Opin Plant Biol. 3:117–124.
- Claire D'Andre H, Paul W, Shen X, Jia X, Zhang R, Sun L, Zhang X. 2013. Identification and characterization of genes that control fat deposition in chickens. J Anim Sci Biotechnol. 4:43.
- Davis RV, Lamont SJ, Rothschild MF, Persia ME, Ashwell CM, Schmidt CJ. 2015. Transcriptome analysis of post-hatch breast muscle in legacy and modern broiler chickens reveals enrichment of several regulators of myogenic growth. PloS One. 10:e0122525.
- De-Koning D, Haley C, Windsor D, Hocking P, Griffin H, Morris A, Vincent J, Burt D. 2004. Segregation of QTL for production traits in commercial meat-type chickens. Genet Res. 83:211–220.
- De-Koning D, Windsor D, Hocking P, Burt D, Law A, Haley C, Morris A, Vincent J, Griffin H. 2003. Quantitative trait locus detection in commercial broiler lines using candidate regions. J Anim Sci. 81:1158–1165.
- Dennis G, Sherman BT, Hosack DA, Yang J, Gao W, Lane HC, Lempicki RA. 2003. DAVID: database for annotation, visualization, and integrated discovery. Genome Biol. 4:R60.
- Dibner J, Buttin P. 2002. Use of organic acids as a model to study the impact of gut microflora on nutrition and metabolism. J Appl Poult Res. 11:453–463.
- Druzhyna NM, Wilson GL, LeDoux SP. 2008. Mitochondrial DNA repair in aging and disease. Mech Ageing Dev. 129:383–390.
- Firman JD, Leigh H, Kamyab A. 2010. Comparison of soybean oil with an animal/vegetable blend at four energy levels in broiler rations from hatch to market. Int J Poult Sci. 9:1027–1030.
- Gandomani VT, Mahdavi A, Rahmani H, Riasi A, Jahanian E. 2014. Effects of different levels of clove bud (Syzygium aromaticum) on performance, intestinal microbial colonization, jejunal morphology, and immunocompetence of laying hens fed different n-6 to n-3 ratios. Lives Sci. 167:236–248.
- Glaser C, Heinrich J, Koletzko B. 2010. Role of FADS1 and FADS2 polymorphisms in polyunsaturated fatty acid metabolism. Metab Clin Exp. 59:993–999.
- Gorgas K, Teigler A, Komljenovic D, Just WW. 2006. The ether lipid-deficient mouse: tracking down plasmalogen functions. Biochim Biophys Acta. 1763:1511–1526.
- Grubbs JK, Fritchen A, Huff-Lonergan E, Dekkers JC, Gabler NK, Lonergan SM. 2013a. Divergent genetic selection for residual feed intake impacts mitochondria reactive oxygen species production in pigs. J Anim Sci. 91:2133–2140.
- Grubbs JK, Fritchen AN, Huff-Lonergan E, Gabler NK, Lonergan SM. 2013b. Selection for residual feed intake alters the mitochondria protein profile in pigs. J Proteomics. 80:334–345.
- Hamill RM, Aslan O, Mullen AM, O'Doherty JV, McBryan J, Morris DG, Sweeney T. 2013. Transcriptome analysis of porcine M. semimembranosus divergent in intramuscular fat as a consequence of dietary protein restriction. BMC Genomics. 14:453.
- Hansen C, Yi N, Zhang YM, Xu S, Gavora J, Cheng HH. 2005. Identification of QTL for production traits in chickens. Anim Biotechnol. 16:67–79.
- Hardman J, Limbird L, Gilman A. 2001. The Pharmacological Basis of Therapeutics. New York (NY): The McGraw-Hill Companies, Inc.
- Hayes MR, Leichner TM, Zhao S, Lee GS, Chowansky A, Zimmer D, De-Jonghe BC, Kanoski SE, Grill HJ, Bence KK. 2011. Intracellular signals mediating the food intake-suppressive effects of hindbrain glucagon-like peptide-1 receptor activation. Cell Metab. 13:320–330.
- He J, Cao M, Gao F, Wang J, Hayashi K. 2006. Dietary thyroid hormone improves growth and muscle protein accumulation of black-boned chickens. Br Poult Sci. 47:567–571.
- Herd R, Arthur P. 2009. Physiological basis for residual feed intake. J Anim Sci. 87:E64–E71.
- Herd R, Bishop S. 2000. Genetic variation in residual feed intake and its association with other production traits in British Hereford cattle. Livest Prod Sci. 63:111–119.
- Hoque M, Katoh K, Suzuki K. 2009. Genetic associations of residual feed intake with serum insulin-like growth factor-I and leptin concentrations, meat quality, and carcass cross sectional fat area ratios in Duroc pigs. J Anim Sci. 87:3069–3075.
- Hoque M, Suzuki K, Kadowaki H, Shibata T, Oikawa T. 2007. Genetic parameters for feed efficiency traits and their relationships with growth and carcass traits in Duroc pigs. J Anim Breed Genet. 124:108–116.
- Hu ZL, Park CA, Wu XL, Reecy JM. 2013. Animal QTLdb: an improved database tool for livestock animal QTL/association data dissemination in the post-genome era. Nucleic Acids Res. 41:D871–D879.
- Hua T, Wu D, Ding W, Wang J, Shaw N, Liu ZJ. 2012. Studies of human 2,4-dienoyl CoA reductase shed new light on peroxisomal β-oxidation of unsaturated fatty acids. J Biol Chem. 287:28956–28965.
- Iqbal M, Pumford N, Tang Z, Lassiter K, Ojano-Dirain C, Wing T, Cooper M, Bottje W. 2005. Compromised liver mitochondrial function and complex activity in low feed efficient broilers are associated with higher oxidative stress and differential protein expression. Poult Sci. 84:933–941.
- Iqbal M, Pumford N, Tang Z, Lassiter K, Wing T, Cooper M, Bottje W. 2004. Low feed efficient broilers within a single genetic line exhibit higher oxidative stress and protein expression in breast muscle with lower mitochondrial complex activity. Poult Sci. 83:474–484.
- Ježek P, Hlavatá L. 2005. Mitochondria in homeostasis of reactive oxygen species in cell, tissues, and organism. Int J Biochem Cell Biol. 37:2478–2503.
- Jin S, Moujahid EME, Duan Z, Zheng J, Qu L, Xu G, Yang N, Chen S. 2016. Association of AMPK subunit gene polymorphisms with growth, feed intake, and feed efficiency in meat-type chickens. Poult Sci. 95:1492–1497.
- Johnson D, Ferrell C, Jenkins T. 2003. The history of energetic efficiency research: where have we been and where are we going. J Anim Sci. 81:E27–E38.
- Karisa B, Moore S, Plastow G. 2014. Analysis of biological networks and biological pathways associated with residual feed intake in beef cattle. Anim Sci J. 85:374–387.
- Kim D, Langmead B, Salzberg SL. 2015. HISAT: a fast spliced aligner with low memory requirements. Nat Methods. 12:357–360.
- Krueger W, Carstens G, Lancaster P, Slay L, Miller J, Forbes T. 2008. Relationships between residual feed intake and apparent nutrient digestibility in growing calves. J Anim Sci. 86:25.
- Kutner M, Nachtsheim C, Neter J. 2004. Applied linear regression methods. Chicago (IL): McGraw.
- Latshaw J. 2008. Daily energy intake of broiler chickens is altered by proximate nutrient content and form of the diet. Poult Sci. 87:89–95.
- Lattka E, Illig T, Koletzko B, Heinrich J. 2010. Genetic variants of the FADS1 FADS2 gene cluster as related to essential fatty acid metabolism. Curr Opin Lipidol. 21:64–69.
- Le Bihan-Duval E, Berri C, Baeza E, Millet N, Beaumont C. 2001. Estimation of the genetic parameters of meat characteristics and of their genetic correlations with growth and body composition in an experimental broiler line. Poult Sci. 80:839–843.
- Liu W, Li D, Liu J, Chen S, Qu L, Zheng J, Xu G, Yang N. 2011. A genome-wide SNP scan reveals novel loci for egg production and quality traits in white leghorn and brown-egg dwarf layers. PLoS One. 6:e28600.
- Lu H, Huang D, Ransohoff RM, Zhou L. 2011. Acute skeletal muscle injury: CCL2 expression by both monocytes and injured muscle is required for repair. FASEB J. 25:3344–3355.
- Lu L, Ji C, Luo X, Liu B, Yu S. 2006. The effect of supplemental manganese in broiler diets on abdominal fat deposition and meat quality. Anim Feed Sci Technol. 129:49–59.
- Lückstädt C, Mellor S. 2011. The use of organic acids in animal nutrition, with special focus on dietary potassium diformate under European and Austral-Asian conditions. Recent Adv Anim Nutr. 18:123–130.
- Luiting P, Schrama J, Van-der Hel W, Urff E. 1991. Metabolic differences between White Leghorns selected for high and low residual food consumption. Br Poult Sci. 32:763–782.
- Luiting P, Urff E. 1991. Optimization of a model to estimate residual feed consumption in the laying hen. Livest Prod Sci. 27:321–338.
- Malone S, Chen ZH, Bahrami AR, Walker RP, Gray JE, Leegood RC. 2007. Phospho enol pyruvate carboxykinase in arabidopsis: changes in gene expression, protein and activity during vegetative and reproductive development. Plant Cell Physiol. 48:441–450.
- Mashaly MM, Hendricks GL, Kalama MA, Gehad AE, Abbas AO, Patterson PH. 2004. Effect of heat stress on production parameters and immune responses of commercial laying hens. Poult Sci. 83:889–894.
- McKay D, Baird A. 1999. Cytokine regulation of epithelial permeability and ion transport. Gut. 44:283–289.
- Mignon-Grasteau S, Rideau N, Gabriel I, Chantry-Darmon C, Boscher MY, Sellier N, Chabault M, Bihan-Duval E, Narcy A. 2015. Detection of QTL controlling feed efficiency and excretion in chickens fed a wheat-based diet. Genet Sel Evol. 47:74.
- Mroz Z, Koopmans SJ, Bannink A, Partanen K, Krasucki W, Øverland M, Radcliffe S. 2006. Carboxylic acids as bioregulators and gut growth promoters in nonruminants. Biol Grow Anim. 4:81–133.
- Nadeau OW, Lane LA, Xu D, Sage J, Priddy TS, Artigues A, Villar MT, Yang Q, Robinson CV, Zhang Y, et al. 2012. Structure and location of the regulatory β subunits in the (αβγδ)4 phosphorylase kinase complex. J Biol Chem. 287:36651–36661.
- Nafikov RA, Beitz DC. 2007. Carbohydrate and lipid metabolism in farm animals. J Nutr. 137:702–705.
- Neumeier M, Weigert J, Schäffler A, Weiss TS, Schmidl C, Büttner R, Bollheimer C, Aslanidis C, Schölmerich J, Buechler C. 2006. Aldehyde oxidase 1 is highly abundant in hepatic steatosis and is downregulated by adiponectin and fenofibric acid in hepatocytes in vitro. Biochem Biophys Res Commun. 350:731–735.
- Ojano-Dirain C, Pumford N, Iqbal M, Wing T, Cooper M, Bottje W. 2005. Biochemical evaluation of mitochondrial respiratory chain in duodenum of low and high feed efficient broilers. Poult Sci. 84:1926–1934.
- Ojano-Dirain CP, Iqbal M, Cawthon D, Swonger S, Wing T, Cooper M, Bottje W. 2004a. Determination of mitochondrial function and site-specific defects in electron transport in duodenal mitochondria in broilers with low and high feed efficiency. Poult Sci. 83:1394–1403.
- Ojano-Dirain CP, Iqbal M, Cawthon D, Swonger S, Wing T, Cooper M, Bottje W. 2004b. Membrane potential and hydrogen peroxide production in duodenal mitochondria in broilers with low and high feed efficiency. Poult Sci. 83:1394.
- Ojano-Dirain CP et al. 2004a Andrews, S. FastQC: a quality control tool for high throughput sequence data. http://www.bioinformatics.babraham.ac.uk/projects/fastqc/ http://www.bioinformatics.babraham.ac.uk/projects/
- Ozsolak F, Milos PM. 2011. RNA sequencing: advances, challenges and opportunities. Nat Rev Genet. 12:87–98.
- Partanen KH, Mroz Z. 1999. Organic acids for performance enhancement in pig diets. Nutr Res Rev. 12:117–145.
- Pesti G. 1991. Response surface approach to studying the protein and energy requirements of laying hens. Poult Sci. 70:103–114.
- Pirkhezranian Z, Nassiri M, Tahmorespur M, Bassami M, Haghparast A. 2015. Genetic diversity and phylogenetic analysis of light chain of immunoglobulin Y in Kho-rasan native chickens. Genet 3rd Millennium. 13:3732–3737.
- Ranjbar A, Ghahremani MH, Sharifzadeh M, Golestani A, Ghazi-Khansari M, Baeeri M, Abdollahi M. 2010. Protection by pentoxifylline of malathion-induced toxic stress and mitochondrial damage in rat brain. Hum Exp Toxicol. 29:851–864.
- Reeve AK, Lightowlers R. 2012. An introduction to mitochondria. Mitochondrial Dysfunction in Neurodegenerative Disorders. Springer, London: Springer.
- Rekaya R, Sapp R, Wing T, Aggrey S. 2013. Genetic evaluation for growth, body composition, feed efficiency, and leg soundness. Poult Sci. 92:923–929.
- Sahin K, Onderci M, Sahin N, Gursu M, Kucuk O. 2003. Dietary vitamin C and folic acid supplementation ameliorates the detrimental effects of heat stress in Japanese quail. J Nutr. 133:1882–1886.
- Salehinasab M, Latifi M, Zerehdaran S, Alijani S. 2015. Genetic properties of some economic traits in Isfahan native fowl using Bayesian and REML methods. Poult Sci J. 3:143–149.
- Suthama N, Hayashi K, Toyomizu M, Tomita Y. 1989. Effect of dietary thyroxine on growth and muscle protein metabolism in broiler chickens. Poult Sci. 68:1396–1401.
- Taguchi H, Armarego WL. 1998. Glyceryl-ether monooxygenase [EC 1.14.16.5]. A microsomal enzyme of ether lipid metabolism. Med Res Rev. 18:43–89.
- Terao M, Kurosaki M, Barzago MM, Varasano E, Boldetti A, Bastone A, Fratelli M, Garattini E. 2006. Avian and canine aldehyde oxidases novel insights into the biology and evolution of molybdo-flavoenzymes. J Biol Chem. 281:19748–19761.
- Tizioto PC, Coutinho LL, Decker JE, Schnabel RD, Rosa KO, Oliveira PSN, Souza MM, Mourão GB, Tullio RR, Chaves AS, et al. 2015. Global liver gene expression differences in Nelore steers with divergent residual feed intake phenotypes. BMC Genomics. 16:242.
- Tran T-S, Narcy A, Carré B, Gabriel I, Rideau N, Gilbert H, Demeure O, Bed’Hom B, Chantry-Darmon C, Boscher M-Y, et al. 2014. Detection of QTL controlling digestive efficiency and anatomy of the digestive tract in chicken fed a wheat-based diet. Genet Sel Evol. 46:25.
- Trapnell C, Roberts A, Goff L, Pertea G, Kim D, Kelley DR, Pimentel H, Salzberg SL, Rinn JL, Pachter L. 2012. Differential gene and transcript expression analysis of RNA-seq experiments with TopHat and Cufflinks. Nat Protoc. 7:562
- Tzeng RY, BECKER WA. 1981. Growth patterns of body and abdominal fat weights in male broiler chickens. Poult Sci. 60:1101–1106.
- Valentino MA, Lin JE, Snook AE, Li P, Kim GW, Marszalowicz G, Magee MS, Hyslop T, Schulz S, Waldman SA. 2011. A uroguanylin-GUCY2C endocrine axis regulates feeding in mice. J. Clin. Invest. 121:3578–3588.
- Wang L, Xu M, Qin J, Lin SC, Lee HJ, Tsai SY, Tsai MJ. 2016. MPC1, a key gene in cancer metabolism, is regulated by COUPTFII in human prostate cancer. Oncotarget. 7:14673.
- Wang Z, Gerstein M, Snyder M. 2009. RNA-Seq: a revolutionary tool for transcriptomics. Nat Rev Genet. 10:57–63.
- Xiao R, Power R, Mallonee D, Crowdus C, Brennan K, Ao T, Pierce J, Dawson K. 2011. A comparative transcriptomic study of vitamin E and an algae-based antioxidant as antioxidative agents: investigation of replacing vitamin E with the algae-based antioxidant in broiler diets. Poult Sci. 90:136–146.
- Xu Z, Ji C, Zhang Y, Zhang Z, Nie Q, Xu J, Zhang D, Zhang X. 2016. Combination analysis of genome-wide association and transcriptome sequencing of residual feed intake in quality chickens. BMC Genomics. 17:594.
- Yi G, Yuan J, Bi H, Yan W, Yang N, Qu L. 2015. In-depth duodenal transcriptome survey in chickens with divergent feed efficiency using RNA-Seq. PLoS One. 10:e0136765.
- Yousefi Zonuz A, Alijani S, Mohammadi H, Rafat A, Daghigh-Kia H. 2013. Estimation of genetic parameters for productive and reproductive traits in Esfahan native chickens. J Livest Sci Technol. 1:34–38.
- Zhou N. 2015. Using RNA-seq to characterize the biological basis of variation in feed efficiency in broiler chickens. University of Delaware.
- Zhuo Z, Lamont SJ, Lee WR, Abasht B. 2015. RNA-Seq analysis of abdominal fat reveals differences between modern commercial broiler chickens with high and low feed efficiencies. PLoS One. 10:e0135810.