
 ?Mathematical formulae have been encoded as MathML and are displayed in this HTML version using MathJax in order to improve their display. Uncheck the box to turn MathJax off. This feature requires Javascript. Click on a formula to zoom.
Abstract
To determine the genetic architecture underlying spent hen carcase traits, especially in late laying, we used 1512 hens generated from Dongxiang Blue-Shelled and White Leghorn chickens to implement genome-wide association studies by high-density arrays. A total of 266 loci that mapped to (Gallus gallus chromosome) GGA1, GGA4 and GGA27 were detected. After linkage disequilibrium analysis, five SNPs were considered as candidate markers because they located on or near the genes CKAP2, RB1, CCKAR, NCAPG and IGF2BP1. The heritability of all carcase traits was high, and SNP effects ranged from 3.24% to 8.72%. These findings provide new insights into the genetic architecture of carcase traits in spent layer hens.
Resource population generated from two breeds were used to measure carcass traits in spent hens.
A total of 266 loci association with carcass traits located on GGA1, GGA4, and GGA27.
Five putative candidate genes CKAP2, RB1, CCKAR, NCAPG and IGFBP1 were obtained after gene annotation.
Highlights
Introduction
Carcase traits play an important role in the chicken industry and spent hen meat constitutes around 7% of all poultry meat produced around the world (Kokoszynski et al. Citation2016). Spent hens meat is a good protein source (Lee et al. Citation2003) with higher PUFA and lower cholesterol content compared with broiler meat (Suriani et al. Citation2014), having good economic values used for soups, capons or as stewing hens in China and Korea (Lee et al. Citation2003; Trindade et al. Citation2004; Yang and Sun Citation2015). Actually, the spent hen meat is difficult to merchandise or even be disposed of in most countries due to the toughness of the meat with increasing age (Semwogerere et al. Citation2018). However, with the development and application of tenderisation technology, the potential economic benefit to be gained is tremendous (Navid et al. Citation2011), much remain to be done to increase the value of spent hen meat without affecting egg performance. Knowledge of genetic underlying carcase traits can be incorporated in breeding programmes to enhance selection in chickens because high-density SNP genotypes increased accuracies of estimate breeding value (EBV) compared with pedigree-based prediction (Wolc et al. Citation2011). Hence, it is possible to select for genotypes with both high egg performance and high carcase traits using molecular-assisted selection.
Some studies have already mapped and located genomic regions or genes associated with carcase traits, and most have focused on broiler breeds (Nones et al. Citation2006; Liu et al. Citation2013). Most researchers in the field of poultry breeding focus on body weight as the body weight significantly affected carcase trait. Rowe et al. (Citation2009) showed that QTL region on GGA1, 4 and 5 associated with body weight in a broiler population at 40 days. Baron et al. (Citation2011) obtained a total of 18 QTLs related to percentage of carcase from line-cross model and half-sib model. Sasaki et al. (Citation2004) found QTL on GGA1 and 3 affecting carcase weight in an F2 population crossed from Shamo Chicken and White Plymouth Rock breed at 12 weeks of age. Nassar detected 5 QTLs (GGA1, 2, 4, 10 and 27) affecting early or late growth in the inbred lines New Hampshire and White Leghon (Nassar et al. Citation2015). Demeure et al. (Citation2013) screened dozens of QTLs (GGA1, 3, 4, 5, 7, 8, 9, 12, 18, 20, 28 and Z) association with body weight in F2 intercross between fat and lean chicken lines. Some genes like RB1 gene is reported to be responsible for carcase trait in an F2 population from a broiler line and Baier chicken (Zhang et al. Citation2011). CCKAR had specific effects on growth trait using quantitative trait loci (QTL) in a population crosses between New Hampshire and White Leghorn chicken lines (Nassar et al. Citation2015). All of the previous studies focused on broiler chicken, few reports have focused on the carcase traits at later stages, especially for spent hens over 72 weeks old, this calls for more intensive genetic studies to allow the dissection of carcase traits that would be taken full advantage of.
Genome-wide association study (GWAS) strategies are a method that has been used successfully to examine molecular mechanisms underlying some quantitative traits (Li et al. Citation2017). Our study aimed to detect the candidate region or genes that are responsible for carcase traits in spent layer hens. It was performed in an F2 resource population of a cross between White Leghorn (WL) and Dongxiang Blue-Shelled (DX) chickens with a 600 K SNP array.
Materials and methods
Birds and phenotypes
The F2 resource population developed from DX, an indigenous chicken in China, and WL, a commercial layer, was analysed for carcase traits. A total of 1512 Chickens were slaughtered at 72 weeks. All experiments were approved by Institution Animal Care and Use Committee in Jiangsu Institute of Poultry Science (permit number: JPIAE 2011–0005). Seven traits were recorded, including carcase weight (CW), eviscerated weight (EW), breast muscle weight (BMW), leg muscle weight (LMW), head weight (HW), feet weight (FW) and wing weight (WW).
Quality control and GWAS analysis
Blood samples were obtained from the wing vein, and genomic DNA was extracted by the standard phenol–chloroform method (Sahota et al. Citation2007). Genotyping was performed using a 600 K Affymetrix Axiom. Quality control was conducted using APT software (http://affymetrix.com/) before genotyping. Dish quality control (DQC) ≥ 0.82 and a call rate ≥0.97 were retained for subsequent analyses. After quality control, PLINK software (Purcell et al. Citation2007) was used to screen specific criteria. A minor allele frequency (MAF) < 0.05 and Hardy–Weinberg equilibrium (HWE) values p < 10−6 were excluded. BEAGLE v4.0 (Browning and Browning Citation2009) was used to impute genotype based on families and linkage map information, and SNPs with R2>0.5 were retained. Before association analysis, the principal component analysis was conducted in the PLINK package. Significance thresholds were computed using the simple M method (Gao et al. Citation2010) for probability levels of significant GWA. The number of independent effective SNPs was 59,308 and the threshold was 8.43 × 10⁻⁷ for significant level, respectively.
The model for GWA analysis implemented by GEMMA (Zhou and Stephens Citation2014), the formula was:, where
is a vector of phenotypic values for n individuals;
is a matrix of covariates (fixed effects with a column of 1s and the top five principal components),
is a vector of the correspondence between the coefficients, including the intercept;
is a vector of the genotypes of the SNP marker;
is the effect size of the marker;
is a vector of random individual effects; and
is a vector of random errors. The significance p value level between SNPs and phenotypes was calculated from a derived Wald test.
R software (US) was used to calculate genomic inflation factor, and to draw Manhattan and quantile–quantile (QQ) plots, and to carry out Venn analysis. Linkage disequilibrium (LD) was analysed with Haploview v4.2 (Barrett et al. Citation2005).
SNP effects and gene annotation
The heritability explained by the eligible SNPs (h2snp), SNP effects and partitioning of genomic variation by each chromosome were estimated with GCTA software (Yang et al. Citation2011). The genes nearest or harbouring significant SNPs were chosen as candidate locations. The annotated genes located in these regions were identified using Ensembl.
Results and discussion
This is the first study to detect QTL for spent layer hen carcase traits over 72 weeks old. Improving the carcase trait of the spent layer hen and applying some tenderisation technology will reduce the economic loss of the off-layer hens (Abdalla et al. Citation2013). Results of phenotypic data and genetic parameters are presented in Tables S1 and S2. Table S1 displayed that coefficients of variation ranged from 11.57% to 17.82%, which was probably because carcase traits had not been chosen as a selection index. All phenotypic data were normalised after the Box-Cox transformation. Table S2 showed that the heritability of carcase traits was high (0.50–0.77), and higher than in a previous report (Zerehdaran et al. Citation2004). Given EBV from genomic prediction would be more accuracy compared with pedigree-based prediction (Wolc et al. Citation2011, Citation2013), it is likely to believe that considerable gains would be obtained through the direct selection for each trait.
The genome-wide study detected 266 loci related to carcase traits that were located on 165.99–171.61 Mb of GGA1, 73.43–75.48 Mb of GGA4 and 3.05–3.46 Mb of GGA27 (Table S3, Figure ). There were hundreds of genes located in these regions (Figure S1). After LD analysis (Figure S2), the potential SNPs rs317496170 and rs318027552 on GGA1 near the genes RB1 and CKAP2 were evaluated as indicators for carcase traits (Tables S4 and S5). SNP effects were over 5.5%, the highest was rs318027552 with a proportion of 8.72% for WW. The mutations of the two SNPs on GGA1 caused all carcase traits to decrease (Table S6). RB1 gene is reported to be an association with body weight and bone traits (Liu et al. Citation2008), and early growth and development (Chen et al. Citation2012; Xu et al. Citation2013) in chicken. CAKP2 gene is believed to play a role in growth traits (Zhang et al. Citation2010), its expression is decreased in high weight chicken lines (Jia et al. Citation2016).
Figure 1. Manhattan plot (left) and quantile–quantile (QQ) plot (right) of the observed p values for carcase traits. In the Manhattan plots, –log10 (observed p values) of the SNPs were plotted against their genomic positions, the black lines depict the genome-wide significant (8.43 × 10⁻⁷) threshold. For the QQ plot, the x-axis indicates the expected –log10-transformed p values, and the y-axis shows the observed –log10-transformed p values. The genomic inflation factors (λ) are shown on the top left in the QQ plots.
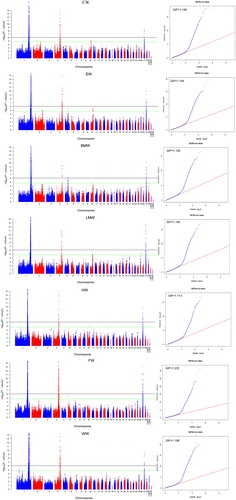
Another two blocks on GGA4, rs14491030 and rs315376630, corresponding to the genes NCAPG and CCKAR, which were another two candidate markers for carcase traits (Table S4). Mutations in the two genes increase the phenotypic values (Table S6), and SNP effects ranged 3.73%–5.14%. The function of NCAPG in chicken has been found to be associated with growth, egg weight and other growth traits (Eberlein et al. Citation2009; Lindholm-Perry et al. Citation2011; Yi et al. Citation2015), providing evidence that this gene is directly involved in carcase traits. Another SNP, rs315376630, that mapped to the CCKAR, showed a weak LD status with the missense mutation rs14910130. Studies in chickens also show that CCKAR affects body weight (Dunn et al. Citation2013) and growth performance (Nadaf et al. Citation2009; Rikimaru et al. Citation2012; Nassar et al. Citation2015). The putative function of CCKAR identifies a plausible mechanism for impacting carcase traits.
The most significant SNP on GGA27 was rs316723909, a mutation in which increases phenotypic values (Table S6), and SNP effects ranged from 3.24% to 4.78%. The nearest gene to the significant SNP rs316723909 is IGF2BP1 (Tables S1). It is known that IGF2BP1 has a role in controlling the action of IGF (Clemmons Citation1997), which are an association with breast muscle yields (Sato et al. Citation2012), and carcase traits (Tang et al. Citation2010) in chicken. Based on the aforementioned studies, it is reasonable to propose that IGFBP2 is likely to be required for the control of carcase traits.
The heritable variance in chromosomes for LMW and FW was also estimated (Figure S3). The variance attributable to GGA1 (0.261, 0.323) was higher than that of the other chromosomes, and the heritability on GGA1 of LMW and FW was higher compared with egg weight and comb length in our resource population (Yi et al. Citation2015; Shen et al. Citation2016). In particular, the genome partitioning explained by GGA4 and GGA27 were also higher than that of egg weight (Yi et al. Citation2015) and comb traits, which revealed that the carcase traits in our population may be controlled by three major QTL regions.
Although we identified several candidate genes associated with carcase traits, in consideration of the quantitative trait being controlled by polygenes and many QTLs or genes has been identified related to carcase traits of broiler chicken in previous reports, it is necessary to compile identified candidate genes to provide guidance for breeding selection. Moreover, SNP markers in the current result and previous papers are helpful to design accurate and cheap SNP chip (Herry et al. Citation2018), which provide more power and information to genomic selection strategies promoting breeding value adequate and reliable. In addition, they might be carried out as markers in increasing egg quality in layer hens, particularly for egg weight and eggshell quality, because of the same candidate genes obtained for these traits. However, experimental validation of these candidate genes or mutation association analysis with carcase traits is needed before application of in practical selection.
Conclusions
In summary, detailed statistics of GWA strategies revealed three major QTL containing 266 loci that all affected carcase traits. We confirmed two QTLs on GGA1 and GGA4 and provide further evidence that a novel region on GGA27 is related to carcase traits. Five putative candidate genes, RB1, CKAP2, NCAPG, CCKAR, and IGFBP2, were obtained. In summary, the current study provides further details on the molecular mechanisms of carcase traits for spent layer hens in late laying.
Supplemental Material
Download PDF (905.2 KB)Disclosure statement
No potential conflict of interest was reported by the authors.
Additional information
Funding
Related Research Data
References
- Abdalla HO, Ali NNA, Siddig FS, Ali SAM. 2013. Improving tenderness of spent layer hens meat using papaya leaves (Carica papaya). Pak Vet J. 33:73–76.
- Baron EE, Moura AS, Ledur MC, Pinto LF, Boschiero C, Ruy DC, Nones K, Zanella EL, Rosario MF, Burt DW, et al. 2011. QTL for percentage of carcass and carcass parts in a broiler x layer cross. Anim Genet. 42:117–124.
- Barrett JC, Fry B, Maller J, Daly MJ. 2005. Haploview: analysis and visualization of LD and haplotype maps. Bioinformatics. 21:263–265.
- Browning BL, Browning SR. 2009. A unified approach to genotype imputation and haplotype-phase inference for large data sets of trios and unrelated individuals. Amer J Hum Genet. 84:210–223.
- Chen X, Zhang H, Wang YX, Wang SZ, Cheng BH, Li H. 2012. Association of single nucleotide polymorphism of RB1 gene with body weight traits in chicken. Yi Chuan. 34:1320–1327. Chinese.
- Clemmons DR. 1997. Insulin-like growth factor binding proteins and their role in controlling IGF actions. Cytokine Growth Factor Rev. 8:45–62.
- Demeure O, Duclos MJ, Bacciu N, Le Mignon G, Filangi O, Pitel F, Boland A, Lagarrigue S, Cogburn LA, Simon J, et al. 2013. Genome-wide interval mapping using SNPs identifies new QTL for growth, body composition and several physiological variables in an F2 intercross between fat and lean chicken lines. Genet Sel Evol. 45:36. eng.
- Dunn IC, Meddle SL, Wilson PW, Wardle CA, Law AS, Bishop VR, Hindar C, Robertson GW, Burt DW, Ellison SJ, et al. 2013. Decreased expression of the satiety signal receptor CCKAR is responsible for increased growth and body weight during the domestication of chickens. Am J Physiol Endocrinol Metab. 304:E909–E921. eng.
- Eberlein A, Takasuga A, Setoguchi K, Pfuhl R, Flisikowski K, Fries R, Klopp N, Furbass R, Weikard R, Kuhn C. 2009. Dissection of genetic factors modulating fetal growth in cattle indicates a substantial role of the non-SMC condensin I complex, subunit G (NCAPG) gene. Genetics. 183:951–964. eng.
- Gao X, Becker LC, Becker DM, Starmer JD, Province MA. 2010. Avoiding the high Bonferroni penalty in genome-wide association studies. Genet Epidemiol. 34:100–105. eng.
- Herry F, Hérault F, Picarddruet D, Varenne A, Burlot T, Roy PL, Allais S. 2018. Design of a low density SNP chip for genotype imputation in layer chickens. World Congress on Genetics Applied to Livestock Production. eng. 1–6.
- Jia X, Lin H, Nie Q, Zhang X, Lamont SJ. 2016. A short insertion mutation disrupts genesis of miR-16 and causes increased body weight in domesticated chicken. Sci Rep. 6:36433. eng.
- Kokoszynski D, Bernacki Z, Steczny K, Saleh M, Wasilewski PD, Kotowicz M, Wasilewski R, Biegniewska M, Grzonkowska K. 2016. Comparison of carcass composition, physicochemical and sensory traits of meat from spent broiler breeders with broilers. Eur Poult Sci. 80:1–11. eng.
- Lee SO, Min JS, Kim IS, Lee M. 2003. Physical evaluation of popped cereal snacks with spent hen meat. Meat Sci. 64:383–390. eng.
- Li S, Wang X, Qu L, Dou T, Ma M, Shen M, Guo J, Hu Y, Wang KH. 2017. Genome-wide association studies for small intestine length in an F2 population of chickens. Ital J Anim Sci. 17:294–300.
- Lindholm-Perry AK, Sexten AK, Kuehn LA, Smith TP, King DA, Shackelford SD, Wheeler TL, Ferrell CL, Jenkins TG, Snelling WM, et al. 2011. Association, effects and validation of polymorphisms within the NCAPG - LCORL locus located on BTA6 with feed intake, gain, meat and carcass traits in beef cattle. BMC Genet. 12:103. eng.
- Liu R, Sun Y, Zhao G, Wang F, Wu D, Zheng M, Chen J, Zhang L, Hu Y, Wen J. 2013. Genome-wide association study identifies Loci and candidate genes for body composition and meat quality traits in Beijing-You chickens. PLoS One. 8:e61172. eng.
- Liu X, Zhang H, Li H, Li N, Zhang Y, Zhang Q, Wang S, Wang Q, Wang H. 2008. Fine-mapping quantitative trait loci for body weight and abdominal fat traits: effects of marker density and sample size. Poult Sci. 87:1314–1319. eng.
- Nadaf J, Pitel F, Gilbert H, Duclos MJ, Vignoles F, Beaumont C, Vignal A, Porter TE, Cogburn LA, Aggrey SE, et al. 2009. QTL for several metabolic traits map to loci controlling growth and body composition in an F2 intercross between high- and low-growth chicken lines. Physiol Genomics. 38:241–249. eng.
- Nassar MK, Goraga ZS, Brockmann GA. 2015. Quantitative trait loci segregating in crosses between New Hampshire and White Leghorn chicken lines: IV. Growth performance. Anim Genet. 46:441–446. eng.
- Navid S, Sheikhlar A, Kaveh K. 2011. Influence of the Combination of Vitamin D3 and Papaya Leaf on Meat Quality of Spent Layer Hen. Agricultural J. 6:197–200. eng.
- Nones K, Ledur M, Ruy D, Baron E, Melo C, Moura A, Zanella E, Burt D, Coutinho L. 2006. Mapping QTLs on chicken chromosome 1 for performance and carcass traits in a broiler x layer cross. Anim Genet. 37:95–100. eng.
- Purcell S, Neale B, Todd-Brown K, Thomas L, Ferreira MAR, Bender D, Maller J, Sklar P, de Bakker PIW, Daly MJ, et al. 2007. PLINK: a tool set for whole-genome association and population-based linkage analyses. Am J Hum Genet. 81:559–575. eng.
- Rikimaru K, Komatsu M, Suzuki K, Uemoto Y, Takeda H, Takahashi H. 2012. Association between cholecystokinin type A receptor haplotypes and growth traits in Japanese Hinai-dori crossbred chickens. Mol Biol Rep. 39:4479–4484. eng.
- Rowe SJ, Pong-Wong R, Haley CS, Knott SA, De Koning DJ. 2009. Detecting parent of origin and dominant QTL in a two-generation commercial poultry pedigree using variance component methodology. Genet Sel Evol. 41:6. eng.
- Sahota A, Brooks AI, Tischfield JA, King IB. 2007. Preparing DNA from blood for genotyping. CSH Protoc. 2007:pdb.prot4830. eng.
- Sasaki O, Odawara S, Takahashi H, Nirasawa K, Oyamada Y, Yamamoto R, Ishii K, Nagamine Y, Takeda H, Kobayashi E, et al. 2004. Genetic mapping of quantitative trait loci affecting body weight, egg character and egg production in F2 intercross chickens. Anim Genet. 35:188–194.
- Sato S, Ohtake T, Uemoto Y, Okumura Y, Kobayashi E. 2012. Polymorphism of insulin-like growth factor 1 gene is associated with breast muscle yields in chickens. Anim Sci J. 83:1–6. eng.
- Semwogerere F, Neethling J, Muchenje V, Hoffman LC. 2018. Effects of production systems on the carcass and meat quality characteristics of spent laying hens. Poult Sci. 97:1990–1997. eng.
- Shen M, Qu L, Ma M, Dou T, Lu J, Guo J, Hu Y, Yi G, Yuan J, Sun C, et al. 2016. Genome-Wide Association Studies for Comb Traits in Chickens. PLoS One. 11:e0159081. eng.
- Suriani NW, Purnomo H, Estiasih T, Suwetja IK. 2014. Physicochemical properties, fatty acids profile and cholesterol content of indigenous manado chicken, broiler and spent hen meat. Int JChemtech Res. 6:3896–3902. eng.
- Tang S, Sun D, Ou J, Zhang Y, Xu G, Zhang Y. 2010. Evaluation of the IGFs (IGF1 and IGF2) genes as candidates for growth, body measurement, carcass, and reproduction traits in Beijing You and Silkie chickens. Anim Biotechnol. 21:104–113. eng.
- Trindade MA, de Felicio PE, Castillo CJC. 2004. Mechanically separated meat of broiler breeder and white layer spent hens [Review]. Scientia Agricola. 61:234–239. eng.
- Wolc A, Arango J, Jankowski T, Settar P, Fulton JE, O'Sullivan NP, Fernando R, Garrick DJ, Dekkers JC. 2013. Pedigree and genomic analyses of feed consumption and residual feed intake in laying hens. Poult Sci. 92:2270–2275. eng.
- Wolc A, Stricker C, Arango J, Settar P, Fulton JE, O'Sullivan NP, Preisinger R, Habier D, Fernando R, Garrick DJ, et al. 2011. Breeding value prediction for production traits in layer chickens using pedigree or genomic relationships in a reduced animal model. Genet Sel Evol. 43:5. eng.
- Xu Z, Nie Q, Zhang X. 2013. Overview of Genomic Insights into Chicken Growth Traits Based on Genome-Wide Association Study and microRNA Regulation. Curr Genomics. 14:137–146. eng.
- Yang J, Lee S, Goddard M, Visscher P. 2011. GCTA: a tool for genome-wide complex trait analysis. Am J Hum Genet. 88:76–82. eng.
- Yang LH, Sun XS. 2015. Research Progress of Comprehensive Utilization of Spent Hens. J of Anhui Agri Sci. 292–294. chi. 43:292–294.
- Yi G, Qu L, Chen S, Xu G, Yang N. 2015. Genome-wide copy number profiling using high-density SNP array in chickens. Anim Genet. 46:148–157. eng.
- Yi G, Shen M, Yuan J, Sun C, Duan Z, Qu L, Dou T, Ma M, Lu J, Guo J, et al. 2015. Genome-wide association study dissects genetic architecture underlying longitudinal egg weights in chickens. BMC Genomics. 16:746. eng.
- Zerehdaran S, Vereijken AL, van Arendonk JA, van der Waaijt EH. 2004. Estimation of genetic parameters for fat deposition and carcass traits in broilers. Poult Sci. 83:521–525. eng.
- Zhang H, Liu SH, Zhang Q, Zhang YD, Wang SZ, Wang QG, Wang YX, Tang ZQ, Li H. 2011. Fine-mapping of quantitative trait loci for body weight and bone traits and positional cloning of the RB1 gene in chicken. J Anim Breed Genet. 128:366–375. eng.
- Zhang H, Zhang YD, Wang SZ, Liu XF, Zhang Q, Tang ZQ, Li H. 2010. Detection and fine mapping of quantitative trait loci for bone traits on chicken chromosome one. J Anim Breed Genet. 127:462–468. eng.
- Zhou X, Stephens M. 2014. Efficient multivariate linear mixed model algorithms for genome-wide association studies. Nat Methods. 11:407–409. eng.