
 ?Mathematical formulae have been encoded as MathML and are displayed in this HTML version using MathJax in order to improve their display. Uncheck the box to turn MathJax off. This feature requires Javascript. Click on a formula to zoom.
Abstract
The objective of this study was to evaluate the effect of heterosis on the lactation curve components of Girolando cattle obtained by fitting different mathematical models. Data consisted of 258,891 test day milk yield records of the first lactation from 37,965 cows of Minas Gerais State (Brazil) between 1998 and 2014. Those cows were from the Holstein breed (H), Gyr breed (G) and six genetic cross-breedings of Holstein × Gyr, (1/4H, 3/4G (1/4H); 3/8H, 5/8G (3/8H); 1/2H, 1/2G (1/2H), 5/8H, 3/8G (5/8H); 3/4H, 1/4G (3/4H); 7/8H, 1/8G (7/8H)), which is officially named as Girolando breed in Brazil. The Wood’s linear model (WDlin), Wood’s non-linear model (WDnlin), Wilmink’s model (WL) and Ali and Schaeffer’s model (ASH) were used for estimating the peak milk yield (PY), time to peak yield (PT), 305-day milk yield (TMY) and four different persistency measures (P, P2:1, P3:1 and P3:2). Regardless of the fitted model, the highest estimates of PY and TMY were for the H group. The heterosis effect was significant (p < .001) for TMY and all components of the lactation curve, except for P2:1. Girolando cattle presented a heterosis effect of 12.30% and 13.03% for PY and TMY, respectively. The magnitude of heterosis effect was larger for PT (24.18%), whereas the different persistency measures presented the smallest magnitude of heterosis values. The producers may use the different genetic groups to benefit from the heterosis mainly for the time to peak, peak yield and 305-day milk yield.HIGHLIGHTS• Girolando cows in production systems in Brazil has shown positive results. • The greater productive efficiency may be because of heterosis on the production.• Thus effect of heterosis on lactation curve can contribute to the improvement of the production system.
Introduction
In tropical countries, such as Brazil, cattle breeding is based mainly on cross-bred animals from Bos taurus taurus x Bos taurus indicus (Silva et al. Citation2015). The objective of cross-breeding is to obtain more adapted animals to tropical conditions by means of heterosis and breed complementarity (Canaza-Cayo et al. Citation2014). Thus, around the 1940’s Girolando Cattle arose when Brazilian farmers began to obtain different genetic compositions between Holstein and Gyr breeds (Facó et al. Citation2002). The individual performance of animals with different genetic compositions will depend on the prediction of the shape of the lactation curve (Pereira et al. Citation2016). The pattern of the lactation curve is very important in the study of dairy cattle (Bangar and Verma Citation2017). In general, the common pattern of lactation curves is that milk yield increases in the early stage of lactation reaches a peak yield and then decreases slowly until the end of lactation (Chang et al. Citation2001). The lactation curve presents three important components, namely milk yield at peak, time to peak yield and persistence of lactation (Wasike et al. Citation2014).
The use of mathematical models to describe the shape of lactation curves in genetic programmes allows establishing strategies to optimise selection of more efficient genotypes for the farmer in several production systems (Oliveira et al. Citation2007; Hossein-Zadeh Citation2017). In the last decade, many mathematical models were developed to describe milk yield along lactation (Wood Citation1967; Ali and Schaeffer Citation1987; Wilmink Citation1987). Those models were classified into linear and non-linear models. In linear models, the parameters are linear functions of days in milk or of their transformation, and can thus be estimated by linear regression (Torshizi et al. Citation2011). Non-linear models are non-linear in the parameters and they are more statistically and computationally demanding, due to non-linearity than their linear equivalent models (Glória et al. Citation2012). The advantage of such models is that the parameters represent the ascending or descending parts of lactation curve (Varanis et al. Citation2016), which allow attributing a biological interpretation to each parameter (Glória et al. Citation2012).
Considering that the shape of lactation curves is different between animals and breeds, obtaining the parameters of the curve is a requisite for the study of heterosis on the components of the lactation curve. The term heterosis, which was firstly described in 1914, may be defined as the increased vigour of cross-bred animals in comparison to the average performance of parental breeds (Shull Citation1948). When heterosis is correctly used it may be a bonus in the genetic gain of traditional breeding schemes of livestock species (Sorensen et al. Citation2008). In general, heterosis for total milk yield may range from 17.3% (Rege Citation1998) to 28% (Cunningham and Syrstad Citation1987) in crosses between European breeds and zebu. However, there is a lack of studies about the effect of heterosis on the components of the lactation curve.
The objective of this study was to use different models to better describe the lactation curve to evaluate the effect of heterosis on the components of the lactation curve of Girolando cows.
Materials and methods
Data
Data were from the Association of Holstein Breeders of Minas Gerais (ACGHMG), the Brazilian Association of Dairy Gyr (ABCGIL) and the Brazilian Association of Girolando (ABCG).
The data set consisted of 258,891 test day milk yield records of the first lactation from 37,965 cows of Minas Gerais State (Brazil) between 1998 and 2014. Those cows were from the Holstein breed (H), Gyr breed (G) and six genetic cross-breedings of Holstein × Gyr (1/4H, 3/4G (1/4H); 3/8H, 5/8G (3/8H); 1/2H, 1/2G (1/2H); 5/8H, 3/8G (5/8H); 3/4H, 1/4G (3/4H); 7/8H, 1/8G (7/8H)), which is officially named as Girolando breed in Brazil. A minimum of 4 and maximum of 10 test days, obtained from 5 to 305 days in milk, were considered for estimating the lactation curves by the mathematical models. Abnormal yield values or outliers were checked by graphical techniques such as normal probability plots and boxplots, as well as by median, mean, mode, skewness and kurtosis. Thus, the test day milk yield and the 305-day milk yield records were removed if milk yield were out of the range from 3 to 45 kg and from 686.07 to 11026.40 kg, respectively. The descriptive statistics of the edited data are presented in Table .
Table 1. Description of the database.
Lactation curve models
The linear and non-linear models used to fit test day milk yield along lactation of Holstein, Gyr and Girolando breeds were:
(1) Wood’s non-linear model (WDnlin) (Wood Citation1967):
(2) Wilmink’s model (WL) (Wilmink Citation1987):
(3) Wood’s linear model (WDlin) (Wood Citation1967):
In the models, Yt is the average daily yield in the tth test day of lactation; a is the initial milk yield just after calving; b is the ascending slope parameter up to the peak yield; c is the descending slope parameter and t is the length of time since calving. The constant value k for the WL model was determined in the previous analysis and fixed as 0.05.
(4) Ali and Schaeffer’s model (ASH) (Ali and Schaeffer Citation1987):
In this model, Yt is the average daily yield in the tth test day of lactation, a is associated with peak yield, b and c are associated with the decreasing slope, d and e are associated with the increasing slope. After the estimation of the parameters of each mathematical model, the mean peak yield (PY), the mean peak time (PT) and the mean persistency (P) were calculated. For persistency, the other three different measures (P2:1, P3:1 and P3:2) were also calculated as proposed by Johansoon and Hansson (Citation1940):
The different measures of persistency (P2:1, P3:1 and P3:2) use the ratios between the average milk yields obtained in different parts of lactation and all three measures were expressed as percentage.
The average predicted 305-day milk yield (TMY) was estimated for each genetic group in the respective model using the equation of Vargas et al. (Citation2000):
where TMY denotes the average predicted 305-day milk yield and y (t) is the milk yield at day t (5, 6, 7, 8, 9 …, 305) estimated by the corresponding mathematical model.
Breed and heterosis effects
The proportion of genes from the ith breed was calculated for each cow as:
where
is the proportion of genes from breed
in the progeny,
is the proportion of breed
in the sire, and
is the proportion of breed
in the dam.
Coefficients of specific heterosis in a given cross were calculated between any pair of the dairy breeds using the following identity (Dickerson Citation1973):
where
is the coefficient of expected heterosis between fractions of breeds
and
in the progeny,
and
are proportions of breeds
and
in the sire, and
and
are proportions of breed
and
in the dam.
Those specific effects of heterosis were used for the six genetic groups of Girolando because the distribution of cows across classes of coefficients of expected heterosis was suitable for this purpose (Penasa et al. Citation2010). The coefficient of general heterosis for each cow was obtained by summing coefficients of specific heterosis previously calculated.
Statistical analyses
Each model was fitted to test day milk yield records using NLIN, REG and AUTOREG procedures in SAS (Statistical Analysis System, version 9.3, Cary North Caroline, USA, 2002). The non-linear models were adjusted to the milk yield records as the iteration method of Gauss-Newton.
The models were tested for goodness of fit using the root means square error (RMSE), Akaike’s information criterion (AIC) and Bayesian information criterion (BIC).
RMSE was calculated as follows:
where RSS is the residual sum of squares, n is the number of observations (data points) and p is the number of parameters in the equation.
AIC was calculated using the following equation:
Also, BIC was calculated as follows:
Smaller numerical values of RMSE, AIC and BIC indicate the better fit when comparing the different models.
The heterosis effect of the components of the lactation curve in Girolando cattle was estimated by the MIXED procedure in SAS. The heterosis effects were obtained after fitting the following mixed linear model:
where
Results
The parameters estimated for the different genetic groups by the various non-linear and linear models, and the criteria for evaluating the quality of fit of these models, are in Tables and . WDnlin estimated positive values for the a, b and c parameters, with b and c close to zero. The WL model presented positive values for parameter a and negative values for parameters b and c in all genetic groups. In linear models, WDlin estimated positive values for the parameters a and b, and negative but near to zero for parameter c. The ASH model estimated the highest values for the parameter a when compared to the other models, negative values for b and d and values close to zero for f parameter.
Table 2. Estimated parameters (mean ± SE) from different non-linear models, root mean square error (RMSE), Bayesian information criterion (BIC) and Akaike information criterion (AIC).
Table 3. Estimated parameters (mean ± SE) from different linear models, root mean square error (RMSE), Bayesian information criterion (BIC) and Akaike information criterion (AIC).
Differences between non-linear and linear models were found based on the different fit quality tests (Tables and ). In the non-linear models (WDnlin and WL) the values of RMSE, AIC and BIC were similar and ranged from 5.77 to 6.81 when applied to test day milk yield records of different genetic groups. The WDnlin model presented the smallest values of RMSE, AIC and BIC for the 1/2H, 3/4H, 7/8H and H groups, whereas WL model presented the smallest values for 1/4H, 3/8H, 5/8H and G groups. However, in the linear models (WDlin and ASH), RMSE differed between models and groups, ranging from 0.41 to 0.51, for WDlin, and from 5.60 to 6.66, for ASH. Similarly, AIC and BIC values were different between genetic models and groups and were smaller when adjusted by the WDlin model.
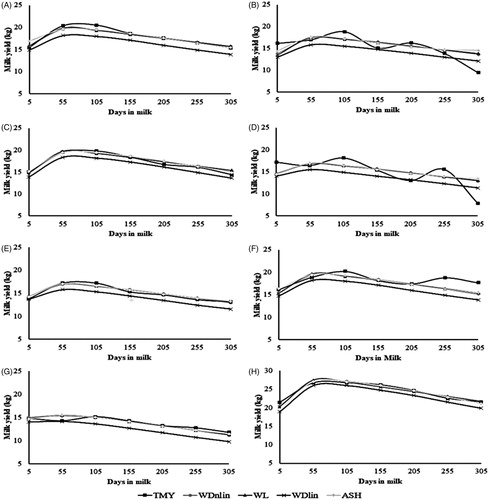
The shape of lactation curves was similar when the curves calculated by WDnlin, WL, WDlin and ASH models are compared with the mean observed test day yield records, except for the observed shapes of the curves of the 1/4H, 3/8H and 7/8H genetic groups (Figure ). The lactation curve of the genetic group H presented the best fit when the shape of the observed curve is compared with the curves calculated by WDnlin, WL and ASH models.
Figure 1. Trajectory of lactation curves estimated by 305-day milk yield from database (TMY), Wood’s linear model (WDlin), Ali and Schaeffer’s model (ASH), Wood’s non-linear model (WDnlin) and Wilmink’s (WL) model for 1/2H (A), 1/4H (B), 3/4H (C), 3/8H (D), 5/8H (E), 7/8 (F), G (G) and H (H) genetic groups.
The average values of PY, PT and TMY presented larger differences between models and genetic groups than those estimated for the different persistency measures (P, P2:1 P3:1 and P3:2) (Table ). The values of PY and TMY for the genetic groups ranged from 14.30 to 36.75 kg and from 3380.43 to 7539.26 kg, respectively, when estimated by the different models. The highest estimates of PY and TMY estimated by the WDnlin, WL and WDlin models were for the genetic group H, followed by the group 1/2H. Regardless of the model, ASH presented the higher value of PY for H group, followed by 3/4H. Similarly, the highest value of TMY estimated by ASH was also for H group, followed by 1/2H group. Independently of the model, the smaller PY and TMY were obtained for animals belonging to the genetic group G.
Table 4. Average estimates of peak yield (PY), peak time (PT), persistency (P, P2:1; P3:1, and P3:2) and 305-day milk yield (TMY) for different genetic groups estimated by linear and non-linear models.
The values of time to peak yield (PT) estimated by WDnlin, WL, WDlin and ASH for the cross-bred animals ranged from 78 to 134, from 39.5 to 114, from 65 to 124 and from 2 to 22 days in milk, respectively. The PT estimated by the various models were between 3 and 64 days in milk for Gyr and between 25 and 86 days for Holstein. .For the various combinations of genetic group and lactation curve model, the highest PT values were estimated for 1/4H (WDnlin), 1/4H (WDlin), 3/8H (WL) and H (ASH). For the same models, the smallest values for PT were obtained in the G, G, H and 5/8H genetic groups, respectively, with WDnlin, WDlin, WL and ASH models, respectively.
The persistency values estimated by WDnlin, WL and WDlin showed the lowest values of all models, ranging from 7.01 to 7.83, 5.15 to 12.00 and 6.91 to 7.76, respectively. For P2:1, P3:1 and P3:2, the estimates ranged from 90.83 to 103.51%, 79.29 to 114.64% and 85.13 to 120.53%, respectively.
In regard to the non-linear models, the heterosis effect was evaluated only by WDnlin, whose criteria of choice were based on the comparisons of the RMSE, AIC and BIC values between models (Table ). In addition, the best quality of fit of curves was obtained for the different genetic groups by fitting the WDnlin model (Figure ). The heterosis effect estimated by WDnlin was significantly different from zero (p < .001) for most traits, except for P2:1 (Table ). The heterosis effect of parameter a was positive and significantly different of zero (p < .001). For the parameters b and c, the estimates of heterosis effect were negative and significant (p < .001). The highest magnitudes of heterosis effect were observed for the PT (24.18%), followed by TMY (13.03%), parameter a (12.72%) and PY (12.30%). The lowest values of heterosis effect were observed for the different measurements of persistency, which were 0.20, 0.10, 0.55 and 0.42, for P, P2:1, P3:1 and P3:2, respectively. The lactation curves of the different genetic groups of Girolando cattle were 2.79% more persistent than the average of persistency of parental breeds.
Table 5. Heterosis effect (mean ± SE) for Wood parameters (a, b and c), peak yield (PY), peak time (PT), persistency measures (P, P2:1, P3:1, and P3:2) and 305-day milk yield (TMY) estimated by Wood’s non-linear model.
Discussion
The application of mathematical models in genetic evaluations of lactation curve depends on the accuracy of the estimates, as well as the biological interpretation of the shape of the curve (Pollott and Gootwine Citation2000). After choosing the best model to fit the lactation curve, the emphasis of selection can be focused only on the special parts of the lactation curve (Hossein-Zadeh Citation2016). However, regarding the description of the lactation curves and its components, literature studies should be analysed with caution when interpreting the results they found (Pereira et al. Citation2016), as the mathematical models are tools that may affect the genetic evaluation and, consequently, the selection of best sires and dams in genetic selection schemes (Şeahin et al. Citation2015).
First, lactation curves were described by linear and non-linear models. Then the heterosis effect on the components of the lactation curve as average milk yield at peak, average peak time and average milk yield persistency were studied. The lactation curves estimated by linear and non-linear models in the different genetic groups presented a typical pattern. Such a pattern may be attributed to the values of the estimated parameters (regression coefficients) in the models. In the Wood model (WDnlin and WDlin), typical curves were estimated when positive values were found for a, b and c parameters, with b between 0 and 1 and always higher than 0 (Vadillo et al. Citation2012). The negative values of the parameters b and/or c in this model are considered a problematic or atypical result (Pollott and Gootwine Citation2000), which makes it impractical to calculate peak yield, peak time and total milk yield (Wood Citation1967). The estimated values of the parameters in the WL model showed that the shape of the lactation curve in the different genetic groups presented a typical pattern. According to Macciotta et al. (Citation2005), when the values of the parameters b and c are negative, the lactation curve presents a typical pattern when fitted by WL model. In ASH model, a similar interpretation of the parameters is not feasible because the parameters do not present a biological interpretation (Macciotta et al. Citation2011). Graphical visualisation of the average lactation curves, fitted by ASH model in the different genetic groups, showed that the present estimated curves in this study presented a typical shape. Atypical shapes of the curve are characterised by the absence of a peak in the lactation curve (Macciotta et al. Citation2005).
As the estimation of atypical lactation curves is indicative of a decrease in the quality of fit, criteria were used to evaluate the quality of fit of linear (WDlin and ASH) and non-linear (WDnlin and WL) models. Comparisons between the values of RMSE, AIC and BIC showed that WL model presented better quality of fit for 1/4H, 3/8H, 5/8H and G groups than that of WDnlin model (Table ). However, WDnlin indicated the best fit for 1/2H, 3/4H, 7/8H and H groups. Torshizi et al. (Citation2011) and Bangar and Verma (Citation2017), using similar criteria, reported the superiority of the non-linear Wood’s model compared to Wood’s linear model when fitting test day milk yield records of Holstein and Gyr breeds, respectively. In fact, Wood’s model in the non-linear form has been considered one of the best and most popular functions to describe the lactation curve in dairy cattle (Macciotta et al. Citation2011).
Among linear models, WDlin was indicated the best fit of lactation curves of genetic groups because it presented lower values of RMSE, AIC and BIC than the values in ASH model (Table ). However, despite the indication of the best fit by criteria, the shape of the curve estimated by WDlin presented worse fit (lower precision) than the curves estimated by WDnlin, WL and ASH when compared the observed curve (Figure ).
In several studies, WDnlin, ASH and WL models were successfully used in the adjustment of individual lactation curves of dairy cattle (Macciotta et al. Citation2005; Silvestre et al. Citation2006; Torshizi et al. Citation2011). The use of these models in the adjustment of the test day milk records is the most recommended option for primiparous Holstein cows, when there is not a lack of records in a population or subpopulation (Konchagul and Yazgan Citation2008) or abrupt reduction in the number of records in certain periods of lactation (Costa et al. Citation2005). That reduced number of animals and, consequently, the low number of test day records, may explain the fact that the models did not show the best quality of fit for the 1/4H, 3/8H and 7/8H groups.
WDnlin and WL models underestimated the estimated milk yields in the first stage of the lactation curve, except for G group by WL model and 1/2H group by WDnlin and WL models (Figure ). That indicated that both models tend to underestimate test day milk yields before the peak of lactation. Torshizi et al. (Citation2011), using the same models, found that the milk yields between 5 and 100 days in milk by Wood non-linear model and between 101 and 200 days by Wilmink model were underestimated, whereas the yields were overestimated at the final stage of lactation by both models. Similarly, the overestimation of milk yields at the final stage of lactation were found for the 1/4H, 3/4H and 3/8H calculated by WL and WDnlin models which could, to some extent, be due to the small number of test day records at the end of lactation in some of the groups. Some studies also have reported the influence of the distribution of the available test day records along days in milk on the precision or quality of the adjustment of lactation curves when using Wood and Wilmink models (Silvestre et al. Citation2006; Konchagul and Yazgan Citation2008). Pollott and Gootwine (Citation2000) and Torshizi et al. (Citation2011) reported that those models overestimated the milk yields at final stage of lactation of dairy sheep and dairy cows, respectively.
The PY values estimated by ASH model in the genetic groups were higher than the values estimated by WDnlin, WL and WDlin (Table ), whereas the values estimated for PY by the WDnlin, WL and WDlin models were much closer to each other on average compared with ASH. Although ASH model may estimate higher values than the estimated by Wood and Wilmink models, it also means that it may produce negative values or too high values at the beginning or end of lactation curve (Macciotta et al. Citation2005; Silvestre et al. Citation2006). In WDnlin, WL and WDlin models, the highest values of PY were for H group, followed by 1/2H. In addition, those genetic groups presented the highest estimates for TMY, regardless of the fitted model. According to Hossein-Zadeh (Citation2017), there is a positive association between the milk yield at the peak and the cumulative milk yield at 305 days. Cows with high milk yield at the peak of lactation may present higher total milk yield at 305 days than cows with lower peak yield. It suggested that the selection of animals could be based on the milk yield at the peak of lactation (Hossein-Zadeh Citation2014).
The estimates of TMY were similar between WDnlin, WL and ASH models and between these models and the TMY values estimated by the Brazilian official model because the differences between them were lower than 4 kg in average (Table ). Among all models, WDlin estimated the lowest values (–14%) compared with the other models, which means about –660 kg in average. According to Wood (Citation1967), WDlin model tends to overestimate the yields at the first stage of lactation, as well as to underestimate the yields at the final stage of lactation. The underestimation of milk yields at final days in milk of lactation curve, in this study, could be an explanation for the lowest values of TMY for the different genetic groups.
WDnlin estimated the highest values of PT, followed by WDlin and WL. The PT values estimated by ASH model for the genetic groups were between 67% and 87%, lower than those estimated by other models, which represents from 46 to 92 days of difference. It allows inferring that ASH was not a suitable model, because it underestimated the values for the PT trait in the different genetic groups. In general, the time to peak yield (PT) estimated by WDnlin, WL and WDlin for the cross-bred animals were from 30% to 159% and 49% to 94% higher than those estimates for Holstein and Gyr, respectively. It indicates that cross-bred animals take between 21 and 49 days longer to reach the peak than pure breeds. However, ASH model estimated values for cross-bred animals, which were 85% lower than the 43 days for Holstein but was close to the 3 days estimated for the Gyr breed.
There are not many studies comparing the time to peak of Holstein, Gyr and cross-bred Holstein × Gyr animals in the literature. Some studies reported the time to peak between 60 and 90 days for Holstein (Torshizi et al. Citation2011), around 60 days for Gyr (Herrera et al. Citation2008) and from 26 to 56.5 for the Holstein × Gyr cross-bred animals (Glória et al. Citation2010; Jacopini et al. Citation2016). In fact, the literature is not clear about whether the time to peak of cross-bred animals is shorter than that of pure breeds or not. The large variation in the values of time to peak estimated for the genetic groups compared with those reported in the literature could be attributed to many factors as the model or function of estimation or the lower number of test day records (or the lack of) in the first stage of lactation, which, in consequence, affects the shape of lactation curve (Oliveira et al. Citation2007; Glória et al. Citation2010; Torshizi et al. Citation2011). Besides, such metabolic and behaviour effects, as well as age and weight of animals may also affect the results (Borges et al. Citation2015).
The fact is that the shape of the lactation curve, as well as the day in milk, may affect the results of different measures of persistency. Therefore, the choice of the best persistency measure will depend on the model used for fit the lactation curves.
The differences of persistency values between the models within the same genetic groups were in the average of 3 kg for the majority of the estimated values, considering P, P2:1, P3:1 and P3:2 measures. It means, in general, that persistency was the component of the lactation curve that showed the lower variation between models. The persistency of milk yield is one of the most important traits because cows with high persistent milk yield can maintain a high level of milk yield after the peak of lactation (Cobuci et al. Citation2003). That increase in the amount of milk yield after the peak yield could decrease the costs of production.
The values of P estimated by WDnlin and WDlin of the cross-bred genetic groups were around 1% larger than that in Holstein or Gyr group, whereas the values by WL model were in average between 1 and 6% lower than that in the pure breeds. For P3:1, P2:1, and P3:2, the persistency values of cross-bred genetic groups estimated by almost all models were between 0.9 and 3% lower than that in the Holstein group. The cross-bred animals presented values between 2 and 8% higher than that in Gyr group, except for P3:1 by WDnlin model. For the P measure of persistency, it could indicate that the cross-bred animals showed more persistency of milk yields than the pure breeds. However, the other three persistency measures indicated that cross-bred genetic groups had less persistent milk yields than Holstein, but more persistent milk yields than Gyr breed. Thus, this could suggest that there is a positive association between TMY and persistency, because Holstein breed presented higher values of 305 day milk yield and more persistency of milk yield than the cross-bred groups for almost all models. According to Gengler (Citation1996), persistency is influenced by the level of milk yield. Similarly, to this study, Hossein-Zadeh (Citation2016) reported a positive association between the different measures of persistency (P2:1, P3:1 and P3:2) and milk yield up to 305 days using different non-linear models.
Many authors have studied the heterosis effect on milk yield (Cunningham and Syrstad, Citation1987; Rege, Citation1998; Penasa et al. Citation2010). In Brazil, the heterosis effect has had an important contribution on the performance of the different genetic groups of Girolando cattle (Facó et al. Citation2002; Facó et al. Citation2008). WDnlin model was chosen to estimate the heterosis effect of all traits in the genetic groups of cross-bred cows of Girolando cattle based on the quality of fit criteria and the estimated lactation curves. Such a choice was made because WDnlin model presented a better fit quality for a larger number of animals within the genetic groups (1/2H, 3/4H, 7/8H and H), when compared with the WL model that presented better fit for the groups (1/4H, 3/8H, 5/8H and G). In addition, the WDnlin model presented better accuracy in the adjustment of the lactation curve of the different genetic groups compared with the linear model (WDlin) with better adjustment according to RMSE, AIC and BIC.
The heterosis effect was significant for TMY and the most components of lactation curves. In general, those results were expected, because the best results from the cross-bred animals are obtained when the parental pure breeds are more genetically distant. If parental breeds have different alleles or frequency of different alleles, offspring will show more heterogeneity and heterosis compared with crosses between parental breeds with similar allele frequencies (Sorensen et al. Citation2008).
There was heterosis effect of parameter a estimated by WDnlin, which is associated to the average yield along the initial stage of lactation (Oliveira et al. Citation2007). The cows of the different genetic groups of the Girolando breed presented 12.72% more milk at the beginning of lactation compared with the average of their parental breeds. In contrast, the b and c parameters of that model had a negative heterosis effect (–0.005 and –0.0006, respectively). According to Wood (Citation1967), the parameter b represents the average rate of increase in the milk yield after the peak yield and c the average rate of decline of milk yield after the peak. Although the parameter c had a negative value for the heterosis effect, it could be favourable for the farmers, milk industry and health cows. It means that a smoother decline in the milk yield after the peak yield is associated with the flatter shape of the lactation curve, that is, to the milk yield persistency. Consequently, more persistent lactating cows present a more balanced distribution of milk yield along lactation (Gengler Citation1996).
TMY and PY had expressive values of heterosis effect of 13.03% and 12.30%, respectively. The heterosis effect of TMY and PY followed the same positive association with the average yields estimated in Table . It means that the higher the TMY, the higher PY. Although the increase in the milk yield of cross-bred cows compared with the average of their parental pure breeds was an aspect of economic interest for farmers, higher peak yields are associated to metabolic disorders (Remppis et al. Citation2011). Cows with smaller PY but higher persistency are more desirable for dairy cattle (Atashi et al. Citation2013). In Brazil, it is a fact that the selection of top bulls from pure breeds has been focussed on the 305-day milk yield. Consequently, it might have influenced the heterosis effect of PY. It also could suggest that previous selection of parental breeds with higher TMY and smaller PY would bring more benefits to Girolando cattle.
Among all components of the lactation curve, the lower effect of heterosis was found for the different measurements of persistency (P, P3:1 and P3:2). That result may have occurred because cross-bred animals with a lower percentage of Holstein breed genes present shorter lactation duration when compared to the Holstein. Thus, it may have affected the lower heterosis effect of persistency.
The highest estimate of heterosis effect among all traits was for PT (24.18%). It means that cross-bred cows from the genetic groups of Girolando cattle may present a later lactation peak compared with the Holsteins. Several studies have reported that the increase of time to peak yield was followed by the increase in the 305-day milk yield of Holstein cows (Muir et al. Citation2004; Němečková et al. Citation2015). The main benefit of a longer time to reach the peak yield compared with pure breeds could be the decrease in the probability of metabolic problems caused by a high peak yield and/or an earlier time to peak. It is known that feed intake increases in the initial phase of the lactation, but peak milk yield usually occurs before the maximum feed intake is reached. Therefore, in this early stage cows must use the energy of their body storage to produce milk, and as a consequence enters in a negative energy balance (Remppis et al. Citation2011). Therefore, a later time to peak yield could decrease the magnitude of this negative energy balance, which could bring not only economic benefits for farmers but also benefits for the health and welfare of cows.
Conclusions
On the basis of criteria of goodness of fit, the results of this study showed that Wood linear model provided the best fit of lactation curve for different genetic groups. However, Wood’s non-linear model described most appropriately the lactation curve compared with the linear model.
The heterosis of 305-day milk yield is more associated to the heterosis of components of the initial stage of the lactation curve (initial milk yield, peak yield and time to peak) than that in the intermediate and final stage of lactation (persistency). It could be suggested for further studies in the genetic programmes the introduction of persistency as a criterion of selection of progenitors from pure breeds to increase persistency and 305-day milk yield in Girolando.
Ethical approval
All authors declare that this study follows the principles of the Declaration of Helsinki.
Disclosure statement
No potential conflict of interest was reported by the authors.
Related Research Data
References
- Ali TE, Schaeffer LR. 1987. Accounting for covariances among test day milk yields in dairy cows. Can J Anim Sci. 67:637–644.
- Atashi H, Zamiri MJ, Akhlaghi A, Dadpasand M, Sayyadnejad MB, Abdolmohammadi AR. 2013. Association between the lactation curve shape and calving interval in Holstein dairy cows of Iran. Iran J Vet Med. 14:88–93.
- Bangar YC, Verma MR. 2017. Non-linear modelling to describe lactation curve in Gir crossbred cows. J Anim Sci Technol. 59:3.
- Borges AM, Martins TM, Nunes PP, Ruas JRM. 2015. Reprodução de vacas mestiças: potencialidade e desafios. Rev Bras Reprod Anim. 39:155–163.
- Canaza-Cayo AW, Lopes PS, Silva MVGB, Cobuci JA, Torres RA, Martins MF, Arbex WA. 2014. Estrutura populacional da raça Girolando. Cienc Rural. 44:2072–2077.
- Chang Y, Rekaya R, Gianola D, Thomas DL. 2001. Genetic variation of lactation curves in dairy sheep: a Bayesian analysis of Wood’s function. Livest Prod Sci. 71:241–251.
- Cobuci JA, Euclydes RF, Pereira CS, Torres RA, Costa CN, Lopes PS. 2003. Persistência da lactação - uma revisão. Arch. Latinoam Prod Anim. 11:163–173.
- Costa CN, Melo CMR, Machado CHC, Freitas AF, Packer IU, Cobuci JA. 2005. Estimation of genetic parameters for test day milk records of first lactation Gyr cows using repeatability and random regression animal models. Rev Bras Zootec. 34:1519–1530.
- Cunningham EP, Syrstad O. 1987. Crossbreeding bos indicus and bos taurus for milk production in the tropics. Rome: FAO.
- Dickerson GE. 1973. Inbreeding and heterosis in animals. Proceedings of the Animal Breeding and Genetics Symposium in honor of Dr. Jay L. Lush. Am Soc Anim Sci. 54–77.
- Facó O, Lôbo RNB, Martins Filho R, Martins GA, Oliveira SMP, Azevêdo DMMR. 2008. Additive and non-additive genetic effects on productive and reproductive traits in Holstein × Gir crossbred cows. Rev Bras Zootec. 37:48–53.
- Facó O, Lôbo RNB, Martins Filho R, Moura AAA. 2002. Analysis of Productive Performance of Different Holstein × Gir Genetic Groups in Brazil. R Bras Zootec. 31:1944–1952.
- Gengler N. 1996. Persistency of lactation yields: a review. Interbull Bull. 12:97–102.
- Glória JR, Bergmann JAG, Quirino CR, Ruas JRM, Pereira JCC. 2010. Lactation curves of four genetic groups of Holstein-Zebu crossbred cows.. Rev Bras Zootec. 39:2160–2165.
- Glória JR, Bergmann JAG, Quirino CR, Ruas JRM, Pereira JCC, Reis RB, Coelho SG, Silva MA. 2012. Environmental and genetic effects on the lactation curves of four genetic groups of crossbred Holstein-Zebu cows. Rev Bras Zootec. 41:2309–2315.
- Herrera LGG, El Faro L, Albuquerque LG, Humberto T, Machado CHC. 2008. Estimates of genetic parameters for milk yield and persistency of lactation of Gyr cows, applying random regression models. Rev Bras Zootec. 37:1584–1594.
- Hossein-Zadeh GN. 2014. Comparison of non-linear models to describe the lactation curves of milk yield and composition in Iranian Holsteins. J Agric Sci. 152:309–324.
- Hossein-Zadeh GN. 2016. Modelling lactation curve for fat to protein ratio in Holstein cows. Anim Sci Pap Rep. 34:233–246.
- Hossein-Zadeh GN. 2017. Application of growth models to describe the lactation curves for test-day milk production in Holstein cows. J Appl Anim Res. 45:145–151.
- Jacopini LA, Barbosa SBP, Lourenço DAL, Silva MVGB. 2016. Productive performance of cow Girolando estimated by Wood's model adjusted by Bayesian methodology. AVS. 21:43–54.
- Johansson I, Hansson A. 1940. Causes of variation in milk and butterfat yield of dairy cows. Kungliga Lantbruksakademiens Tidskrift. 79, 1–127.
- Konchagul S, Yazgan K. 2008. Modeling first lactation of Holstein cows on herds in the southeast region of Turkey. J Anim Vet Adv. 7:830–840.
- Macciotta NPP, Dimauro C, Rassu SPG, Steri R, Pulina G. 2011. The mathematical description of lactation curves in dairy cattle. Ital J Anim Sci. 10:e51–223.
- Macciotta NPP, Vicario D, Cappio-Borlino A. 2005. Detection of different shapes of lactation curve for milk yield in dairy cattle by empirical mathematical models. J. Dairy Sci. 88:1178–1191.
- Muir BL, Fatehi J, Schaeffer LR. 2004. Genetic relationships between persistency and reproductive performance in first-lactation Canadian Holsteins. J. Dairy Sci. 87:3029–3037.
- Němečková D, Stádník L, Čítek J. 2015. Associations between milk production level, calving interval length, lactation curve parameters and economic results in Holstein cows. Mljekarstvo. 65:243–250.
- Oliveira VC, Fontes CAA, Siqueira JG, Fernandes AM, Sant‘Ana AF, Chambela Neto A. 2007. Milk production and performance of calves from Nellore and crossbred cows. Rev Bras Zootec. 36:2074–2081.
- Penasa M, López-Villalobos N, Evans RD, Cromie AR, Dal Zotto R, Cassandro M. 2010. Crossbreeding effects on milk yield traits and calving interval in spring-calving dairy cows. J Anim Breed Genet. 127:300–307.
- Pereira MA, Menezes ML, Oliveira VS, Lima MS, Carvalho CTG, Santos ADF. 2016. Lactation curves of crossbred Taurine x Zebu cows. Bol Ind Anim. 73:118–126.
- Pollott G, Gootwine E. 2000. Appropriate mathematical models for describing the complete lactation of dairy sheep. Anim Sci. 71:197–207.
- Rege JEO. 1998. Utilization of exotic germplasm for milk production in the tropics. Proceedings of the 6th World Congress on Genetics Applied to Livestock Production. Armidale. 25:193–200.
- Remppis S, Steingass H, Gruber L, Schenkel H. 2011. Effects of energy intake on performance, mobilization and retention of body tissue, and metabolic parameters in dairy cows with special regard to effects of pre-partum nutrition on lactation – a review. Asian-Australas J Anim Sci. 24:540–572.
- Şeahin A, Ulutaş Z, Arda Y, Yüksel A, Serdar G. 2015. Lactation curve and persistency of Anatolian buffaloes. Ital J Anim Sci. 14:3157–3679.
- Shull GH. 1948. What is “Heterosis?” Genetics. 33:439–446.
- Silva MVGB, Canazo-Cayo AW, Lopes OS, Cobuci JA, Martins MF, Paiva LC, Cembranelli MAR, Ferreira MBD, Panetto JCC. 2015. Genetic Breeding Program Girolando: from the progeny test to the genomic evaluations. Inf Agropec. 36:35–40.
- Silvestre AM, Petim-Batista F, Colaco J. 2006. The accuracy of seven mathematical functions in modeling dairy cattle lactation curves based on test-day records from varying sample schemes. J Dairy Sci. 89:1813–1821.
- Sorensen A, Muir DD, Knight CH. 2008. Extended lactation in dairy cows: effects of milking frequency, calving season and nutrition on lactation persistency and milk quality. J Dairy Res. 75:90–97.
- Torshizi M, Aslamenejad AA, Nassiri MR, Farhangfar H. 2011. Comparison and evaluation of mathematical lactation curve functions of Iranian primiparous Holsteins. S Afr J Anim Sci. 41:104–115.
- Vadillo JC, Jose CAV, Rodriguez MRA, Rocher C. 2012. Shapes of lactation curves of F1 (Holstein X Zebu) cows in the humid tropic of Veracruz, Mexico. Int J Anim Vet Adv. 4:370–377.
- Varanis LFM, Silva NAM, Teixeira AM. 2016. Selection of non-linear models to estimate lactation curve of crossbred cows by cluster analysis method. Cad Ciên Agrár. 8:28–37.
- Vargas B, Koops WJ, Herrero M, Van Arendonk JA. 2000. Modeling extended lactations of dairy cows. J Dairy Sci. 83:1371–1380.
- Wasike CB, Kahi AK, Peters KJ. 2014. Genetic relationship between lactation curve traits in the first three parities of dairy cattle. S Afr J Anim Sci. 44:245–253.
- Wilmink JBM. 1987. Adjustment of test-day milk, fat and protein yields for age, season and stage of lactation. Livest. Sci. 16:335–348.
- Wood PDP. 1967. Algebraic model of the lactation curve in cattle. Nature. 216:164–165.