
Abstract
The aim of this research was to evaluate as a proof of concept, a quantitative relationship between atmospheric particulate matter (PM10), atmospheric heavy metals (Pb, Ni and Cd) and Pb, Ni and Cd concentrations accumulated on bees reared in a beehive in the urban territory in Milan. For this purpose, a beehive called the Honey Factory, located in the Triennale museum area in Milano, was considered in the trial from May to October 2015. Every two days, bees found dead in the beehive were collected and the concentration of lead, cadmium and nickel on the bees bodies were evaluated through atomic absorption analysis. In the same period, data about atmospheric dust, Lead, Cadmium and Nickel, were daily downloaded by the ARPA website. The comparison between atmospheric and animal data has revealed a tight relation. Linear regressions for animals and atmosphere were calculated: when the concentration of atmospheric lead exceeded the value of 4 ng/m3, bees ‘carried’ about 0.7 mg/kg of lead. When the lead atmospheric concentration was higher than 15 ng/m3, lead on the bee’s body was more than 0.9 mg/kg (y = 0.1006x + 0.573, R2 = 0.98). A similar relationship was detected for Nickel. This study showed that heavy metals accumulated on honeybees depend on the atmospheric concentrations measured during the month before animal sampling and that PM10 pollution level seems to contribute to Pb and Ni levels detected on the animals.
Bees are environmental quality indicators.
Pb, Ni, Cd (HM) were detected on bees and in the air.
HM on bees depend on the atmospheric concentration.
Highlights
Introduction
Honeybees are very important livestock for both the economic value of their productions and their crucial role as pollinators. Recently, the number of managed honeybee colonies has declined in both North America and Europe (Oldroyd Citation2007; vanEngelsdord et al. 2011). There are several causes for this decline. The first cause is the loss of forage, as consequence of agricultural intensification (Goulson 2003; Potts et al. Citation2010; Simon-Delso et al. Citation2014); the second one is the increasing relevance of pests and diseases, affecting honeybees (Evans and Schwarz Citation2011).
The third cause is represented by the detrimental effects of environmental contaminants, as heavy metals, which are ‘captured’ by the foragers bees, who move over large areas and bring back to their hives essential materials for their own sustenance, covering an area of about 3 km and more from the beehive (Raeymaekers Citation2006).
Exposure to heavy metals and metalloids is a concern since there is widespread environmental contamination with many of these elements (Nriagu Citation1990).
Although the release of heavy metals into the environment is a natural process (Quantin et al. Citation2001; Adamo et al. Citation2003), anthropogenic sources also release high quantities into concentrated areas that are often near population centres or agricultural regions (Chabukdhara and Nema Citation2013; Besser et al. Citation2015). Heavy metals and metalloids are used in many industrial products and are components of household products, so industrial and household waste often contain significant quantities of these toxic substances (Guo et al. Citation2012; Chabukdhara and Nema Citation2013; Mehdi et al. Citation2013).
Major sources of metal and metalloid contamination are industrial processes such as metal ore and coal mining and refining, phosphate extraction for fertiliser manufacturing, and hydraulic fracturing and heavy irrigation or fertilisation of agricultural ground (Järup Citation2003; Li et al. Citation2014).
In particular, agroecosystems fertilised with repeated manures and synthetic fertilisers application can be polluted with metals (Chen et al. Citation2013; Besser et al. Citation2015) that do not decay, are characterised by latent toxicity and continuously present in the environment, entering into biological cycles (Epstein and Bassein Citation2001).
In this scenario, bees can potentially get in contact with the metal mostly through water sources and when foraging for nectar and pollen from plants, where the heavy metal had previously been accumulated (Porrini et al. Citation2003; Perugini et al. Citation2011; Van der Steen et al. Citation2012).
Heavy metals do not necessarily cause bees mortality, but it is known that they can fix on bees bodies, making them good bioindicators of environmental pollution (Cremer et al. Citation2007).
Jones (Citation1987) started discussing the ability of honey bees to monitor heavy - metal environmental pollution. Leita et al. (Citation1996) proposed the use of apiaries located near polluted areas as continuously monitoring devices of heavy metal emissions from punctual sources. Following experimental studies confirmed that adult honeybees can serve to detect temporal and spatial patterns in environmental concentrations of a wide range of heavy metals captured by the bees from all environmental compartments as vegetation, soil, air and water (Celli and Maccagnani Citation2003; Porrini et al. Citation2003).
The aim of this research, supported by the municipal district of Milano, was to evaluate the ability of honeybees as bio-accumulators, studying the relationship between the levels of measured atmospheric lead, nickel, cadmium and PM10 and heavy metals measured on bees in an urban context.
Methods
The hive
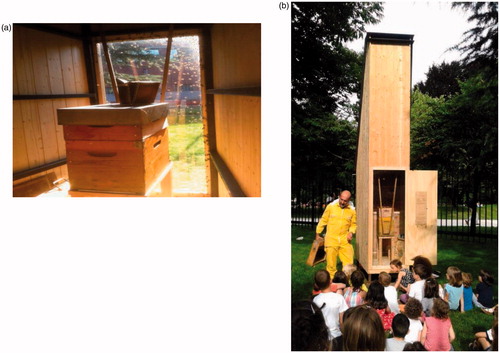
For the experimental study, a beehive located in the Triennale area museum, in Milano, was considered (Figure ). The beehive, called Honey factory, is a creation of the industrial designer Francesco Faccin. It was conceived to be an urban information point regarding the ancient and current beekeeping culture in Milano. The beehive was designed to protect the hives from bad weather, keeping a constant temperature and optimal ventilation. The big ‘chimney’ (Figure ), which is a clear symbol of the project, helps to keeps the entrance of bees as far as possible from children and possible vandalism. The so-called ‘flight ste’, that is usually placed few centimetres from the ground, is 4.5 m high, in this case. Furthermore, a glass door protects the beehives and allows bees observation from a very close distance. The honey factory was created with the purpose of educating and allowing citizens to approach the complex and fascinating world of honeybees in Milan.
Figure 1. (a,b) The beehive located in the Triennale, in Milano.
Animal sampling
Honeybees collection was performed at the beginning of May to the end of October 2015. The trial as been conducted in an ethical and responsible manner, in full compliance with all relevant codes of experimentation and legislation. Plastic gloves were used, during sampling and handling of the samples. Every ten days, the honeybees, naturally dead for the end of their life cycle, were collected within a maximum distance of 3 m from the hive. Three subsamples of at least 10 bees, to guarantee an amount of 0.5 g of tissue for each subsample to be analysed, were collected and taken to the ASL Prevention Laboratory to evaluate the concentration of Lead, Nickel and Cadmium.
Detection of heavy metals on bees: preparation of honeybees for atomic absorption
The analysis for heavy metal extraction was conducted according to the CE rules 333/2007 and CE 882/2004. For the purpose, reverse osmosis purified water (Milli-Q Millipore 18.2 M cm1 resistivity) was used. Nitric acid (HNO3), hydrogen peroxide (H2O2), and hydrochloric acid were utilised (E. Merck, Darmstadt, Germany). Standard solutions of the elements used for calibration were produced by diluting a stock solution of 1000 mg L1 of each element from Sigma Chemicals Co. (St Louis, Missouri; USA).
Procedures for sample preparation
Аn accurately weighed honeybee sample (0.5 g) was placed in PTFE vessels of a microwave digestion system and 5 mL concentrated HNO3 was added. The vessels were capped closed, tightened and placed in the rotor of a microwave oven. The digestion was carried out following the programme – 200W/5min; 0W/5min; 500W/5min. The vessels were cooled down to the room temperature. Samples were quantitatively transferred into calibrated volumetric flasks and made up to 25 mL with MilliQ water. Blank samples were passed through the whole procedure.
Atomic absorption
An atomic absorption spectrometer (AAS; Analyst 700; Perkin-Elmer, Norwalk, Connecticut, USA) equipped with Heated Graphite Atomizer (HGA) graphite furnace and deuterium background corrector was used for metal determinations. Pb, Cd and Ni were determined in graphite furnace AAS. Argon was used as inert gas for graphite furnace measurements. Pyrolytic-coated graphite tubes (Perkin Elmer Part No B3 001264; Norwalk, Connecticut, USA) with a platform were used. Samples were injected into the graphite furnace using an autosampler (model AS-800, Perkin Elmer, Norwalk, Connecticut, USA). Milestone Ethos D microwave (Sorisole, Province of Bergamo, Italy) closed system (with a maximum pressure of 1450 psi and maximum temperature of 300 °C) was used.
Detection of heavy metals in the atmosphere
In the same period, data about atmospheric levels of Lead, Cadmium, Nickel and PM10 were measured by the nearest municipal control unit ARPA through gravimetric method. Data were downloaded from the municipal ARPA website.
The reference control unit was the closest to the beehive in the range of 3 km, in Senato road, in Milano, that corresponds to the harvesting range of bees (Raeymaekers Citation2006).
The municipal control units measure particulate matter (PM10 and PM2.5) through gravimetric method, sampling dust on individual filters. Filters in PTFE were conditioned before and after particulate collection, i.e. at 20 ± 1° C, at a relative humidity of 50 ± 5%, for at least 48 h.
The difference between the two weights, before and after conditioning, corresponded to the exact value of the weight of the analysed particulate matter.
Heavy metals detection was performed on the filters for PM10 measurements by the municipal ARPA laboratories, through the same procedure used for heavy metals detection on bees (atomic absorption), described in the previous section.
Statistical analysis
Data were submitted to variance analysis (Proc GLM of the SAS statistical package 9.2, 2016) in order to evaluate the effect of the atmospheric concentrations of heavy metals (Pb, Ni and Cd) on their concentration on honeybees. For this purpose, the mean atmo-spheric pollutant concentration of the month before bees collection was considered.
Then data were processed using the Proc REG of the SAS statistical package 9.2, 2016, in order to highlight any linear relationship between the pollutants found on the bees and in the atmosphere (Pb, Ni, Cd and PM10).
For this purpose, before data processing, data of each atmospheric heavy metal were divided into concentration classes, according to concentrations peaks and data distributions.
Atmospheric Pb concentration was classified into three classes, less or equal to 4.2 µg m−3, from 4.3 µg m−3 to 10.5 µg m−3; and greater than 10.5 µg m−3.
Atmospheric Ni concentration was divided into three classes, less than 2.1 µg m−3, from 2.1 µg m−3 to 4.2 µg m−3, from 4.2 µg m−3.
Atmospheric Cd concentration was classified into three classes, less than 0.1 µg m−3, from 0.1 µg m−3 to 0.2 µg m−3, greater than 0.2 µg m−3.
Results and discussion
Environmental conditions
Environmental PM10 did not reach considerable concentrations in the considered period and it did not reach the threshold of 50 µg m−3, as shown in Figure .
Figure 2. Mean daily values of PM10 concentrations in Milano during the trial.
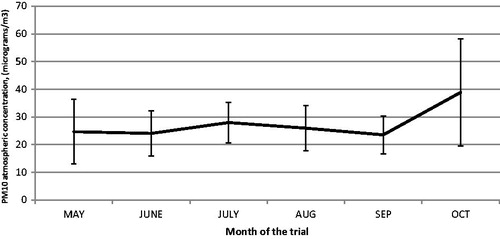
Table shows the mean values of heavy metals detected on bees through atomic absorption: Lead mean concentration on bees was 0.602 µg m−3 ± 0.293 µg m−3, Nickel 0.312 µg m−3 ± 0.145 µg m−3 and Cadmium was 0.089 µg m−3 ± 0.044 µg m−3.
Table 1. Heavy metals detected on bees.
Atmospheric heavy metals together with the respective values measured on bees during the 6 months trial are shown in Figure , in which the atmospheric metal’s concentrations are referred to the month before bees sampling. The obtained results showed that Pb (Figure ) measured on bees had the same trend as the atmospheric lead concentration detected in the previous month of bees collection. A similar trend was found for Nickel (Figure ), while Cadmium (Figure ) on bees had an undefined relationship with the respective atmospheric metal.
Figure 3. (a,b,c) Mean daily values of atmospheric Pb (a), Ni (b) and Cd (c) and heavy metals measured on bees body.
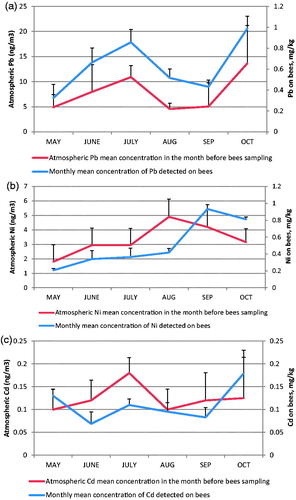
These considerations were confirmed by variance analysis, atmospheric lead concentration showed a significant effect on its values on honeybees collected and sampled in the Honey factory, (p < .01).
Ni concentration on bees resulted affected in a significant way by the atmospheric concentration of this metal (p < .05), while Cd was not significantly affected by its concentration in the air.
The Reg analyses revealed a clear linear dependence between pollutants measured in atmosphere and those found on honeybees for two of the three considered heavy metals, lead and nickel, as shown in Figure .
Figure 4. (a,b,c) Relationship between concentration of atmospheric Pb (a), Ni (b) and Cd (c) and heavy metal measured on bees.
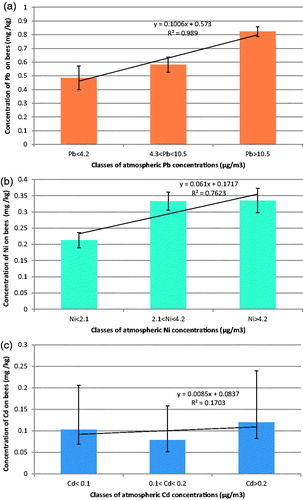
When the concentration of atmospheric lead (Figure ) exceeded the value of 4 ng m−3, bees ‘carried’ about 0.7 mg kg−1 of lead, when the lead atmospheric concentration was higher than 15 ng m−3, lead on bees body was more than 0.9 mg kg−1 (y = 0.1006x + 0.573, R2 = 0.989).
A similar relationship was also detected for Nickel concentration (Figure ), 2.1 ng m−3 of atmospheric Ni corresponded to 0.3 mg kg−1 of Ni on bees (y = 0.0621x + 0.1717, R2 = 0.762).
For Cadmium (Figure ), the obtained linear regression between atmospheric and honeybees heavy metal load did not show a relationship between the two parameters, the regression (y = 0.0085x + 0.0837, Figure ) reached a very low coefficient of determination (R2 = 0.170).
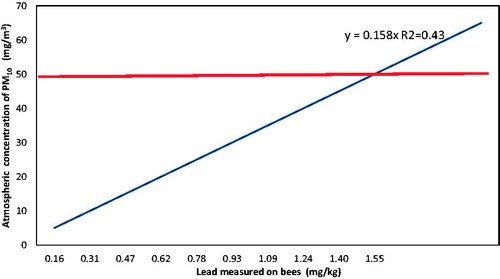
Figure . Shows the linear relationship between atmospheric PM10 concentration and Pb detected on honeybees. This relationship between PM10 and Pb on bees seems extremely interesting since it can be easily assessed that, on the basis of the presented data, atmospheric Pb affects the metals load on animal and that it is linked to PM10 concentration.
Figure 5. The linear relationship between atmospheric PM10 concentration and Pb detected on honeybees.
For the first time, atmospheric lead, nickel and cadmium concentrations were utilised to estimate their relationship with the respective heavy metals detected on honeybees.
Many studies have been performed on bees (Apis mellifera L.) as indicators for pollutants in the atmosphere (Crane Citation1984; Conti and Botrè Citation2001; Van der Steen et al. Citation2012). These experiments indicated that adult honeybees can serve to detect temporal and spatial patterns in environmental concentrations of a wide range of heavy metals captured by the bees taken up from all environmental compartments, vegetation, soil, air and water (Porrini et al. Citation2003).
Making comparisons with previous studies, Pb detected on bees showed a mean value of 0.602 mg kg−1, (0.248 mg kg−1–1.396 mg kg−1), literature provides a wide range for this metal on bees. Low values of Pb on bees were found in non-industrialised areas, as in studies by Porrini et al. (Citation2002) performed in a national park (0.15 mg kg−1–0.55 mg kg−1), by Conti and Botré (Citation2001) in non-contaminated sites (0.52 mg kg−1–1.00 mg kg-1). The lead carried by honeybees is higher for hives in industrialised areas: Van Der Steen et al. (Citation2015) in Belgium measured 0.33 mg kg−1–0.41 mg kg−1 in urban and industrial sites; in Poland (Roman Citation2005) measured 0.64 mg kg−1–1 mg kg−1 and in 2010 measured 1.46 mg kg−1–2.32 mg kg−1. Conti and Botré (Citation2001) detected 0.64–1.25 mg kg−1 of lead on urban bees (near highways); Veleminsky et al. (Citation1990) 3.68 mg kg−1–9.28 mg kg−1 in industrial areas.
In this study, the lead levels are similar to those found in literature regarding heavy metals detected on bees in urban areas. The lead level is usually linked to the anthropogenic development of these urban and industrialised areas, where the presence of Pb could be due to the resuspension of lead-contaminated soil dust.
Nickel on bees ranged from 0.116 mg kg−1 up to 0.643 mg kg−1. Porrini et al. (Citation2002) showed similar values (0.13 mg kg−1–0.43 mg kg−1), as in Poland (Roman Citation2005) (0.36 mg kg−1–0.50 mg kg−1) for bees reared in industrialised areas.
Nickel originates most of the times from the combustion of fossil fuels, source of the emission of ultrafine metal-containing particles. These airborne particles eventually deposit on vegetation, soil or surface water where bees take up heavy metals from the environment.
Our results about cadmium on bees showed low values (0.008 mg kg−1–0.195 mg kg−1), in agreement with studies conducted by Fakhimzadeh and Lodenius (2000) in Finland with 0.05 mg kg−1–1.2 mg kg−1 and Van Der Steen et al. (Citation2012) in the Netherlands. Perugini et al. (Citation2011) measured 0.05 mg kg−1–0.06 mg kg−1.
In European countries, atmospheric Cadmium is emitted around 85–90% by anthropogenic sources, mainly from fossil fuel combustion, and municipal waste incineration (Besser et al. Citation2015). A very specific study reports the Cd concentrations measured in different environmental markers i.e. rainwater: 1.4 ± 0.2 mg/mL, flowers (Trifolium pretence L.): 1.7 ± 0.3 mg/g, pollen: 2.1 ± 0.2 mg/g, sampled inside a honey bee foraging area, is in relation with the metal amount in the insect body (Leita et al. Citation1996).
The low levels found for Cd in these honeybees reared in Milan could be explained by the new downward trend in both the air concentrations and the deposition rates observed for this metal in several areas of northern Europe during the last decades, in agreement with Van Der Steen et al. (Citation2012).
Honeybees provided an effective method for monitoring heavy metal pollution, although, as Van Der Steen et al. (Citation2012) noticed, there are differences in the accumulation of individual heavy metals in bees, and that meteorological factors and different types of vegetation could affect heavy metal concentrations on bees.
The study opens new questions, as for example, to better understand in which ratio these heavy metals are ingested by bees from polluted surfaces (water, plants, soil) or inhaled during flight, or effectively, captured by their hairy bodies when moving over plant and soil surfaces during foraging.
Conclusion
Our results showed, as the available literature in the field, that these animals could serve as environmental ‘low cost’ sentinels to assess the air quality, perhaps in areas with no environmental control units. For the first time, atmospheric lead, nickel and cadmium concentrations were utilised to estimate their relationship with the respective heavy metals detected on honeybees.
This study showed that heavy metals accumulated on honeybees depend on their atmospheric concentrations in their collection site, and that fine dust or PM10 pollution seems to contribute to Pb and Ni carried by the animals. For these reasons, a new project aimed to validate this preliminary study was designed and set up in the city of Milan and in the rural areas of the Lombardy region.
Disclosure statement
No potential conflict of interest was reported by the authors.
Related Research Data
References
- Adamo P, Denaix L, Terribile F, Zampella M. 2003. Characterization of heavy metals in contaminated volcanic soils of the Solofrana river valley (southern Italy). Geoderma. 117:347–366.
- Besser JM, Brumbaugh WG, Ingersoll CG. 2015. Characterizing toxicity of metal contaminated sediments from mining areas. Appl Geochemistry. 57:73–84.
- Celli G, Maccagnani B. 2003. Honey bees as bioindicators of environmental pollution. Bull Insectol. 56:137–139.
- Chabukdhara M, Nema AK. 2013. Heavy metals assessment in urban soil around industrial clusters in Ghaziabad, India: probabilistic health risk approach. Ecotoxicol Environ Saf. 87:57–64.
- Chen W, Lu S, Peng C, Jiao W, Wang M. 2013. Accumulation of Cd in agricultural soil under long-term reclaimed water irrigation. Environ Pollut. 178:294–299.
- Conti ME, Botrè F. 2001. Honeybees and their products as potential bioindicators of heavy metals contamination. Environ Monit Assess. 69:267–282.
- Crane E. 1984. Bees, honey and pollen as indicators of metals in the environment. Bee World. 55:47–49.
- Cremer S, Armitage S, Schmid-Hempel P. 2007. Social immunity. Curr Biol. 17:R693–R702.
- Epstein L, Bassein S. 2001. Pesticide applications of copper on perennial crops in California, 1993 to 1998. J Environ Qual. 30:1844–1847.
- Evans JD1, Schwarz RS. 2011. Bees brought to their knees: microbes affecting honey bee health. Trends Microbiol. 19:614–620.
- Fakhimzadeh K, Lodenius M. 2000. Heavy metals in Finnish honey, pollen and honey bees. Apiacta. 35:85–95.
- Goulson D. 2003. Effects of introduced bees on native ecosystems. Annu Rev Ecol Evol Syst. 34:1–26.
- Guo G, Wu F, Xie F, Zhang R. 2012. Spatial distribution and pollution assessment of heavy metals in urban soils from southwest China. J Environ Sci. 24:410–418.
- Järup L. 2003. Hazards of heavy metal contamination. Br Med Bull. 68:167–182.
- Jones KC. 1987. Honey as an indicator of heavy metal contamination. Water, Air, and Soil Pollution. 33:179–189.
- Leita L, Muhlbachova G, Cesco S, Barbattini R, Mondini C. 1996. Investigation of the use of honey bees and honey bee products to assess heavy metals contamination. Environ Monit Assess. 43:1–9.
- Li W, Xu B, Song Q, Liu X, Xu J, Brookes PC. 2014. The identification of hotspots of heavy metal pollution in soil-rice systems at a regional scale in eastern China. Sci Total Environ. 472:407–420.
- Mehdi Y, Hornick J, Istasse L, Dufrasne I. 2013. Selenium in the environment, metabolism and involvement in body functions. Molecules. 18:3292–3311.
- Nriagu JO. 1990. Environment: science and policy for sustainable development global metal pollution: poisoning the biosphere?. Environ: Sci Policy Sustain Develop. 32:7–33.
- Oldroyd BP. 2007. What's killing American honey bees? PLoS Biol. 5:e168.
- Perugini M, Manera M, Grotta L, Abete MC, Tarasco R, Amorena M. 2011. Heavy metal (Hg, Cr, Cd, and Pb) contamination in urban areas and wildlife reserves: honeybees as bioindicators. Biol Trace Elem Res. 140:170–176.
- Porrini C, Ghini S, Girotti S, Sabatini AG, Gattavecchia E, Celli G. 2002. Use of honey bees as bioindicators of environmental pollution in Italy. In J. Devillers J, Pham-Delègue MH, editors. Honey bees: estimating the environmental impact of chemicals. New York: Taylor & Francis; pp. 187–247.
- Porrini C, Sabatini AG, Girotti S, Fini F, Monaco L, Celli G, Bortolotti L, Ghini S. 2003. The death of honey bees and environmental pollution by pesticides: the honey bees as biological indicators. B Insectol. 56:147–152.
- Porrini C, Sabatini AG, Girotti S, Ghini S, Medrzycki P, Grillenzoni F, Bortolotti L, Gattavecchia E, Celli G. 2003. Honey bees and bee products as monitors of the environmental contamination. Apiacta. 38:63–70.
- Potts SG, Roberts S, Dean R, Marris G, Brown M, Jones R, Neumann P, Settele J. 2010. Declines of managed honey bees and beekeepers in Europe. J Apic Res. 49:15–22.
- Quantin C, Becquer T, Rouiller JH, Berthelin J. 2001. Oxide weathering and trace metal release by bacterial reduction in a New Caledonia Ferralsol. Biogeochemistry. 53:323–340.
- Raeymaekers B. 2006. A prospective biomonitoring campaign with honey bees in a district of Upper-Bavaria (Germany). Environ Monit Assess. 116:233–243.
- Roman A. 2005. The influence of environment on accumulation of toxic elements in honey bees’ body. ISAH. 2:423–426.
- Simon-Delso N, Amaral-Rogers V, Belzunces LP, Bonmatin JM, Chagnon M, Downs C, Furlan L, Gibbons DW, Giorio C, Girolami V, et al.. 2014. Systemic insecticides (neonicotinoids and fipronil): trends, uses, mode of action and metabolites. Environ Sci Pollut Res. 22:5–34.
- Van der Steen JJM, Kraker J, Grotenhuis T. 2012. Spatial and temporal variation of metal concentrations in adult honeybees (Apis mellifera L.). Environ Monit Assess. 184:4119–4126.
- Van der Steen JJM, Kraker J, Grotenhuis T. 2015. Assessment of the potential of honeybees (Apis mellifera L.) in biomonitoring of air pollution by cadmium, lead and vanadium. JEP. 06:6:96–102.
- vanEngelsdorp D, Hayes J, Underwood RM, Caron D, Pettis J. Jr. 2011. An estimate of managed colony losses in the winter of 2006–2007: a report commissioned by the Apiary Inspectors of America. Am Bee J. 50:1–603.
- Veleminsky M, Laznicka P, Stary P. 1990. Honeybees (Apis mellifera) as environmental monitors of heavy metals in Czechoslovakia. Acta Entomol Bohemoslovaca. 87:37–44.