
 ?Mathematical formulae have been encoded as MathML and are displayed in this HTML version using MathJax in order to improve their display. Uncheck the box to turn MathJax off. This feature requires Javascript. Click on a formula to zoom.
Abstract
To evaluate the substitution of soybean meal by crushed crambe as a source of protein, five crossbred steers rumen cannulated weighting 426 ± 25 kg BW were distributed in a 5 × 5 Latin square design. The steers were allocated in different levels of crushed crambe groups (0, 25, 50, 100 and 150 g/kg in concentrate supplement). Dry matter intake (DMI), rumen fluid pH, nitrogen (N) urinary excretion, propionate and isovalerate ruminal concentrations increased linearly (p < .05) with the replacement of soybean meal by crushed crambe. Crude protein (CP) intake, butyrate and valerate concentrations, and N retention and balance (g/d) showed linear decreases by the inclusion of crushed crambe. There was a quadratic decrease (p < .05) for neutral detergent fibre (NDF) intake and valerate concentration. Total short-chain fatty acids (SCFAs) increased quadratically (p < .05) with the inclusion of crushed crambe. The supplement and total DMI, digestibility of DM, CP and NDF, N–NH3, acetate, isobutyrate concentrations and intake, excretion faecal and total of N, microbial protein synthesis, urinary excretion and blood concentration of urea and creatinine were not affected (p > .05) by the crushed crambe inclusion in the diet. It is recommended that 100 g/kg of the crushed crambe inclusion replacing soybean meal supplements to grazing steers because improved supplement DMI and total SCFAs, reducing ruminal fermentation and nitrogen excretion, without affecting digestibility and microbial protein synthesis.
DM intake and digestibility were not affected in steers fed crushed crambe.
Urinary N excretion increased with crushed crambe replacing soybean meal.
Highlights
Introduction
The use of alternative sources of low-cost and high-yield vegetable oil is essential for the sustainability of biofuels (Bassegio et al. Citation2016). With the extraction of these oils, large amounts of by-products are generated that can be used in animal feed, because these by-products are usually low cost and improve the profitability of producers without harming animal performance (Gonzaga Neto et al. Citation2015; Costa et al. Citation2016; Silva et al. Citation2016). Crambe (Crambe abyssinica H.), an alternative and promising source of vegetable oil for the production of biodiesel (Bassegio et al. Citation2016), is an oilseed in the family Brassicaceae that is an annual herbaceous plant native to the Mediterranean region, with height between 70 and 90 cm and a short (90 days) annual cycle (Souza et al. Citation2009).
From the crambe extraction process, by-products (crushed, meal or cakes) are generated with high protein content and great potential for use in ruminant feed to replace traditional protein sources such as soybean meal and cotton (Canova et al. Citation2015; Carneiro et al. Citation2016; Ítavo et al. Citation2016). The crushed crambe has high lipid content (360–380 g/kg) that can increase the energy density of a diet (Ítavo et al. Citation2016). However, although lipids in a ruminant diet are source of energy to the animal, the lipids are not used as a source of energy by rumen microbes, which can reduce fibre digestibility (Van Soest Citation1994).
Additionally, the use of crushed crambe in animal feed requires care because of the glucosinolates, which are considered toxic to livestock, potentially causing damage to the liver and other organs, and decrease palatability, growth rates and production, leading to weight loss (Tripathi and Mishra Citation2007). The potential of glucosinolates at high levels represents the primary limitation for the use of crambe in animal feed (Tripathi and Mishra Citation2007), because the crambe grain has approximately 30–40 g/kg or 90 mol/g of glucosinolates, a toxic level for many organisms (Wallig et al. Citation2002). In ruminants, the toxic products are not produced during digestion (Böhme et al. Citation2005); however, reduced intake due to low palatability of crambe by-products is reported (Canova et al. Citation2015; Ítavo et al. Citation2016). With this background, the objective of this study was to evaluate the optimum level of crushed crambe to include in the diet of steers as a replacement for soybean meal, measured by the intake and digestibility of nutrients, microbial protein synthesis and nitrogen balance (NB) and ruminal fermentation.
Materials and methods
Study location and ethical considerations
The experiment was performed in the Nutrition of Ruminants facilities, College of Agricultural Sciences, Federal University of Grande Dourados (FUGD), located at 22°11’43.49” S, 54°55’77” W. All animal procedures were conducted in accordance with ethical standards and were approved by the Institution Ethics Committee on Animal Experimentation, following protocol 004/2013-CEUA/FUGD.
Animals, experimental design, diets and general procedures
Five crossbred steers (24 months old), with an average BW of 426 ± 25 kg, and fistulated with rumen cannulated, were distributed in a 5 × 5 Latin square design. Animals were individually allocated in paddocks (0.3 ha) uniformly covered with Urochloa brizantha (syn. Brachiaria brizantha) and were supplemented with concentrate feed at 1000 g/100 kg of BW. The concentrate supplement was composed of U. brizantha as roughage and a concentrate supplement compound consisting of ground corn, soybean meal, whole rice meal, urea, ammonium sulphate, mineral mixture, limestone, dicalcium phosphate and crushed crambe included at the following levels: 0, 25, 50, 100 and 150 g/kg. The supplement was provided to steers according to the recommendations of the National Research Council (NRC Citation1996) daily at 09:00 h.
The experimental period totaled 100 days, with five periods of 20 days, in addition to a 13-day adaptation period and a 7-day sample collection period. On the first day of each experimental period, total forage availability was determined with the harvest of 10 samples in each paddock using a metal square 0.25 m2 in area randomly located. Subsequently, in each paddock, two composite samples were collected for chemical analysis and evaluation of botanical composition.
Intake, digestibility and chemical analysis
The sampling of fed forage by animals (extrusa) was performed on day 18 of each experimental period by emptying the rumen (Dubbs et al. Citation2003). Before collection, the animals were fasted for 12 h. Collection was performed at 08:00 h, and the rumen was emptied, dried with cotton cloths and cleaned. After rumen emptying, the animals returned to their respective paddocks and were grazed for approximately 30 min. On average, 400 g of extrusa of each animal was collected, which was stored in plastic bags, named according to the treatment, transported to the lab in a thermal box and then frozen at –10 °C for later chemical analysis.
The total apparent digestibility of the diets was estimated by the relationship between external (titanium dioxide, TiO2) and internal (iADF) markers from which the dry matter intake (DMI) and the faecal production of animals were estimated. The animals received the supply of TiO2 for 10 consecutive days, with the first 5 days used for adaptation to the external marker and the other 5 days for sample collection (Ferreira et al. Citation2009). The supply of external marker (TiO2) to the animals began on the 2nd day of each trial period with 10 g of TiO2 per day supplied directly into the rumen of fistulated animals, divided into two doses daily (08:00 and 17:00 h). Faecal samples were collected directly from the rectum of animals for five consecutive days at different times (06:00, 08:00, 10:00, 12:00 and 14:00 h); approximately, 200 g was placed in a plastic bag and frozen at –10 °C for later chemical analysis. The supplements were weighed at 20, 40, 60, 90, 120, 180, 300, 420, 540 and 1440 min after feeding to the animals.
The samples of ingredients, refusals and faeces were pre-dried in a forced-ventilation oven at 55 °C for 72 h. Then, the samples of ingredients and refusals were ground in a Wiley knife mill with a 1-mm screen, and faecal samples were passed through a 3-mm screen. The samples were stored in plastic jars with lids, labelled, and analysed to determine the dry matter (DM method, 934.01), crude protein (CP method, 920.87), ether extract (EE method, 920.85) and ash (method 924.05) contents according to AOAC (Citation2006). The contents of ADF were estimated by following the method described by Van Soest and Robertson (Citation1985). Acid detergent lignin content was estimated by oxidation with potassium permanganate (Van Soest and Wine Citation1968), and NDF contents were evaluated by the treatment of samples with alpha thermo-stable amylase without sodium sulphite and corrected for ash residue (Mertens Citation2002) and residual nitrogen (N) compounds (Licitra et al. Citation1996) (Table ).
Table 1. Ingredient proportions and chemical composition of the experimental supplementation.
The pasture TDN was estimated based on the ADF content, according to the following equation: TDN = 74.49 – 0.5635 × [ADF (r2 = .82)] as described by Capelle et al. (Citation2001). The TiO2 concentrations were by Ultraviolet–Visible Absorption Spectroscopy according to Myers et al. (Citation2004). The faecal production was estimated by the equation: FE = MS/MF, where FE = daily faecal excretion (g/day), MS = marker (titanium dioxide) supplied (g/day) and MF = concentration of the marker (titanium dioxide) in the faeces (g/g DM).
The pasture DMI was estimated by the internal marker concentration, which was indigestible acid detergent fibre (iADF). A unique sequential procedure was adopted according to the study of Detmann et al. (Citation2012) based on pasture in situ degradability during 288 h.
The DMI was determined using the following equation: DMI = {[(EF × MF) – MSu]/MF} + SDMI, where DMI = dry matter intake (kg/day), FE = faecal excretion (kg/day), MF = concentration of the marker in the faeces (kg/kg DM), MSu = concentration of marker in the supplement (kg/day), MF = concentration of the marker in the forage (kg/kg DM) and SDMI = supplement DMI (kg/day).
Ruminal fluid analysis and SCFA
On day 14, approximately 140 mL of rumen fluid was collected from each animal at each time (0 or at feeding, 2, 4, 6 and 8 h after feeding). An aliquot of 40 mL of ruminal fluid immediately after collection was used to evaluate pH with a digital pH meter. For the determination of ammonia–nitrogen (N–NH3), the rumen fluid was centrifuged at 3000×g during 10 min, distilled using 2N KOH and then titrated with a solution of 0.005N HCl.
Ruminal short-chain fatty acid (SCFA) concentrations were measured using a gas chromatograph (model GC-2104; Shimadzu, Tokyo, Japan) according to the method described by Erwin et al. (Citation1961) and adapted by Getachew et al. (Citation2002). The gas chromatograph was equipped with split injector, dual flame ionisation detector (temperature, 250 °C) and capillary column (Stabilwax; Restek, Bellefonte, PA, USA) at 145 °C. The gases used in the analyses were helium as the carrier gas (flow, 8.01 mL/min), hydrogen as the fuel gas (pressure, 60 kPa) and synthetic air as the oxidiser gas (pressure, 40 kPa). An external standard was prepared with acetic, propionic, isobutyric, butyric, isovaleric and valeric acids (Chem Service, Inc., West Chester, PA, USA). The software GC Solution (Shimadzu) was used to calculate the concentrations of SCFA.
Microbial efficiency and NB
‘Spot’ urine samples were collected at 15 and 16 days of each trial period, 4 h after feeding during spontaneous urination for the measurement of urinary nitrogenous compounds. The urine was captured in plastic buckets and mixed (10 mL) in a sulphuric acid solution (40 mL) to 0.036N and then was frozen for subsequent analysis. For all spot urine samples, uric acid and creatinine were determined using commercial test kits (Labtest®; Diagnóstico SA, Minas Gerais, Brazil), whereas allantoin was determined using a colorimetric method as described by Chen and Gomes (Citation1992).
Urine analyses were performed on diluted samples, because this procedure avoids bacterial destruction of urinary purine derivatives and precipitation of uric acid. Urine samples were analysed for total nitrogen content, purine derivatives (allantoin and uric acid) and creatinine. Urinary volume was estimated for each animal by multiplying the BW by daily creatinine excretion (mg/kg CP) and dividing the product by the creatinine concentration (mg/L) in the urine ‘spot’ sample.
The daily urine volume (UV) estimated from the ‘spot’ samples was calculated from the mean creatinine excretion: UV (L/day) = (27.36 × BW)/creatinine, where 27.36 = the daily excretion of creatinine in ppm, on average, obtained by Rennó et al. (Citation2000) for Zebu crossbreed steers and creatinine = the creatinine concentration (mg/L) from the urine ‘spot’ sample of the animal.
The daily excretion of allantoin and uric acid was obtained by multiplying the concentrations by daily UV. The excretion of the purine derivatives (X, mmol/day) in urine was calculated by the sum of the excretions of allantoin and uric acid. Then, the microbial purines absorbed (Y, mmol/day) were calculated from the excretion of purine derivatives (X, mmol/day) using the equation of Verbic et al. (Citation1990): Y = X + 0.385 × BW.75/0.85, where 0.85 is the recovery of purines absorbed as urinary derivatives of purines and 0.385 × BW0.75 is the endogenous contribution to purine excretion.
The intestinal flow of microbial N (Nmic) compounds (Y, g N/day) was calculated as a function of absorbed microbial purines (X, mmol/day), according to the equation described by Chen and Gomes (Citation1992): Nmic (g/day) = (absorbed purines ×70)/(0.134 × 0.83 × 1000), where 70 is the N content in the purines (mg N/mmol), 0.134 is the mean purity ratio of the purine N and the total N of the rumen microorganisms and 0.83 is the assumed digestibility of the microbial purines. Microbial efficiency was obtained by dividing the production of microbial N by the intake of TDN. Nitrogen balance was determined by the calculation: NB (g/day) = N ingested – faeces N excretion – urinary N excretion. The N retention was obtained as the difference between the NB and the BEN (basal endogenous nitrogen), considering the endogenous tissue and dermal N losses to be 0.35 and 0.018 in metabolic weight, respectively (AFRC Citation1993). The BEN was obtained using the equation BEN (g/day) = (0.018 + 0.35) × BW0.75.
Supplement ingestive behaviour
Concentrate intake behaviour of animals was observed at 13th day of each experimental period, by weighing the concentrate in the feed bunks after 20, 40, 60, 90, 120, 180, 300, 420, 540 and 1140 min (Brody Citation1945).
Statistical analyses
The data were evaluated to verify the normality of residuals and the homogeneity of variance in a statistical software R (The R Core Team, Citation2014), and 5% was considered a nominal significance level. The data were evaluated using a command ‘aova’ as follows:
Where Yijk = dependent variable, μ = the observation average, Ai = the animal effect (i = 1–5), Pj = the trial period effect (j = 1–5), Dk = the diet effect (k = 1–5) and eijk = the residual error.
The ruminal fermentation data (pH, N–NH3 and SCFAs) were arranged in a split plot scheme. The effect of the inclusion of crambe and the collection time were studied through the adjustments of regression model; used polynomials not exceeding three; according to model:
where: Yijkl: observed value of response variable; μ = intercept: constant inherent in all observations; Ai = the animal effect (i = 1–5) Pj = the trial period effect (j = 1–5) p(crambek; g) = effect of the continuous factor ratio of crambe described by a polynomial of degree g, or any other crambe function that considers g parameters; eijk = effect of the stochastic term associated with ijk-th observation, assumed to be independent, of normal distribution with constant variance; p(timel; g) = effect of the continuous factor time after supply of the supplement described by a polynomial of degree h, or any other function of the time that considers h parameters; p(crambe: timekl; g × h) = effect of the interaction between the proportion of crambe and time after the supplement supplied; eijkl = effect of the stochastic term associated with ijkl-th observation, assumed to be independent, of normal distribution with constant variance.
The parameters of the model were estimated and the effects of the factors were tested by analysis of variance. Residue analysis was done to evaluate the distance from the stochastic term assumptions. As a result of the leakage of the assumptions, Box–Cox transformation was applied to the variables, with ך obtained by maximising the likelihood of the model in relation to ך. yt = ( – 1)/ך.
The ingestive behaviour evaluations were submitted to a non-linear regression procedure to determine the effects of time after administration of the supplement and inclusion of crushed crambe:
E(Y) = A × exp(–B × time), exponential model that considers the effect of time;
E(Y) = A × exp[(–B × time) – (C × crambe)], exponential model that considers the additive effect of time and crambe;
E(Y) = A × exp[(–B × time) – (C × crambe) – (D × time × crambe)], exponential model that considers the effect of the interaction between time and crambe (expressed by terms of first order). In this sequence of models, difference in fit quality represents the effect of the non-common term.
The models were fitted to the data through the interactive minimising of the sum of squared residuals by the Gauss–Newton method, available in the nls () function of the statistical application R. Comparisons between models were done by the F statistic based on the difference between the sum of squared residuals and the degrees of freedom adjustments.
Results
Average pasture production was 7.05 ton/ha of DM, with mean leaf and stem production of 382 and 326 g/kg, respectively. When 340 g/kg of crushed crambe was used, the stem:leaf ratio was high (1:1.35), which then decreased with increasing level of by-product to 1000 g/kg. However, when the level of crambe increased in the supplement, the pasture CP content was 18.4% lower than that of the control supplement and similarly, the TDN:CP ratio was 17.2% lower than the supplement with 1000 g/kg of soybean meal (Table ).
Table 2. Availability and chemical composition of U. brizantha as roughage.
For the pasture NFCs, the content was 21.8% higher than the control supplement when 100 g/kg of crushed crambe was used. A linear increase (p = .003) in the supplement DMI was observed as the level of the soybean meal substitution increased (Table ).
Table 3. Intake and total apparent digestibility of steers grazing and supplemented with diets containing crushed crambe.
In contrast, the CP intake decreased linearly (p = .006) when the crushed crambe portion increased in the diet. For the crambe, the intake of the entire supplement required 100 min (Figure ).
Figure 1. Supplement intake as a function of time after the supply and concentration of crushed crambe.
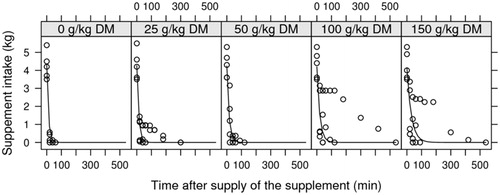
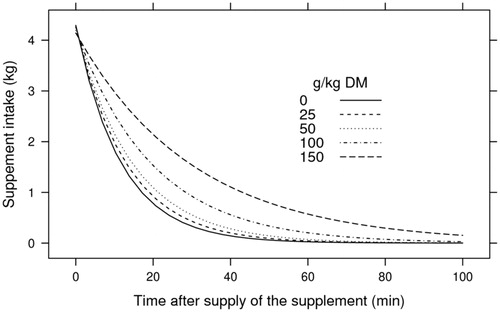
A positive relationship was demonstrated between amount of crambe in the diet and total time of intake, with intake time increasing with the portion of crushed crambe in the diet (Figure ).
Figure 2. Supplement intake as a function of time after the supply and replacement levels of crushed crambe, with emphasis on the range of 0–100 min.
A quadratic response was observed for the NDF intake (p = .002), with reduced intake when the animals were fed 170 g/kg of crushed crambe. However, the DMI of grass (p = .46) and concentrate supplement (p = .76) and the total DMI (p = .65) of steers were not influenced by the inclusion of crushed crambe in the diet. The total apparent digestibility of DM (p = .76), CP (p = .32) and NDF (p = .77) was similar (p = .76) among the levels of replacment of soybean meal by crushed crambe.
Ruminal fermentation was associated with linear increases in rumen fluid pH (p = .004) and propionate concentration (p = .023; in mmol/L and % of total SCFAs) with crushed crambe replacement of soybean meal (Table ). An increase in pH of 0.0003–1% occurred with the replacement of soybean meal by crushed crambe, whereas propionate concentrations increased to 0.003%. Total acid percentage increased 0.06% with the inclusion of crushed crambe protein at increased concentrations in grazing animal diets.
Table 4. Ruminal fermentation of rumen fluid of steers grazing and supplemented with diets containing crushed crambe.
A linear decrease was observed for butyrate (p = .009) concentration (mmol/L and % of total SCFAs) and valerate concentration (% of total SCFAs) with the replacement of soybean meal by crushed crambe. A linear increase (p = .005) occurred in isovalerate concentration (mmol/L), whereas a quadratic reduction (p = .023) was observed for valerate concentration (% of total SCFAs). The total SCFAs (mmol/L) increased quadratically (p = .006) with crushed crambe replacement of soybean meal in the diets of steers. Supplementation with crushed crambe protein had no effect on acetate, isobutyrate and the C2:C3 ratio (p > .05).
The crushed crambe replacement of soybean meal in the diets improved urinary N excretion (p = .004) without altering excretion (g/day) of faecal N (p = .65) and total N (p = .23) (Table ).
Table 5. Nitrogen (N) balance and microbial protein synthesis of steers grazing and supplemented with diets containing crushed crambe.
The N retention and N balance decreased 0.437 and 1.0 g/day, respectively, with the increased use of crushed crambe in the diets of steers. Inclusion of crushed crambe in the diets had no effect (p > .05) on N intake and microbial protein synthesis (g/day) or on urea and creatinine in urinary excretion (mg/dL), plasma concentration (mg/dL) or nitrogen equivalence (mg/kg of BW).
Discussion
The average pasture production was 7048 kg of DM/ha, which was sufficient to provide selectivity to the animals during pasture grazing. This can be confirmed by leaf/stem ratio of 1.17 and the forage mass values that are related to the nutritional quality of the pastures evaluated. According to Anjos et al. (Citation2016), the relevance of the leaf/stem ratio varies according to the forage species, and the ratio is lower with tender stalks and less lignification. This ratio can be used as an index of the forage nutritional value, in addition to the pasture height and herbage mass, facilitating forage intake by the animal and their behaviour during the grazing period at a suitable ratio (Smart et al. Citation2001). For the chemical composition of pastures (extrusa), the CP (g/kg) values listed in Table are <70 g/kg, which is the value recommended by Van Soest (Citation1994) to avoid decreasing DM intake. Additionally, the values of approximately 40 g/kg may limit microbial growth (Baroni et al. Citation2010).
The NDF content of forages was high, with an average value of 700 g/kg. When animals intake forage containing high levels of fibre, the voluntary intake is impaired (Van Soest Citation1994). The low DM digestibility increases the feed retention time in the rumen, imposing physical limitations on DM intake. Animal performance can change depending on the TDN:CP ratio, and according to Moore et al. (Citation1999), a ratio of >7.0 indicates protein deficiency in relation to available energy, which results in decreased forage intake.
The protein intake from the supplement increased 684 g/day for each additional percentage point of crushed crambe used. This response was related to the low forage content, with the animals increasing protein supplementation until their requirements were met. The effect of supplement intake did not influence the total DMI of the animals, which was below the NRC (Citation2000) recommendations.
The increases in supplement intake might be associated with degraded protein availability in the rumen, because supplements with higher amounts of crushed crambe had higher levels of urea. According to Goes et al. (Citation2008), increases in DMI based on the rumen supply of degradable proteins are associated with improved passage rate of liquid and solid phases. As the inclusion of crushed crambe increased as a substitute for soybean meal, a linear decrease in the CP intake from the supplement was observed (Table ), in addition to an increase in the supplement intake time.
Crushed crambe contains epigoitrin (epi-PG), which is toxic and has a bitter taste, making it an unpalatable product. Crushed crambe contains from 80 to 100 g/kg of glucosinolates (Tripathi and Mishra Citation2007) and almost 90% is converted into epi-PG. In the grain, glucosinolate is hydrolysed by the enzyme thioglucosidase, and the reaction between the glucosinolate and the enzyme occurs when the seed is crushed. In ruminants, decreased intake occurs due to the low palatability of this by-product (Mendonça et al. Citation2015), and a reduction in rumen flora activity after 6 days of ingestion (Duncan and Milne Citation1992) may cause a reduction in consumption after the 3rd day (Böhme et al. Citation2005).
The effect of the NDF intake might be related to the additive effect, because no effect was observed on forage intake or total DMI. The average value of 704 g/kg DM of forage NDF content might explain this result. The dietary NDF amount is negatively correlated with DMI because of the slow fermentation and increased retention time in the rumen, and hence limiting intake by the filled rumen. However, the use of more digestible fibre in smaller particles can stimulate the intake by increasing the passage rate.
The similarity between the nutrient total digestibility might be due to the total intake of animals and the amount of NFC in the diets (Table ). The values of rumen pH with the inclusion of different levels of crushed crambe did not alter the digestibility of dietary fibre. The minimum value obtained was greater than the 6.2-threshold proposed by Russell and Wilson (Citation1996) as the minimum limit such that a reduction of microbial inhibition and NDF degradation occurs; values <6.2 would lead to a significant reduction in the degradation process of food, and values <6.0 would result in practically no degradation of the fibre.
The average concentrations of N–NH3 in rumen fluid for all levels of crushed crambe inclusion were above the minimum required (10 mg/dL) for maximal microbial growth (Detmann et al. Citation2007). High ruminal ammonia concentrations result in a higher net absorption of ammonia nitrogen (N–NH3) on the walls of the rumen, faster conversion to urea and consequential loss through urinary excretion (Assis et al. Citation2004).
The highest proportions of crushed crambe in supplements were associated with linear increases in propionic acid concentrations, possibly related to the concentrated lipid levels. As noted by Marín et al. (Citation2010), lipolysis occurs in the rumen, releasing fatty acids and glycerol, which are quickly fermented, resulting primarily in an increase in propionic acid concentration and a subsequent elevation in acetic acid.
The quadratic response of total fatty acids was from the action of microorganisms on large quantities of substrate, because dietary sugars are incorporated and in return, fatty acids are released to the environment, which is the primary factor contributing to the decrease in pH during these periods. The effect of the association between the production of these SCFA and the release of ammonia in the rumen compartment changes the stability of the ruminal pH, and changes in the magnitude of these three factors may occur when oil is included in the diet. Crushed crambe contains approximately 36% of oil, which has a high concentration of unsaturated fatty acids (Carlson and Tookey Citation1983) that are toxic to microorganisms. Microbial toxicity can reduce acetate concentration and total SCFAs by changing the rumen microbiota, altering the populations of Gram (+) bacteria, particularly the cellulolytic type (Marín et al. Citation2010).
The increase in propionate concentration may be related to the increase in DM supplement intake when soybean meal was replaced by crushed crambe. In addition, the crushed crambe inclusion also promoted a reduction in NDF and CP intake, which resulted in a lower N intake and consequently a reduction in the N retained (balance) in the rumen. This increase may have occurred because the crushed crambe displays cationic properties (Medeiros et al. Citation2015a; Moreira et al. Citation2016). Oilseed cakes will increase propionate:acetate ratio by H2 kidnap (Medeiros et al. Citation2015b) and thus increasing the energy production from propionate (glucose +2 H2) and further reduce the production of methane (Moreira et al. Citation2014; Morais et al. Citation2015).
The quadratic response observed in the production of isobutyric acid and valeric and isovaleric acids was related to protein fermentation. Ruminal concentrations of isobutyric and isovaleric acids are indicative of the fermentation of amino acids, which accumulate SCFAs, a primary factor in pH reduction, at high concentrations. However, in this study, no decline in pH was observed with the addition of crushed crambe. The high concentrations of pasture NDF might have contributed significantly to the stabilisation of ruminal pH, through the recycling and production of sodium bicarbonate by saliva.
Our results showed that a low rate of deamination in the rumen would be offset by the use of amino acids and proteins in the small intestine (Russell Citation2002), which would lead to reduced conversion of NH3 to protein and amino acids, resulting in a decrease in the loss of ammonia by urea in the urine, providing a greater use of N dietary. Anderson et al. (Citation1993) stated that crambe is a source of cysteine, methionine, lysine and threonine; therefore, the manipulation of the amino acid profile in the duodenum can be of interest because protein sources of low degradability enable such manipulation; however, the manipulation can reduce the contribution of nitrogen for microbial synthesis. However, such protein sources can contribute to the synthesis of glucose through gluconeogenesis in ruminants (Anderson et al. Citation2000).
Microbial protein synthesis depends on the availability of carbohydrates and N in the rumen (Magalhães et al. Citation2005). Thus, to maximise microbial growth, synchronisation must occur between the fermentable energy and the degradable N in the rumen; these parameters are inversely related to the residence time of microorganisms in the rumen. In this sense, the faster the passage of microorganisms, the lower the demands on energy use for maintenance. In this study, the TDN:CP ratio was 9.14; which might have influenced the effect of supplementation in rumens of the animals.
The inclusion of crushed crambe changed urinary N excretion, without changing faecal N, producing a positive NB. The addition of crushed crambe was associated with a linear increase in N excretion via urine. Rennó et al. (Citation2008) reported greater conservation of nitrogen compounds in diets with lower CP content, which is consistent with the N intake values in this study. High excretion rates of nitrogenous compounds may be associated with a protein degradation rate that exceeds the rate of fermentation of carbohydrates (Van Soest Citation1994).
The N balance was reduced with the inclusion of crambe, which was associated with urinary N excretion; a positive NB indicates protein retention in the animals, providing conditions that encourage weight gain in experimental animals. Lima et al. (Citation2013) also found a positive NB in animals supplemented with oil cakes, with significant faecal N excretion.
The reduction in retained N might be associated with the low N intake shown by the animals. The ratios N retained/N absorbed and N retained/N intake showed mean values of 0.58 and 0.45, respectively. The ratio of retained N to absorbed N can be used to evaluate the quality of dietary protein; dietary protein quality expresses the percentage of the digested fraction that is used by the animal body. These values are influenced by the quality of the protein ingested by animals.
The excretion of urea and urea–N was not influenced by crushed crambe, with average values of 137 mg/kg BW obtained for urea and 181 mg/dL for blood urea nitrogen. Rennó et al. (Citation2000) reported values of 185 and 86.1 mg/kg BW, respectively, in research with protein levels close to 12%. The daily excretion of creatinine and N–creatinine did not change significantly in this study, with average values of 27.3 mg/kg BW and 10.2 mg/dL, respectively. These values are consistent with those reported by Chizzotti et al. (Citation2006) and Lima et al. (Citation2013) who found no significant effect on creatinine excretion in cattle, which remained constant, despite the use of different diets.
Conclusions
The inclusion of crushed crambe as a replacement for soybean meal in the concentrate supplement of steers improved supplement DMI and total SCFAs and reduced ruminal fermentation and NB, without affecting digestibility and microbial protein synthesis. Thus, the recommendation is to include up to 100 g/kg of crushed crambe as a replacement for soybean meal in protein supplements to grazing steers.
Disclosure statement
No potential conflict of interest was reported by the authors.
Related Research Data
References
- AFRC. 1993. Energy and protein requirements of ruminants. Agricultural and Food Research Council. Wallingford, UK: CAB International; p. 159.
- Anderson VL, Caton JS, Kirsch JD, Redmer DA. 2000. Effect of crambe meal on performance, reproduction, and thyroid hormone levels in gestating and lactating beef cows. J Anim Sci. 78:2269–2274.
- Anderson VL, Slanger WD, Boyles SL, Berg PT. 1993. Crambe meal is equivalent to soybean meal for back grounding and finishing beef steers. J Anim Sci. 71:2608–2613.
- Anjos AJ dos, Gomide CA de M, Ribeiro KG, Madeiro AS, Morenz MJF, Paciullo DSC. 2016. Forage mass and morphological composition of Marandu palisade grass pasture under rest periods. Ciênc. agrotec. 40:76–86.
- AOAC. 2006. Official Methods of Analysis. 18th ed. Arlington (VA): Association of Official Analytical Chemists.
- Assis AJ, Campos JMS, Queiroz AC, Valadares Filho SC, Euclydes RF, Lana RP, Magalhães ALR, Neto JM, Mendonça SS. 2004. Citrus pulp in diets for milking cows. 2. Digestibility of nutrients in two periods of feces collection and rumen fluid pH and ammonia nitrogen. Rev Bras Zootecn. 3:251–257.
- Baroni CES, Lana RP, Mancio AB, Mendonça BPC, Leão MI, Sverzut CB. 2010. Intake and digestibility of nutrients in steers supplemented and finished on pasture in the dry season. Arq Bras Med Vet Zootec. 62:365–372.
- Bassegio D, Zanotto MD, Santos RF, Werncke I, Dias PP, Olivo M. 2016. Oilseed crop crambe as a source of renewable energy in Brazil. Renew Sust Energy Rev. 66:311–321.
- Böhme H, Kampf D, Lebzien P, Flachowsky G. 2005. Feeding value of crambe press cake and extracted meal as well as production responses of growing-finishing pigs and dairy cows fed these by-products. Arch Anim Nut. 59:111–122.
- Brody S. 1945. Bioenergetics and growth. New York, NY, USA: Reinhold Publishing; p.1023.
- Canova ÉB, Bueno MS, Moreira HL, Possenti R, Brás P. 2015. Crambe cake (Crambe abyssinica hochst) on lamb diets. Ciênc agrotec. 39:75–81.
- Capelle ER, Valadares Filho SC, Silva JFC, Cecon PR. 2001. Estimates of the energy value from chemical characteristics of the feedstuffs. Rev Bras Zootec. 30:1837–1856.
- Carlson KD, Tookey HL. 1983. Crambe meal as a protein source for feed. J Am Oil Chem Soc. 60:1979–1985.
- Carneiro MMY, Goes RH de TB de, Silva LHX da, Fernandes ARM, Oliveira RT de, Cardoso CAL, Hirata ASO. 2016. Quality traits and lipid composition of meat from crossbreed Santa Ines ewes fed diets including crushed crambe. Rev Bras Zootecn. 45:319–327.
- Chen XB, Gomes MJ. 1992. Estimation of microbial protein supply to sheep and cattle based on urinary excretion of purine derivatives – an overview of technical details. (Occasional publication) International Feed Research Unit. Bucksburn, Aberdeen: Rowett Research Institute; p. 21.
- Chizzotti ML, Valadares Filho SC, Valadares RFD, Chizotti FHM, Campos JMS, Marcondes MI, Fonseca MA. 2006. Intake, digestibility and urinary excretion of urea and purine derivatives in heifers with different body weights. Rev Bras Zootecn. 35:1813–1821.
- Costa JB, Oliveira RL, Silva TM, Ribeiro RDX, Silva AM, Leão AG, Bezerra LR, Rocha TC. 2016. Intake, digestibility, nitrogen balance, performance, and carcass yield of lambs fed licuri cake. J Anim Sci. 94:2973–2980.
- Detmann E, Cecon PR, Paulino MP, Valadares Filho SC, Henriques LT, Detmann KSC. 2007. Rumen variables evaluated through continuum mathematical functions. Pesq Agr Bras. 42:1651–1657.
- Detmann E, Valente TNP, Sampaio CB. 2012. Avaliação da fibra em detergente neutro indigestível e da fibra em detergente ácido indigestível. In: Detmann, E, editor. Métodos para análise de alimentos. Visconde do Rio Branco, MG, Brazil: INCT – Ciência Animal. Suprema Editora; pp. 147–163.
- Dubbs TM, Vanzant ES, Kitts SE, Bapst RF, Fieser BG, Howlett CM. 2003. Characterization of season and sampling method effects on measurement of forage quality in fescue-based pastures. J Anim Sci. 81:1308–1315.
- Duncan AJ, Milne JA. 1992. Rumen microbial degradation of allyl cyanide as a possible explanation for the tolerance of sheep to Brassica-derived glucosinolates. J Sci Food Agric. 58:15–19.
- Erwin ES, Marco GJ, Emery EM. 1961. Volatile fatty acid analyses of blood and rumen fluid by gas chromatograph. J Dairy Sci. 44:1768–1771.
- Ferreira MA, Valadares Filho SC, Silva LFC, Nascimento FB, Detmann E, Valadares RFD. 2009. Prediction of individual dry matter intake in group-fed lactating dairy cows. Rev Bras Zootec. 38:1574–1580.
- Getachew G, Makkar HPS, Becker K. 2002. Tropical browses: contents of phenolic compounds, in vitro gas production and stoichiometric relationship between short chain fatty acid and in vitro gas production. J Agric Sci. 139:341–352.
- Goes RHTB, Lambertucci DM, Brabes KCS, Alves DD. 2008. Energetic and protein supplementation for beef cattle in tropical pasture. Arq Ci Vet Zool. 11:129–137.
- Gonzaga Neto S, Oliveira RL, Lima FH, Medeiros AN, Bezerra LR, Viégas J, Nascimento NG Jr, Freitas Neto MD. 2015. Milk production, intake, digestion, blood parameters, and ingestive behavior of cows supplemented with by-products from the biodiesel industry. Trop Anim Health Prod. 47:191–200.
- Ítavo LCV, Souza ADV de, Fávaro SP, Ítavo CCBF, Petit HV, Dias AM, Morais MG, Coelho RG, Reis FA, Costa JAA, et al. 2016. Intake, digestibility, performance, carcass characteristics and meat quality of lambs fed different levels of crambe meal in the diet. Anim Feed Sci Technol. 216:40–48.
- Licitra G, Hernandez TM, Van Soest PJ. 1996. Standardization of procedures for nitrogen fractionation of ruminant feeds. Anim Feed Sci Technol. 57:347–358.
- Lima HL, Goes RHTB, Cerilo SLN, Oliveira ER, Gressler MGM, Brabes KCS. 2013. Nutritional parameters of steers receiving different levels of sunflower crushed in partial replacement of soybean meal. Ann Braz Acad Sci. 85:1513–1522.
- Magalhães KA, Valadares Filho SC, Valadares RFD, Paixão ML, Pina DS, Paulino PV R, Chizzotti ML, Marcondes MI, Araújo AM, Porto MO. 2005. Effects of feeding different levels of urea or cottonseed hulls on microbial protein synthesis, plasma urea concentration and urea excretion in steers. Rev Bras Zootecn. 34:1400–1407.
- Marín ALM, Hernández MP, Alba LP, Castro GG. 2010. Digestión de los lípidos en los rumiantes: Una Revisión. Interciencia 35:240–246.
- Medeiros FF, Silva AMA, Carneiro H, Araujo DRC, Morais RKO, Moreira MN, Bezerra LR. 2015a. Alternative protein sources derived from the biodiesel production chain for feeding to ruminants. Arq Bras Med Vet Zootec. 67:519–526.
- Medeiros FF, Bezerra LR, Silva AMA, Carneiro H, Morais RKO, Moreira MN, Pereira Filho JM. 2015b. Greenhouse gases, short-chain fatty acids and ruminal pH in vitro of biodiesel byproducts to replace corn silage. Rev. Bras. Saúde Prod. Anim. 16:935–947.
- Mendonça BPC, Lana RP, Detmann E, Goes RHTB, Castro TR. 2015. Crambe meal in finishing of beef cattle in feedlot. Arq Bras de Med Vet Zootec. 67:583–590.
- Mertens, D.R. 2002. Gravimetric determination of amylase treated neutral detergent fiber in feeds with refluxing in beakers or crucibles. Collaborative study. J AOAC. 85:1212–1240.
- Moore JE, Brant MH, Kunkle WE, Hopkins DI. 1999. Effects of supplementation on voluntary forage intake, diet digestibility, and animal performance. J Anim Sci. 77:122–135.
- Morais RKO, Silva AMA, Bezerra LR, Carneiro H, Moreira MN, Medeiros FF. 2015. In vitro degradation and total gas production of byproducts generated in the biodiesel production chain. Acta Scient Anim Sci. 37:143–148.
- Moreira MN, Silva AMA, Bezerra LR, Carneiro H, Morais RKO, Medeiros FF. 2016. Effect of replacement of sugarcane by oilseed press cakes in greenhouse gases and volatile fatty acids production in vitro. Acta Scient Anim Sci. 38:293–300.
- Moreira MN, Silva AMA, Carneiro H, Bezerra LR, Morais RKO, Medeiros FF. 2014. In vitro degradability and total gas production of biodiesel chain byproducts used as a replacement for cane sugar feed. Acta Scient Anim Sci. 36:399–403.
- Myers WD, Ludden PA, Nayigihugu V, Hess BW. 2004. Technical Note: a procedure for the preparation and quantitative analysis of samples for titanium dioxide. J Anim Sci. 82:179–183.
- NRC. 1996. Nutrient of requirements of beef cattle. 6th ed. Washington, DC, USA: The National Academic Press.
- NRC. 2000. Nutrient requirements of beef cattle. 7th ed. Washington, DC, USA: The National Academic Press.
- Rennó LN, Valadares RFD, Valadares Filho SC, Leão M I, Silva JFC, Cecon PR, Gonçalves LC, Dias HLC, Linhares RS. 2000. Plasma urea concentration and urea and creatinine excretions in steers. Rev Bras Zootecn. 29:1235–1243.
- Rennó LN, Valadares Filho SC, Paulino MF, Leão MI, Valadares RFD, Rennó FP, Paixão ML. 2008. Urea levels in diet for steers of four genetic groups: ruminal parameters, plasma urea, urea and creatinine excretions. Rev Bras Zootecn. 37:556–562.
- Russell JB. 2002. Rumen microbiology and its role in ruminant nutrition. Ithaca; p. 119.
- Russell JB, Wilson DB. 1996. Why are ruminal cellulolytic bacteria unable to digest cellulose at low pH? J Dairy Sci. 79:1503–1509.
- Silva TM, de Medeiros AN, Oliveira RL, Gonzaga Neto S, Queiroga Rde C, Ribeiro RD, Leão AG, Bezerra LR. 2016. Carcass traits and meat quality of crossbred Boer goats fed peanut cake as a substitute for soybean meal. J Anim Sci. 93:2998–3005.
- Smart AJ, Schacht WH, Moser LE, 2001. Predicting leaf/stem ratio and nutritive value in grazed and nongrazed big bluestem. Agron J. 93:1243–1249.
- Souza ADV, Fávaro SP, Ítavo LCV, Roscoe R. 2009. Chemical characterization of seeds and press cakes of physic nut, radish and crambe. Pesq Agr Bras. 44:1328–1335.
- The R Core Team. 2014. R: a language and environment for statistical computing. Vienna, Austria: R Foundation for Statistical Computing. URL: http://www.R-project.org/.
- Tripathi MK, Mishra AS. 2007. Glucosinolates in animal nutrition: a review. Anim Feed Sci Technol. 132:1–27.
- Van Soest PJ. 1994. Nutritional ecology of the ruminant. 2nd ed. Ithaca: Cornell University Press; p. 476.
- Van Soest PJ, Robertson JB. 1985. Analysis of forages and fibrous foods. Ithaca: Cornell University.
- Van Soest PJ, Wine RH. 1968. Determination of lignin and cellulose in acid-detergent fiber with permanganate. J. Assoc Off Anal Chem. 51:780–785.
- Verbic J, Chen XB, Macleod NA, Ørskov ER. 1990. Excretion of purine derivatives by ruminants. Effect of microbial nucleic acid infusion on purine derivative excretion by steers. J Agric Sci. 114:243–248.
- Wallig MA, Belyea RL, Tumbleson ME. 2002. Effect of pelleting on glucosinolate content of Crambe meal. Anim Feed Sci Technol. 99:205–214.