
 ?Mathematical formulae have been encoded as MathML and are displayed in this HTML version using MathJax in order to improve their display. Uncheck the box to turn MathJax off. This feature requires Javascript. Click on a formula to zoom.
Abstract
This meta-analysis aims to identify if there are differences between the weight of lamb carcases and their main characteristics according to the production systems and type of feeding around the word. Lambs finished on feeding supplement (with or without supplement) and production system (feed-lot or free-range) were analysed. Data from 21 controlled studies were used, the variables of interest in the meta-analysis include: initial body weight (IBW, kg), final body weight (FBW, kg), hot carcase weight (HCW, kg), cold carcase weight (CCW, kg), area of longissimus dorsi (ALd, cm2), subcutaneous dorsal fat thickness (SFT, mm) and slaughter weight (kg). The high heterogeneity (>98%) found in this study may be due to many factors (breed, climate, age and management). Furthermore, the number of animals allocated for each treatment and the lack of repetitions make it difficult to correctly understand the effect of feeding and production system on the lamb meat. Lambs finished in a feedlot or with supplementation under extensive systems exhibit faster growth rates, achieve target weights quicker, and produce heavier carcase weights when compared to grazing lambs.
Lambs finished in a feedlot or with supplementation under extensive systems exhibit faster growth rates compared to grazing lambs.
Lambs finished in a feedlot or with supplementation under extensive systems achieve target weights quicker compared to grazing lambs.
Finishing lambs on high-quality pasture can produce satisfactory growth rates without compromising characteristics of carcase.
Highlights
Introduction
In recent years there has been an increase in free trade agreements between most countries, which lead to greater trade openness and a new balance between economies (OECD-FAO Citation2013). Delgado (Citation2003) commented that globalisation was a factor that increased the consumption of meat in developing countries due to lower prices. However, Henchion et al. (Citation2014) mentions that the tendency in the consumption of the meat will be influenced by the quality before the price in the choice of the consumer.
In addition to customs or traditions, globalisation is also changing the market for lamb meat. For example, Mediterranean countries consume light carcases (Santos et al. Citation2007), while Germany, Australia, France and the United Kingdom, prefer heavier carcases (Beriain et al. Citation2000). Asian countries consume older and fattier animals. One factor that modifies the quality of these carcases is the breed, because some breeds deposit more fat at an earlier age, these are called early breeds (Hopkins et al. Citation2011). Table describes the most common breeds of lamb produced around the world, their slaughter weight, carcase weight and yield.
Table 1. Body characteristics of the most common sheep breeds in the world.
Feeding grains to animals compete with grain used for human food, while improved use of grasslands is more efficient in converting energy into food (Kratli et al. Citation2013). It is also important to note that these production systems must comply with animal welfare and environmental care, which consumers perceive as ‘quality products’ (Pethick et al. Citation2011). Improved use of grasslands is an efficient way of converting energy into food, therefore, global lamb meat production, largely based on grazing systems are expected to grow rapidly in countries such as China, India, Sudan and Nigeria (Echávarria Citation2013; OECD-FAO Citation2013).
The main consuming countries of this meat are the United Kingdom, France and USA (Gardner et al. Citation2010; OECD-FAO Citation2013). Australia and New Zealand are the largest producers, whose combined shipments account for 75% of the global lamb trade, where New Zealand exported 47% (Morris Citation2009). The main market for lamb meat is the European Union, they imported 40% of the word lamb meat in 2013. However, in recent years there has been an effort to diversify exports to new countries in the Northern Asian region (China, Japan, South Korea and Taiwan) (Morris and Kenyon Citation2014).
The objective of this study was to perform a meta-analysis to identify if there are differences between the weight of the lamb carcases and their main characteristics according to the production systems and type of feeding.
Materials and methods
Data collection
The search for information focussed on studies with lamb carcases produced in different types of production systems and in different geographical areas. The publications were obtained from searches in different databases such as Scopus and Web of Science (WOS). Search strings consisted of words associated with the particular topic, in combination with the use of operators (‘and’ or ‘or’). In the extensive search, the occurrence of all terms within a string was checked by title, abstract, and keywords (i.e. the ‘topic’ option in the ‘Web of Science’ and ‘ALL’ for all Terms or ‘TITLE-ABS-KEY’ for title, abstract and keywords in Scopus). The terms used in the search of the database were as follows: term 1 ‘carcase’; term 2 ‘sheep’ or ‘lamb’; term 3 ‘system’; term 4 ‘feeding’; term 5 ‘prediction’; term 6 ‘composition’; term 7 ‘characteristic’; term 8 ‘hot carcase’ or ‘cold carcase’; term 9 ‘weight’ and any plurality of the terms, at the end 54 studies were identified.
Inclusion criteria
The selection process limits the results to published works from 2005 to 2015. For inclusion in the final database, the work must be on lamb from 1) feed-lot production system (in this production system the animals are kept confined in pens that have all the necessary equipment for their care) (Grooms and Kroll Citation2015) or 2) free-range (in this production system the animals graze on pastures and fodder trees throughout the day, and may or may not return to the farm at night) (Gaspar et al. Citation2008). Diets in the studies can only be with or without supplement (concentrate) but without any supplement of synthetic growth promoter (i.e. steroidal type, somatotropins or β-agonists).
Each work was codified individually; papers presenting more than one experiment were individually annotated and worked separately. The selected articles must include the following information: 1) genotype type of the lamb (wool or hair), 2) specify clearly the procedure used to randomly assign animals to treatment and control groups, 3) provide enough information to determine effect size (EF) of the variables of interest in the meta-analysis, and 4) report information on sample size and variability of the variables of interest (i.e. standard deviation, standard error of mean, etc.). The variables of interest in the meta-analysis include: final body weight (FBW, kg), hot carcase weight (HCW, kg), cold carcase weight (CCW, kg), area of longissimus dorsi (ALd, cm2), subcutaneous dorsal fat thickness (SFT, mm) and slaughter weight (kg).
The articles were delimited according to their geographical region, dividing them into three categories depending on the geographical location where the study was carried out, considering the tropics of cancer and capricorn (Intertropical Zone, Northern Hemisphere Zone and Hemisphere South Zone), for which the criterion of the international mobilisation of animal genetic resources initiated at the beginning of the 19th century was taken, since the transfer of breeding animals was promoted around the world, first in Europe or between the colonial powers (Northern hemisphere), later the European breeds settled in the southern hemisphere and finally in the intertropical zone (FAO Citation2010).
The remaining 54 references were required to include a control treatment group, lambs finished in a feedlot or with supplementation under extensive systems, and measures of sample variance or information to calculating it (i.e. test statistics and p values). The final data set contained 21 studies from the remaining 9 research papers.
Meta-analytical procedure
Fixed and random effects models were implemented using the metacont function of the Meta package in the R software. The studies generally vary in the number of animals used and variance, for this reason the inverse variance weighting was used to pooling the trial’s incomes, with the aim that larger studies should carry more ‘weight’ in the meta-analytical procedure and contribute more to estimates of overall effect.
Two separate meta analyses were carried out: the first to evaluate the effect of inclusion of concentrate in the lamb’s ration on FBW and carcases characteristics (HCW, CCW, ALd and SFT thickness). The second one, analysed the effect of lamb feed management (feedlot and free range) on live body weight and carcases characteristics. All response variables were continuous data, therefore were analysed using standardised mean difference (SMD), which is also called EF, in which the difference between treatment and control group means are standardised using the standard deviations of control and treatment groups (Hedges Citation1981).
The estimation of fixed and random effects was calculated as Dersimonian and Laird (Citation1986). The analysed studies where different enough that, despite collecting a very large set of data so as to minimise the effect of random variation, they estimated different quantities; for this reason, a random-effect analysis was applied.
A benefit of using random effects models in meta-analysis is that it can be extended to mixed models to detect sources of heterogeneity. The random effects model assumes that the heterogeneity is purely random. However, the differences between effects size can be associated with systematic and study-level variables (moderator variables). Moderator variables were identified and incorporated to the mixed model as fixed effects. The used moderator variables were: geographical region (Intertropical Zone, Northern Hemisphere Zone and Hemisphere South Zone), country, breed and adult size (small, medium and big). The moderator variables first were examined one moderator at a time, and follow the influence of multiple predictor on the outcome were evaluate together follow a step-wise process.
Between studies, heterogeneity was quantified using the I2 statistic, which describes the percentage of the total variation across studies that is due to heterogeneity rather than chance (Lean et al. Citation2009). The I2 statistic was calculated as follows:
(1)
(1)
where Q is the X2 heterogeneity statistic and k is the number of trials. A value of heterogeneity greater than 50% can be considered as substantial heterogeneity (Appuhamy et al. Citation2013). All analysis was conducted in R statistical software (R Core Team Citation2016) using the ‘meta’ package version 4.6-0 (Schwarzer Citation2016).
Results and discussion
The meta analysis in this paper summarised the effects of feed type and production system on the lamb meat or carcase. Forest plots obtained through fixed and random effect analysis present some visual evidence of the presence of heterogeneity in a few response variables. The confidence intervals of some studies within the respective responsive variables illustrated in Figures did not overlap, and others did not intersect with the line of no effect (zero). Heterogeneity could be suspected because there was likely to be more variation among the results from studies than what would be expected by chance (Borenstein et al. Citation2009).
Figure 1. Forest plot diagram of the effect on the characteristics on the slaughter in carcase lambs fed with and without supplement. The x-axis shows the difference of standardised means (standardised by the z-statistic); therefore, the points to the left of the line represent a reduction in the trait, while the points to the right of the line indicate an increase. Each square represents the size of the mean effect of that study, and the size of the square reflects the relative weight of the study of the overall estimate of effect size with the larger squares representing a larger weight. The upper and lower bound of the squared line represents the upper and lower confidence intervals of 95% for the size of the effect. The diamond at the bottom represents the 95% confidence interval for the global estimate, and the vertical line of points represents the mean difference of zero or no effect.
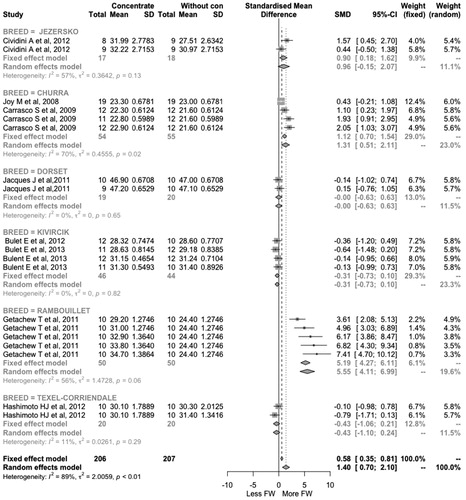
Figure 2. Forest plot diagram of the effect on the hot carcase weight (HCW) in lambs fed with and without supplement. The x-axis shows the difference of standardised means (standardised by the z-statistic); therefore, the points to the left of the line represent a reduction in the trait, while the points to the right of the line indicate an increase. Each square represents the size of the mean effect of that study, and the size of the square reflects the relative weight of the study of the overall estimate of effect size with the larger squares representing a larger weight. The upper and lower bound of the squared line represents the upper and lower confidence intervals of 95% for the size of the effect. The diamond at the bottom represents the 95% confidence interval for the global estimate, and the vertical line of points represents the mean difference of zero or no effect.
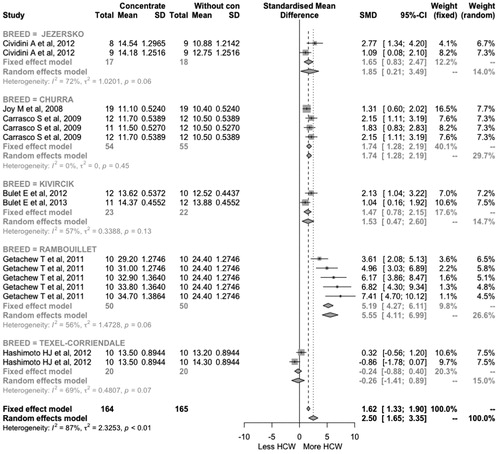
Figure 3. Forest plot diagram of the effect on the cold carcase weight (CCW) in lambs fed with and without supplement. The x-axis shows the difference of standardised means (standardised by the z-statistic); therefore, the points to the left of the line represent a reduction in the trait, while the points to the right of the line indicate an increase. Each square represents the size of the mean effect of that study, and the size of the square reflects the relative weight of the study of the overall estimate of effect size with the larger squares representing a larger weight. The upper and lower bound of the square line represents the upper and lower confidence intervals of 95% for the size of the effect. The diamond at the bottom represents the 95% confidence interval for the global estimate, and the vertical line of points represents the mean difference of zero or no effect.
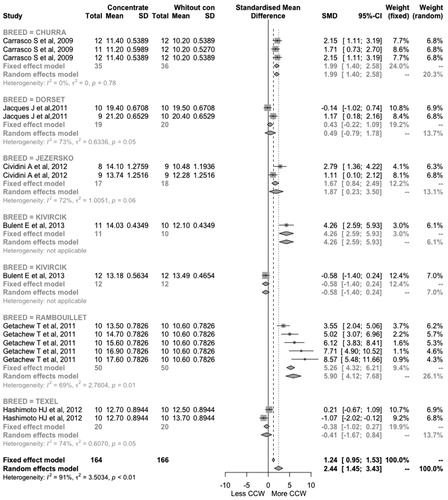
Figure 4. Forest plot diagram of the effect on the area of longissimus dorsi (ALd) in lambs fed with and without supplement. The x-axis shows the difference of standardised means (standardised by the z-statistic); therefore, the points to the left of the line represent a reduction in the trait, while the points to the right of the line indicate an increase. Each square represents the size of the mean effect of that study, and the size of the square reflects the relative weight of the study of the overall estimate of effect size with the larger squares representing a larger weight. The upper and lower bound of the square line represents the upper and lower confidence intervals of 95% for the size of the effect. The diamond at the bottom represents the 95% confidence interval for the global estimate, and the vertical line of points represents the mean difference of zero or no effect.
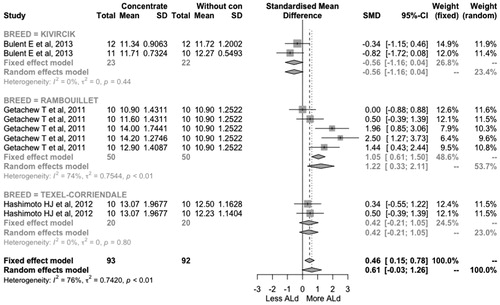
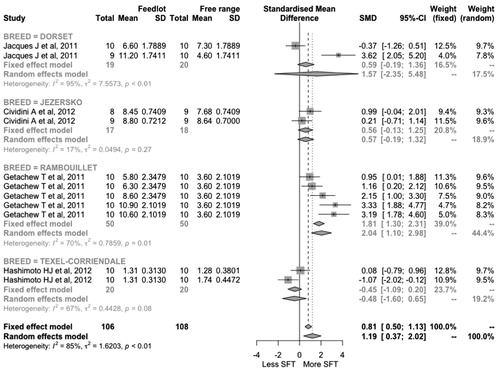
Figure 5. Forest plot diagram of the effect on the subcutaneous fat thickness lambs fed with and without supplement. The x-axis shows the difference of standardised means (standardised by the z-statistic); therefore, the points to the left of the line represent a reduction in the trait, while the points to the right of the line indicate an increase. Each square represents the size of the mean effect of that study, and the size of the square reflects the relative weight of the study of the overall estimate of effect size with the larger squares representing a larger weight. The upper and lower bound of the squared line represents the upper and lower confidence intervals of 95% for the size of the effect. The diamond at the bottom represents the 95% confidence interval for the global estimate, and the vertical line of points represents the mean difference of zero or no effect.
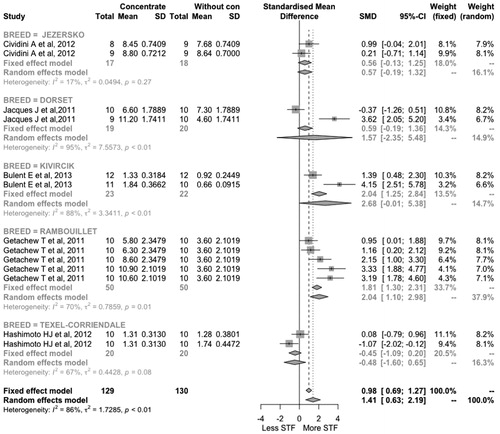
Figure 6. Forest plot diagram of the effect on the final body weight (FBW) (kg) in lambs fed in Feed-Lot or Free Range systems. The x-axis shows the difference of standardised means (standardised by the z-statistic); therefore, the points to the left of the line represent a reduction in the trait, while the points to the right of the line indicate an increase. Each square represents the size of the mean effect of that study, and the size of the square reflects the relative weight of the study of the overall estimate of effect size with the larger squares representing a larger weight. The upper and lower bound of the square line represents the upper and lower confidence intervals of 95% for the size of the effect. The diamond at the bottom represents the 95% confidence interval for the global estimate, and the vertical line of points represents the mean difference of zero or no effect.
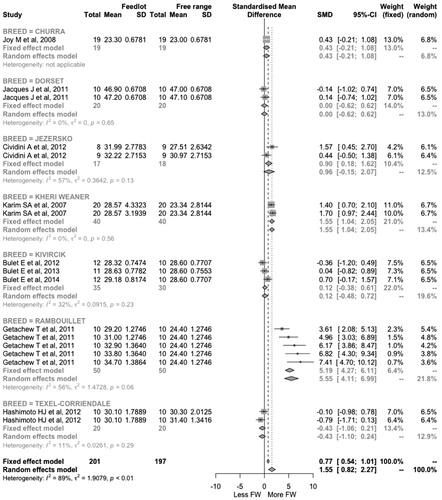
Figure 7. Forest plot diagram of the effect on the hot carcase weight (HCW) in lambs fed in Feed-Lot or Free Range systems. The x-axis shows the difference of standardised means (standardised by the z-statistic); therefore, the points to the left of the line represent a reduction in the trait, while the points to the right of the line indicate an increase. Each square represents the size of the mean effect of that study, and the size of the square reflects the relative weight of the study of the overall estimate of effect size with the larger squares representing a larger weight. The upper and lower bound of the square line represents the upper and lower confidence intervals of 95% for the size of the effect. The diamond at the bottom represents the 95% confidence interval for the global estimate, and the vertical line of points represents the mean difference of zero or no effect.
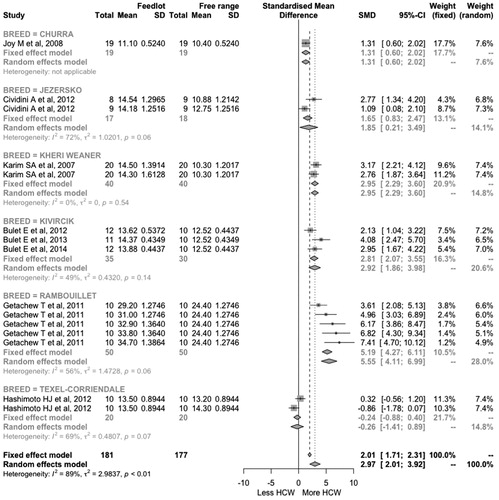
Figure 8. Forest plot diagram of the effect on the cold carcase weight (CCW) in lambs fed in Feed-Lot or Free Range systems. The x-axis shows the difference of standardised means (standardised by the z-statistic); therefore, the points to the left of the line represent a reduction in the trait, while the points to the right of the line indicate an increase. Each square represents the size of the mean effect of that study, and the size of the square reflects the relative weight of the study of the overall estimate of effect size with the larger squares representing a larger weight. The upper and lower bound of the square line represents the upper and lower confidence intervals of 95% for the size of the effect. The diamond at the bottom represents the 95% confidence interval for the global estimate, and the vertical line of points represents the mean difference of zero or no effect.
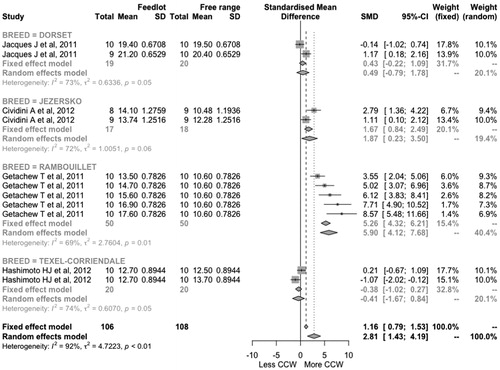
Figure 9. Forest plot diagram of the effect on the area of the longissimus dorsi in lambs fed in Feed-Lot or Free Range systems. The x-axis shows the difference of standardised means (standardised by the z-statistic); therefore, the points to the left of the line represent a reduction in the trait, while the points to the right of the line indicate an increase. Each square represents the size of the mean effect of that study, and the size of the square reflects the relative weight of the study of the overall estimate of effect size with the larger squares representing a larger weight. The upper and lower bound of the squared line represents the upper and lower confidence intervals of 95% for the size of the effect. The diamond at the bottom represents the 95% confidence interval for the global estimate, and the vertical line of points represents the mean difference of zero or no effect.
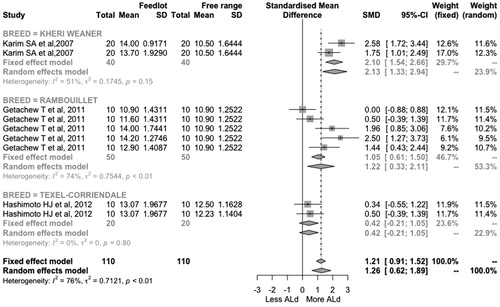
Figure 10. Forest plot diagram of the effect on the subcutaneous fat thickness in lambs fed in Feed-Lot or Free Range systems. The x-axis shows the difference of standardised means (standardised by the z-statistic); therefore, the points to the left of the line represent a reduction in the trait, while the points to the right of the line indicate an increase. Each square represents the size of the mean effect of that study, and the size of the square reflects the relative weight of the study of the overall estimate of effect size with the larger squares representing a larger weight. The upper and lower bound of the square line represents the upper and lower confidence intervals of 95% for the size of the effect. The diamond at the bottom represents the 95% confidence interval for the global estimate, and the vertical line of points represents the mean difference of zero or no effect.
The high heterogeneity (>98%) found in this study may be due to many factors (i.e. breed, climate, age and management), as well as the number of animals assigned for each treatment and the lack of repetitions make it difficult to correctly understand the effect of feeding and production system in the lamb meat and the quality of the meat (De Brito et al. Citation2017). The mixed models of both meta analyses tested the inclusion of moderator variables (geographical region, country, breed and adult size) with the objective of reducing heterogeneity. When the influence of moderator variables was examined simultaneously some redundant variables were identified, which showed evidence of multicollinearity; for instance, the sheep breed is usually correlated with the country and adult size, whereby the explicative effect of these variables goes in the same direction and similar magnitude since these are highly linearly related, and their joint inclusion in the mixed model does not reduce heterogeneity significantly. On the other hand, when the moderator variables were examined individually the sheep breed showed the largest capacity to reduce heterogeneity. For this reason, the final mixed models only included the breed as fixed effect.
The FBW gain and longissimus dorsi area as an index of muscle growth were higher (Tables and , p < .01) in lambs that receive supplementation (Figures and ) and the feedlot production system (Figures and ), the published information indicated that the longissimus dorsi area linearly increased with increase in FBW (Karim et al. Citation2007), but a lack of replication and low numbers of animals per treatment does suggest caution when interpreting this results.
Table 2. Effect of the supplement on the carcase characteristics of lambs.
Table 3. Effect of the production system (feedlot or free-range) on the carcase characteristics in lambs.
The HCW and CCW were higher (Tables and , p < .01) in lambs that received supplementation (Figures and ) and the feedlot production system (Figures and ) which is similar to Sheridan et al. (Citation2003). Between higher fibre content in the diet, greater intestinal content and lower performance of the carcase (Gardner et al. Citation2015). Forage increases the digestive content, because the increase of the fibre increases their time of permanence in the rumen and the whole gastrointestinal tract (Xu et al. Citation2014).
In contrast, a recent study indicated that the carcases of lambs in the free-range production system with respect to the feedlot system were equivalent, due to the use of good quality forages and pastures in rations for lambs in the fattening phase. This allows the adequate contribution of a good part of the nutrients that they require, in addition to reducing the costs of production when compared to the diet with concentrates (Ponnampalam et al. Citation2014). It is important to emphasise that pasture-based lamb production requires lower levels of external inputs, it preserves traditional lamb production in many regions (Aguayo-Ulloa et al. Citation2013) and provides a high level of animal welfare (McGlone Citation2001).
The thickness of the dorsal fat (Figure ) was higher (Table , p < .01) in lambs that received concentrate. Crouse et al. (Citation1978) found that diets with more energy tend to deposit more fat. According to Kozloski (Citation2009) and Riegel (Citation2012) the increase in the level of concentrate in the diet causes an alteration in the level of volatile fatty acids (VFAs), with an increase of propionate and a decrease of acetate, this contributes to the increase in energy as a glycogen, being available for the metabolism of the animal, favouring a greater deposition of subcutaneous fat and a greater production of muscle mass as a result of the energy economy in the oxidation of neo-glycogenic amino acids (Cacere et al. Citation2014). However, furthermore the market preference is changing towards ‘healthy’ food (Zervas and Tsiplakou Citation2011), meaning that animals raised on extensive feeding systems can be a good strategy to meet the consumer demand for lean meat (De Brito et al. Citation2017). Forgaty (Citation2009) commented that the Australian lamb meat industry has had great increase in lamb production and profitability, due to the genetic improvement in growth rate, the decrease in fat deposition, and an increase in the muscles with lamb fed only pasture.
Likewise, the thickness of the dorsal fat (Figure ) in lamb in a feedlot production system was higher (Table , p < .01), and it is reasonable to state that this can be due, in part, to the greater physical activity of lambs grazing, which is associated with greater energy expenditure (Murphy et al. Citation1994).
Conclusions
Lambs finished in a feedlot or with supplementation under extensive systems exhibit faster growth rates, achieve target weights quicker, and produce heavier carcase weights when compared to grazing lambs. However, this study shows that extensive system lambs finished on high-quality pasture can produce satisfactory growth rates without compromising carcase and meat quality traits.
Since lamb production under extensive feeding systems, does not seem to compromise growth it can be an important strategy to decrease spending on inputs and to produce meat in a way that respects the environment, animal welfare, and which also produces ‘healthier’ meat for human consumption. Due to the high variability between selected studies, further studies are necessary to better understand the response from lambs in different feeding systems (feed lots, free range or in extensive systems with supplementation).
Disclosure statement
No potential conflict of interest was reported by the authors.
Additional information
Funding
References
- Aguayo-Ulloa LA, Miranda-de la Lama GC, Pascual-Alonso M, Fuchs K, Olleta JL, Campo MM, Alierta S, Villarroel M, Maria GA. 2013. Effect of feeding regime during finishing on lamb welfare, production performance and meat quality. Small Rumin Res. 111:147–156.
- Appuhamy JA, Strathe AB, Jayasundara S, Wagner-Riddle C, Dijkstra J, France J, Kebreab E. 2013. Anti-methanogenic effects of monensin in dairy and beef cattle: a meta-analysis. J Dairy Sci. 96:5161–5173.
- Beriain MJ, Horcada A, Purroy A, Lizaso G, Chasco J, Mendizabal JA. 2000. Characteristics of lacha and rasa aragonesa lambs slaughtered at three live weights. J Anim Sci. 78:3070–3077.
- Borenstein M, Hedges LV, Higgins JPT, Rothstein HR. 2009. Introduction to meta-analysis. Chichester, UK: John Wiley & Sons, Ltd.
- Cacere RAS, Morais MG, Alves FV, Feijó GLD, Ítavo CCBF, Ítavo LCV, Oliveira LB, Ribeiro CB. 2014. Quantitative and qualitative carcass characteristics of feedlot ewes subjected to increasing levels of concentrate in the diet. Arq Bras Med Vet Zootec. 66:1601–1610. ISSN 0102-0935.
- Crouse JD, Field RA, Chant JL, Ferrell JCL, Smith GM, Harrison VL. 1978. Effect of dietary energy intake on carcass composition and palatability of different weight carcasses from ewe and ram lambs. J Anim Sci. 47:1207.
- De Brito GF, Ponnampalam EN, Hopkins DL. 2017. The effect of extensive feeding systems on growth rate, carcass traits, and meat quality of finishing lambs. Compr Rev Food Sci Food Saf. 16:23–38.
- Delgado CL. 2003. Rising consumption of meat and milk in developing countries has created a new food revolution. J Nutr. 133:3907S–3910S.
- Dersimonian R, Laird N. 1986. Meta-analysis in clinical trials*. Control Clin. 7:177–188.
- Echávarria V. 2013. Carne ovina. Oficina de estudios y políticas agrarias. [accessed 2016 Aug 3] www.Odepa.gob.cl.
- FAO. 2010. Origen y distribución de los recursos zoogenéticos. [accessed 2017 Nov 7] ftp://ftp.fao.org/docrep/fao/010/a1260s/a1260s03.pdf.
- Forgaty NM. 2009. Meat sheep breeding—where we are at and future challenges. Proceedings of the Association for the Advancement of Animal Breeding and Genetics, Armidale, Australia: Association for the Advancement of Animal Breeding and Genetics. p. 414–421.
- Gardner GE, Williams A, Ball AJ, Jacob RH, Refshauge G, Hocking Edwards J, Behrendt R, Pethick DW. 2015. Carcass weight and dressing percentage are increased using Australian Sheep Breeding Values for increased weight and muscling and reduced fat depth. Meat Sci. 99:89–98.
- Gardner GE, Williams A, Siddell J, Ball AJ, Mortimer S, Jacob RH, Pearce KL, Edwards JEH, Rowe JB, Pethick DW. 2010. Using Australian sheep breeding values to increase lean meat yield percentage. Anim Prod Sci. 50:1098–1106.
- Gaspar P, Escribano M, Mesías FJ, Ledesma A. R d, Pulido F. 2008. Sheep farms in the Spanish rangelands (Dehesas): typologies according to livestock management and economic indicators. Small Rumin Res. 74:52–63.
- Grooms DL, Kroll LAK. 2015. Indoor confined feedlots. Vet Clin North Am Food Anim Pract. 31:295–304.
- Hedges LV. 1981. Distribution theory for glass’s estimator of effect size and related estimators. J Educ Behav Stat. 6:107–128.
- Henchion M, McCarthy M, Resconi VC, Troy D. 2014. Meat consumption: trends and quality matters. Meat Sci. 98:561–568.
- Hopkins DL, Fogarty NM, Mortimer SI. 2011. Genetic related effects on sheep meat quality. Small Rumin Res. 101:160–172.
- Karim SA, Porwal K, Kumar S, Singh VK. 2007. Carcass traits of Kheri lambs maintained on different systems of feeding managements. Meat Sci. 76:395–401.
- Kozloski GV. 2009. Bioquímica dos ruminantes. 2nd ed. Santa Maria: da UFSM; p. 98.
- Kratli S, Huelsebusch C, Brooks S, Kaufmann B. 2013. Pastoralism: a critical asset for global food security under climate change. Animal Front. 3:42–51.
- Lean IJ, Rabiee AR, Duffield TF, Dohoo IR. 2009. Invited review: use of meta-analysis in animal health and reproduction: methods and applications. J Dairy Sci. 92:3545–3565.
- McGlone JJ. 2001. Farm animal welfare in the context of other society issues: toward sustainable systems. Livest Prod Sci. 72:75–81.
- Morris ST. 2009. Economics of sheep production. Small Rumin Res. 86:59–62.
- Morris ST, Kenyon PR. 2014. Intensive sheep and beef production from pasture-a New Zealand perspective of concerns, opportunities and challenges. Meat Sci. 98:330–335.
- Murphy TA, Loerch SC, McClure KE, Solomon MB. 1994. Effects of restricted feeding on growth performance and carcass composition of lambs. J Anim Sci. 72:3131–3137.
- OECD-FAO. 2013. Agricultural outlook 2012–2021. Paris, France: OECD.
- Partida PJA, Braña VD, Jiménez SH, Ríos RFG, Buendía RG. 2013. Producción de carne ovina. Centro nacional de investigación disciplinaria en fisiología y mejoramiento animal. Ajuchitlán Qro Libro Técnico INIFAP. 5:68.
- Pethick DW, Ball AJ, Banks RG, Hocquette JF. 2011. Current and future issues facing red meat quality in a competitive market and how to manage continuous improvement. Anim Prod Sci. 51:13–18.
- Ponnampalam EN, Hopkins DL, Bekit A. 2014. Predicting color and flavor stabilities of meat from pre-slaughter assessments. Final report. Project Number A.MQA.006. North Sydney, NSW, Australia: Meat & Livestock Australia Limited.
- R, C.T. 2016. R: a language and environment for statistical computing. Vienna, Austria: R: A Language and Environment for Statistical Computing.
- Riegel RE. 2012. Bioquímica. 5th ed. São Leopoldo: Unisinos; p. 197.
- Santos VAC, Silva SR, Mena EG, Azevedo JMT. 2007. Live weight and sex effects on carcass and meat quality of “borrego terrincho-PDO” suckling lambs. Meat Sci. 77:654–661.
- Sheridan R, Ferreira AV, Hoffman LC. 2003. Production efficiency of South African Mutton Merino lambs and Boer goat kids receiving either a low or a high energy feedlot diet. Small Rumin Res. 50:75–82.
- Schwarzer G. 2016. Meta: general package for meta-analysis. R News. 7:40–45.
- Xu J, Hou Y, Yang H, Shi R, Wu C, Hou Y, Zhao G. 2014. Effects of forage sources on rumen fermentation characteristics, performance, and microbial protein synthesis in midlactation cows. Asian Australasian J Anim Sci. 27:667–673.
- Zervas G, Tsiplakou E. 2011. The effect of feeding systems on the characteristics of products from small ruminants. Small Rumin Res. 101:140–149.