
Abstract
For over three centuries, thoroughbred (TB) horses have been selected exclusively for traits enhancing racing performances. Officially the TB origins can be genetically traced back along the male line due to the crossbreeding among 50 English royal mares and four Arab oriental stallions in 1700s. Because of the TB population is tightly controlled, possible loss of genetic variability should be carefully evaluated for breed conservation and management programme. To this aim FTA® cards of 10032 TB foals over a 14-year new-born campaign period were collected for genetic variability evaluation using 16 microsatellite markers. Total number of allele was 118 with a mean value of 7.37 alleles per locus; Polymorphic information content (PIC) values were above the informative threshold (PIC >0.5) for all microsatellites except for HTG4 and HMS2 whereas no significant differences were showed between the mean expected (He) and observed heterozygosity (Ho) values (0.674 vs. 0.675, respectively). Hardy–Weinberg proportion exhibited no statistically significant deviation from equilibrium (p < .05) for all loci; the inbreeding coefficient mean was close to zero suggesting very low probability of autozygosity. The number of genotypes observed (Ng) was calculated for each microsatellite and the most representative was found at the HMS2 locus (LL, frequency 0.557). Parentage testing was also investigated reporting a combined probability of identity (PI) for the 16 loci of 4.1 × 10⁻¹⁴ while the probability of exclusion (PE) exceeded 99% in all cases. Overall data reported a reasonable level of informativeness which genuinely reflect the narrower genetic structure of the Thoroughbred population.
Thoroughbred population from Italy did not show any significant evidence for close inbreeding; a moderate level of genetic diversity was found at some loci yet still adequate for parentage and identity verification.
Appropriate management programme could be placed to introduce new genetic variability in the Italian Thoroughbred population.
Highlights
Introduction
Historically the origins of the thoroughbred (TB) horse are traced back to the 1700s driven by the enthusiasm of the British aristocracy for horse racing (Cassidy Citation2002). Officially TB breed was formed by crossing a restricted group of selected English native mares (the Royal Mares) with four Arab oriental stallions (Hewitt Citation2006) from which the whole line of modern race thoroughbreds is today recognised to descend (Cunningham et al. Citation2001). It’s been estimated that roughly one third of the genes of the current TB population comes from the foundation sires and more than a 50% is due to the top 10 horses described by Cunningham (Citation1991); if the ancestors contributing at 1% or more are included, the genealogy extends of 21 more horses raising overall about 80% of the modern TB gene asset (Cunningham Citation1991). Since then TB horses have been artificially selected for centuries uniquely for strength and speed traits enabling superior performances in races. As the intense selective breeding process proliferated the need of a pedigree registry became apparent in the second half of the 1700s. Formal rules of racing were detailed and the first Studbook was then published to keep record of the horses competing and pedigrees (Weatherby Citation1791).
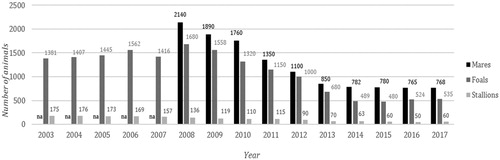
The first genealogical Book of the Italian-born TB horses was inaugurated in 1875. Nowadays the Italian Ministry of Agriculture (MIPAAFT) is recognised as Studbook keeper and sole authority allowed to register TB horses (MIPAAFT Citation2018). To maintain the book integrity, horse breeders have to provide foals parentage records to the Italian Authority which validates the declared genealogy and generates the pedigree for registration. Currently the estimated TB horse population in Italy is approximately 91,000 and a limited stallion-to-mare covering ratio has been observed over the last few years which may negatively impacts the genetic diversity (MIPAAFT Citation2018) (Figure ). Further concerns raise from the limited genetic line of the breed enhanced by a selective conservation programme which makes the TB population considerably controlled. Because of the closed population structure the genetic variability should then be carefully monitored to gain comprehensive information for breed management and conservation (Cunningham Citation2001). It’s today worldwide accepted that safeguarding of the TB breed relies on DNA genotyping test by using STRs microsatellite markers (Binns et al. Citation1995; Bowling et al. Citation1997). Because of the co-dominant mode of inheritance and the discriminant power the use of Short Tandem Repeats represents an effective support to estimate genetic diversity, confirm individual identification and define unambiguous parentage in horses (Kakoi et al. Citation2001; Tozaki et al. Citation2001; Ling et al. Citation2011; Dorji et al. Citation2018). To our knowledge no genetic population studies to evaluate microsatellite informativeness have so far been reported for the Italian Thoroughbred population. To this aim genetic variability of the Thoroughbred horse population from Italy has been investigated using a total of 16 microsatellite loci. Insight will also be provided regarding the microsatellite panel efficacy for parentage and identity verification.
Figure 1. Total number of mares/stallions and new-born foal in Italy since 2003 (MIPAAFT Citation2018). Na: data not available.
Materials and methods
DNA extraction and microsatellite analysis
FTA® Card (Flinders Technology Associates, Whatman, United Kingdom) provides a cost-effective method for collecting and processing nucleic acids from a wide variety of matrices (e.g. blood spot) (Whatman Inc. Citation2003). Purification of sample spotted onto the FTA paper involves washing of the filter disc followed by drying and PCR in situ as the DNA remains immobilised on the matrix. FTA cards of 10,032 TB foals over a 14-year new-born campaign period (2003–2017) were collected for pedigree verification as determined by the Italian Authority [MIPAAFT]. Genomic DNA was recovered by punching a 1.2 mm FTA disk into a 96-well plate using a BSD 600 Duet automated Puncher (Microelectronic Systems, Brendale, Queensland, Australia). To meet high throughput demands DNA extraction and genotyping procedures have been performed both in a single plate using a liquid handling system (MicroLab Star, Hamilton Robotics, USA) (Tack et al. Citation2007). DNA fragments were co-amplified in a multiplex PCR using the Equine Genotypes Panel 1.1 Kit (ThermoFisher Scientific, Waltham, Massachusetts, USA) according to manufacturer instructions. The kit includes 12 loci recommended by the Equine Genetics and Thoroughbred Parentage Testing Standardization Committee of the ISAG and 5 extra markers: AHT4, AHT5, HMS2, HMS6, HMS7, HTG4, VHL20, ASB2, HMS3, HTG10, ASB17, ASB23 and HTG6, HTG7, HMS1, CA425 and LEX3, respectively (not included in this study). Multiplex-PCR products were electrophoresized using the ABI PRISM 3130xl Genetic Analyzer (ThermoFisher Scientific, USA) and the Standard GeneScan-500 LIZ employed as size reference (ThermoFisher Scientific, USA).
Statistical analysis
Fragment analysis was performed using the GeneMapper ID v5.0 software (ThermoFisher Scientific, USA) and the allelic variants called according to the equine international nomenclature (Van de Goor et al. Citation2010). The total number of allele (Na) and their frequency (Af), the effective number of alleles (Ne), observed and expected heterozygosity (Ho and He, respectively), inbreeding coefficient (F) and the probability of identity and exclusion of a locus (PI and PE) were obtained using the GenAlEx v6.51 package for population genetic analyses (Peakall and Smouse Citation2012). The software was also employed to compute the Number of genotypes observed (Ng), the Major Genotype observed (Mgo) within the TB population and its frequency (Mgf) for each locus. Cervus 3.0.7 software (Kalinowski et al. Citation2007) was used to estimate the polymorphic information content (PIC), null allele frequency estimation (Nullf) and the deviation probability from the Hardy–Weinberg equilibrium (HWE) following sequential Bonferroni correction. The null allele frequency was estimated based on the observed and expected genotypes frequencies using ten iterations of the algorithm described by Summers and Amos (Citation1997). Parentage exclusion when the other parent is known (PE1), when the genotype of one parent is missing (PE2) and when a putative parent pair is excluded (PE3) were calculated following Jamieson and Taylor (Citation1997).
Results
A total of 10,032 TB foals were DNA-typed using 16 microsatellite marker and the data are presented in Tables . According to Barker (Citation1994) the microsatellite loci recommended for genetic diversity evaluation should have a number of alleles greater than 4 (Na>4) with an effective number of alleles per locus greater than 2 (Ne>2). The total number of alleles (Na) for the 16 microsatellites was 118 with an average of 7.375 alleles per locus ranging from 5 (HMS1) to 10 (HMS2). Effective number of alleles (Ne) showed a mean value of 3.385 ranging from 1.723 for HMS2 to 5.308 for ASB2 with a total number of alleles of 10 and 8 respectively. The mean Ne/Na ratio was then evaluated reporting a mean value of 0.465 with the highest value belonging to ASB2 (0.663) and the lowest to HMS2 (0.172). Polymorphic information content (PIC) values were above the informative threshold (PIC >0.5) (Summers and Amos Citation1997) for all microsatellites except for HTG4 (0.463) and HMS2 (0.394) whereas the highest value was registered for ASB2 (0.786) with an overall value of 0.625 on average for all loci. The observed heterozygosity (Ho) registered a mean value of 0.675 ranging from 0.816 (ASB2) to 0.422 (HMS2). No relevant differences were showed compared with the mean Expected Heterozygosity (He) value (0.674). Inbreeding coefficient (F) was calculated on the basis of He versus Ho and ranged from -0.008 (ASB17) to 0.010 (AHT4) with a mean value close to zero (0.0002). Hardy–Weinberg proportion was calculated and no statistically significant deviation from equilibrium (p < .05) was showed after sequential Bonferroni correction. The allelic frequencies at each microsatellite marker are showed in Table . The highest allele frequency was reported for the allele L at the HMS2 locus (0.747) while an uneven distribution was showed for the other alleles within the population. The number of genotypes observed (Ng) for each microsatellite varied from 8 (HMS1) to 36 (ASB2) and the average was 20.625. The most representative genotype was LL at the HMS2 locus found in more than a half of the tested individuals with a frequency of 0.557 (Table ). The null allele frequency ranged from −0.004 for ASB17 to 0.005 for CA425 with an average of 2 × 10⁻⁴ (Table ). Combined Probability of Identity (PI) for the 16 loci was 4.061 × 10⁻¹⁴ when random mating was assumed while decreasing to 2.701 × 10−06 for expected full-sib population. PI by locus varied from 0.061 for ASB2 to 0.362 for HMS2 (Table ) with an average of 0.166. Probability of exclusion (PE) for increasing locus combinations exceeded 99.99% when the other parent is known (PE1) and when a putative parent pair is excluded (PE3) whereas a 99.51% was obtained when the genotype of one parent is missing (PE2). PEs by locus are listed in Table .
Table 1. Genetic diversity indices in thoroughbred horses population based on 16 microsatellite markers.
Table 2. Allele frequencies for the thoroughbred horses from Italy based on 16 microsatellite marker.
Table 3. Genotypic information for the thoroughbred horse population based on the 16 microsatellite markers.
Table 4. Estimated PI and PE by locus for the thoroughbred horse population from Italy.
Discussion
As rule, the Italian TB Studbook includes horses foaled in Italy and/or imported as long as they have been recorded in any Studbook approved by the International Stud Book Committee (ISBC). To be registered, a TB foal must be the product of a live cover thereby pedigree verification plays a pivot role in protecting the studbook integrity and monitoring the genetic variability. A limited number of individuals are today used for breeding programmes making TB population at risk of loss of genetic variability. The aim of the present study was then to evaluate the genetic diversity for the Italian TB population and provide comprehensive data for parentage and identity testing using a panel of 16 ISAG microsatellite. A total of 10,032 Italian-born TB foals were genotyped and a reasonable level of genetic diversity was observed as indicated by the allele number, heterozygosity observed and PIC. According to Botstein et al. (Citation1980) when the expected heterozygosity and PIC values exceed 0.6 and 0.5, respectively, the microsatellite markers are considered to be highly informative. In the present study we found 4 STRs markers among 16 that did not reach the expected heterozygosity threshold value (CA425, HMS2, HTG4 and HTG6) and two of them had not PIC values higher than 0.5 (HMS2 and HTG4) showing consistent levels with the degree of markers informativeness. Locus HMS2 was found to be essentially the less polymorphic probably due to the lowest level of heterozygosity and PIC and because of the very high frequency of the allele L which was the most representative of all within the TB population (overall allele L count =14,981). A group of 5582 individuals out of 5795 total observed homozygotes was found to have LL genotype at this locus with a frequency of 0.557. Apparent excess of homozygotes and allele abundance were therefore investigated at all loci for possible large allelic dropouts leading to false genotyping and allele overestimation (Pemberton et al. Citation1995; Hoffman and Amos Citation2005; Okello et al. Citation2005). No evidence for null alleles was detected. The estimated null alleles frequency (Nullf) slightly varied from negative to positive values with an average close to zero assuming only a very low genotyping error rate (Nullf threshold <0.2) (Dakin and Avise Citation2004). Failure of scoring due to allelic non-amplification usually shows a characteristic homozygous–homozygous mismatch in known parent–offspring comparisons (Pemberton et al. Citation1995) hence we were prone to exclude it. Genotyping errors are also expected to cause deviation from the Hardy–Weinberg proportion; according to the data the observed heterozygosity did not differ significantly from the expected values which follow the pattern showed for the inbreeding coefficient. The mean inbreeding value and by locus were close to zero thereby confirming there was no evidence of homozygous excess for the TB population. Speculations from Binns et al. (Citation2012) suggest that inbreeding in TB has increased significantly over the last four decades. Few stallions are today covering much more mares than previously and top stallion can breed up to 200 mares leading to detrimental consequences such as increasing of the frequency of recessive genetic disorders. Our data reported no clear evidence of inbreeding occurrence while showing a lower genetic diversity of the population due to a smaller gene pool. Breeding season in Italy exhibited in the last decade a dramatically decreased number of foals per year with a stallion-to-mare mean covering ratio nearly to 1:14 which means 1 stallion every 10 new-born as average (Figure ). Selective breeding based on racing performance traits is today largely practiced worldwide; a trait happened to be uniquely expressed by an ancestor no longer available for breeding purpose is commonly used as reference in Thoroughbred line selection. Such a breeding strategy is a common way to propagate the gene pool from an outstanding ancestor while keeping low the inbreeding level as mates distantly related could give no suggestion for inbreeding because of a lower coefficient of relationship. However, while inbreeding can assure a trait is passed to offspring it could lead to negative side effects since the inbreeding coefficient might not reflect the presence of some hidden deleterious recessive alleles (Lacy et al. Citation1996; Hedrick and Garcia-Dorado Citation2016).
The effective number of alleles (Ne) is the number of alleles required to provide the same expected heterozygosity (He) as in the population, if they had the same frequency. The results of the present work showed a low Ne/Na ratio at some loci. Among the 16 markers, HMS2 showed the highest number of allele while having the lowest number of effective allele (10 vs. 1.723). Large discrepancies between Na and Ne at the given locus confirm the presence of low frequency alleles in the population and the predominance of only a few of them. A numbers of studies concerning genetic diversity in horses have been reported so far. Seo et al. (Citation2016) reported levels of heterozygosity and PIC of almost one order of magnitude higher than our study when the same microsatellite markers are used in Halla horses. Consistent with our study they also found high frequency of the allele L at the locus HMS2 (0.421) along with a high PIC informativeness (0.717). Surprisingly Cho (Citation2007) reported no evidence of the allele L at HMS2 locus for a small group of Thoroughbred horse (N = 26) while showing slightly lower observed heterozygosity and PIC levels compared with our study. However, genetic diversity indices for TB horses from Spain, France, Korea and Bosnia Herzegovina reported values comparable to ours with a few of exception (Lee and Cho Citation2006; Marletta et al. Citation2006; Leroy et al. Citation2009; Rukavian et al. Citation2016). These results may be explained by the widespread use of a relatively small number of individuals actively covering across the world although some countries are much more genetically involved than others. Because of the pedigree of a proven winner is still captivating for breeder, temporary or permanent importation/exportation for breeding purpose take place regularly spreading very similar variability across those TB populations. The results of our study involved uniquely Italian-born foals without taking into account the diversity of the imported stallions fraction. The Italian Equine Genetic Database (Unire Veterinari Citation2015) was therefore interrogated to retrieve the genetic profile of those stallions which covered the most in the last year in Italy (threshold >5 foals) to corroborate whether the lower informativeness at some loci could be attributed to a limited number of individuals and traced back to a well-defined geographical area or not. We found 27 stallions from Ireland, USA and Great Britain mainly, but also France and Italy, accountable for over 300 Italian-born TB foals. Allelic profiles were reviewed and the allele L at the HMS2 locus was found to be ubiquitous for all the stallions coherently with the observed foals pedigrees. Particularly, 16 of them carried the homozygous configuration and were responsible for over 200 new-born foals, 6 were heterozygous and a few of stallions were lacking of information at this locus; for these the allelic profiles were inferred from the fathers’ line which were found to carry at least one copy of the allele L. These findings support our data though they do not reflect the genetic diversity of the Italian TB population in sensu stricto; they rather refer to a larger percentage of the whole TB breed as consequence of the gene flow occurring among the donor countries. Because the genetic contribution from countries like Japan or Australia is poorly represented for the Italian thoroughbred population these results could be integrated with the data from the others studbooks by gathering information about those countries where the stallions are actively breeding the most.
The present study was also aimed to provide comprehensive information regarding the variability of the STRs markers in parentage and identity verification. The likelihood of observing two identical genotypes from two randomly chosen individuals was measured by assessing the Probability of Identity (PI); the microsatellite panel was also evaluated to estimate the probability of exclusion (PE) in TB horses. According to the recommendations provided by the International Stud Book Committee (ISBC) the PE in TB horse must be higher than 99.95% when running parentage test (Tozaki et al. Citation2001). Overall, we reported greater values for PE1 and PE3 whereas PE2 was below the ISBC threshold value although 4 more markers were included to the 12 required by the ISAG. The power of solving disputed parentage relies on the degree of informativeness of a marker which in turns depends on PIC, He and allele frequency values of the local population. Our study reported lacking of information for some loci, two of which (HMS2 and HTG4) are part of the ISAG Primary Equine DNA Panel. Thus we suggest that additional markers should be used to gain reliable combined PE value when the genotype of one parent is missing. On the other hand, the microsatellite markers showed to be suitable for individual identification.
Conclusions
In conclusion, the findings from the current study outlined that the TB breed from Italy is essentially less differentiated. The microsatellite panel used in present study showed that a few alleles are poorly represented within the population. However, a reasonable level of genetic diversity was found yet still adequate for pedigree verification. The data reported no clear evidence of close inbreeding occurrence; however the existence of a milder form of inbreeding due to a few remote common ancestors could be presumed by the lower genetic diversity detected. Appropriate management strategies could be then placed to introduce new variability among the Thoroughbred populations. Since TB selective breeding look mostly at speed traits some other non-apparently performance-related values (e.g. vigour) are usually neglected in breeding and often inadvertently bred out. As consequence the frequency of recessive alleles could then hiddenly increase and go unnoticed until a genetic disorder show up. Breeding by selecting different aptitudes from various TB strains might instead harmonise a fully set of performance-based traits as well as reduce the odds of recessive deleterious mutations inheritance. The foremost management approach is to look both at the pedigrees and studbooks before breeding to avoid mating among closely related individuals. The stallion-to-mares covering ratio should be kept as low as possible and the rate of inbreeding monitored to maximise genetic diversity while reducing the risk of loss of variability. Finally new genetic variability from those TB strains usually less contributing in Italy should be addressed while ensuring the protection of breed integrity.
Ethical approval
Samples were collected by authorised Veterinary on behalf of the Italian Ministry of Agriculture (MIPAAFT), which states and approve the sampling procedures.
Acknowledgements
The authors wish to thank Stefania Zattini from the Italian Ministry of Agriculture (MIPAAFT) for providing valuable information concerning the Italian Thoroughbred Studbook. The authors received no specific funding for this work.
Disclosure statement
No potential conflict of interest was reported by the authors.
Related Research Data
References
- Barker JSF. 1994. A global protocol for determining genetic distances among domestic livestock breeds. Proceedings of the 5th World Congress on Genetics Applied to Livestock Production; Vol. 21. Guelph: University of Guelph. p. 501–508.
- Binns MM, Uolmes NG, Holliman AM. 1995. The identification of polymorphic microsatellite loci in the horse and their use in thoroughbred parentage testing. Br Vet J. 151:9–15.
- Binns MM, Boehler DA, Bailey E, Lear TL, Cardwell JM, Lambert DH. 2012. Inbreeding in the thoroughbred horse. Anim Genet. 43:340–342.
- Botstein D, White RL, Skolnick M, Davis RW. 1980. Construction of a genetic linkage map in man using restriction fragment length polymorphisms. Am J Hum Genet. 32:314–331.
- Bowling AT, Eggleston-Stott ML, Byrns G, Clark RS, Dileanis S, Wictum E. 1997. Validation of microsatellite markers for routine horse parentage testing. Anim Genet. 28:247–252.
- Cassidy R. 2002. The sport of kings: kinship, class and thoroughbred breeding in newmarket. Cambridge (UK): Cambridge University Press.
- Cho GJ. 2007. Genetic relationship and characteristics using microsatellite DNA loci in horse breeds. J Life Sci. 17:699–705.
- Cunningham P. 1991. The genetics of Thoroughbred horses. Sci Am. 264:92–99.
- Cunningham EP, Dooley JJ, Splan RK, Bradley DG. 2001. Microsatellite diversity, pedigree relatedness and the contributions of founder lineages to thoroughbred horses. Anim Genet. 32:360–364.
- Dakin EE, Avise JC. 2004. Microsatellite null alleles in parentage analysis. Heredity. 93:504–509.
- Dorji J, Tamang S, Tshewang T, Dorji T, Dorji TY. 2018. Genetic diversity and population structure of three traditional horse breeds of Bhutan based on 29 DNA microsatellite markers. PLoS ONE. 13:e0199376.
- Hedrick PW, Garcia-Dorado A. 2016. Understanding inbreeding depression, purging, and genetic rescue. Trends Ecol Evol (Amst.). 31:940–952.
- Hewitt A. 2006. Sire Lines. Lexington: Eclipse Press.
- Hoffman JI, Amos W. 2005. Microsatellite genotyping errors: detection approaches, common sources and consequences for paternal exclusion. Mol Ecol. 14:599–612.
- Jamieson A, Taylor SC. 1997. Comparisons of three probability formulae for parentage exclusion. Anim Genet. 28:397–400.
- Kakoi H, Nagata S, Kurosawa M. 2001. DNA typing with 17 microsatellites for parentage verification of racehorses in Japan. Anim Sci J. 72:453–460.
- Kalinowski ST, Taper ML, Marshall TC. 2007. Revising how the computer program CERVUS accommodates genotyping error increases success in paternity assignment. Mol Ecol. 16:1099–1106.
- Lacy RC, Alaks G, Walsh A. 1996. Hierarchical analysis of inbreeding depression in Peromyscus polionotus. Evolution. 50:2187–2200.
- Lee SY, Cho GJ. 2006. Parentage testing of Thoroughbred horse in Korea using microsatellite DNA typing. J Vet Sci. 7:63–67.
- Leroy G, Callède L, Verrier E, Mériaux JC, Ricard A, Danchin-Burge C, Rognon X. 2009. Genetic diversity of a large set of horse breeds raised in France assessed by microsatellite polymorphism. Genet Sel Evol. 41:5.
- Ling YH, Ma YH, Guan WJ, Cheng YJ, Wang YP, Han JL, Mang L, Zhao QJ, He XH, Pu YB, et al. 2011. Evaluation of the genetic diversity and population structure of Chinese indigenous horse breeds using 27 microsatellite markers. Anim Genet. 42:56–65.
- Marletta D, Tupac-Yupanqui I, Bordonaro S, García D, Guastella AM, Criscione A, Cañón J, Dunner S. 2006. Analysis of genetic diversity and the determination of relationships among western Mediterranean horse breeds using microsatellite markers. J Anim Breed Genet. 123:315–325.
- MIPAAFT. 2018. Ministero delle Politiche Agricole Alimentari, Forestali e del Turismo. Italian Thoroughbred Stud Book Vol. XLI
- Okello JBA, Wittemyer G, Rasmussen HB, Douglas-Hamilton I, Nyakaana S, Arctander P, Siegismund HR. 2005. Noninvasive genotyping and mendelian analysis of microsatellites in African savannah elephants. J Hered. 96:679–687.
- Peakall R, Smouse PE. 2012. GenAlEx 6.5: genetic analysis in Excel. Population genetic software for teaching and research – an update. Bioinformatics. 28:2537–2539.
- Pemberton JM, Slate J, Bancroft DR, Barrett JA. 1995. Nonamplifying alleles at microsatellite loci: a caution for parentage and population studies. Mol Ecol. 4:249–252.
- Rukavian D, Hasanbasic D, Ramic J, Zahirovic A, Ajanovic A, Beganovic K, Durmic-Pasic A, Kalamujic B, Pojskic N. 2016. Genetic diversity of thoroughbred horse population from Bosnia and Herzegovina based on 17 microsatellite markers. Jpn J Vet Res. 64:215–220.
- Seo JH, Park KD, Lee HK, Kong HS. 2016. Genetic diversity of Halla horses using microsatellite markers. J Anim Sci Technol. 58:40.
- Summers K, Amos W. 1997. Behavioral, ecological and molecular genetic analyses of reproductive strategies in the Amazonian dart-poison frog, Dendrobates ventrimaculatus. Behav Ecol. 8:260–267.
- Tack LC, Thomas M, Reich K. 2007. Automated forensic DNA purification optimized for FTA Card punches and identifiler STR-based PCR analysis. Technical Brief. Clin Lab Med. 27:183–191.
- Tozaki T, Kakoi H, Mashima S, Hirota K, Hasegawa T, Ishida N, Miura N, Choi-Miura NH, Tomita M. 2001. Population study and validation of paternity testing for thoroughbred horses by 15 microsatellite loci. J Vet Med Sci. 63:1191–1197.
- Unire Veterinari. 2015. Release 1.0. Rome (IT): Ministero delle Politiche Agricole Alimentari, Forestali e del Turismo. http://exassi.politicheagricole.gov.it/unireVeterinari/start.do
- Van De Goor LH, Panneman H, Van Haeringen WA. 2010. A proposal for standardization in forensic equine DNA typing: allele nomenclature for 17 equine-specific STR loci. Anim Genet. 41:122–127.
- Weatherby J. 1791. An Introduction to a General Stud Book. London: Weatherby and Sons.
- Whatman Inc. 2003. Preparation of isolated DNA from FTA Cards using an automated liquid handling system. Application Note 51609, Copyright Whatman Inc., Sanford, Maine, USA. http://www.whatman.com