
 ?Mathematical formulae have been encoded as MathML and are displayed in this HTML version using MathJax in order to improve their display. Uncheck the box to turn MathJax off. This feature requires Javascript. Click on a formula to zoom.
Abstract
The first aim of this study conducted in France was to examine consumer habits concerning beef consumption, as well as any reasons, which may explain the relative decline in interest in beef consumption. Two surveys were conducted based on a sample of 625 beef consumers to analyse the frequency of their meat consumption and its evolution. The survey also aimed to explore consumers’ understanding of the new labelling system, which was introduced in France in 2015 to indicate the eating quality potential of cuts with stars. Half of the respondents have reduced their beef consumption. Whereas inconsistency in eating quality is one reason among others which contribute to explain this decline, results showed that 70% of the respondents have not seen yet the new labels on beef. Nevertheless, this system represents a major progress for the French beef sector and should be developed further. Indeed, French consumers would be interested in a meat grading system based on tenderness as the one in Australia. Such a system could reduce the decline in beef consumption and even reverse this negative trend.
The decline in meat consumption may be explained by the high price of beef, and concerns about health, environment, eating quality and animal welfare.
A large proportion of the respondents (72%) is not aware of the new labelling system for beef in supermarket self-service aisles.
Further developing this new system to a grading scheme similar to the ‘Meat Standards Australia’ would be judicious.
Highlights
Introduction
Meat consumption/experience characteristics, as well as quality factors, determine purchasing decisions, consumer expectations and consumer satisfaction: psychological, personal, sensory (product specific) and marketing factors (market-based) are major drivers of meat consumption (Tomasevic et al. Citation2018). Thus, it is imperative to understand all these factors, as the final actor in every food chain is the consumer, all the more as meeting his expectations is an important element of ensuring consumers’ return custom (Font-i-Furnols and Guerrero Citation2014). Unlike other sectors, the beef industry has been relatively slow to react to consumer trends. In brief, it is widely recognised that understanding consumers’ perceptions of beef quality is of major importance for the beef sector if it wishes to remain competitive.
While meat consumption rises with economic development, it is increasingly being challenged in affluent sections of the population due to the environmental and human health implications of eating too much meat (Tilman and Clark Citation2014). This shift in diet has been described and explained as ‘nutrient transitions’ (Popkin Citation2001). A decline in beef consumption has been observed in many European countries. France is the largest producer and consumer of beef in Europe, and the slow decline in meat consumption has also been observed in this country. This phenomenon is particularly noticeable for beef (Sans and Legrand Citation2018), that is, the decrease in the proportion of beef consumption in French meat consumption is significant (−2.5% per year from 1999 to 2006). However, although meat consumption is on the decline, consumers increasingly appear to want high-quality meat cuts, that is, characterised by consistently high levels of quality.
In France, reliable eating-quality guarantee systems are still lacking despite a large number of private voluntary labelling initiatives, and public labels. Household interest in premium category meat samples (i.e. with a quick cooking time) is growing (representing about 36.8% of all beef purchases; FranceAgriMer Citation2015). This observation has encouraged the beef sector to accord high importance to the tenderness description as this meat quality factor plays a key role in the definition of ‘high-quality meat’ (Sans and Legrand Citation2018).
Moreover, the latest French National Food Conference (Etats Généraux de L’alimentation) organised last year presented its roadmap for the coming years and indicated the objective of having 40% of all red meat using the ‘Label Rouge’ system in the next 5 years (which would represent a significant increase as the current proportion of meat using the ‘Label Rouge’ system is around 5%).
Therefore, in a context where both limitations and threats have significant impacts on expanding demand for meat, the beef sector developed (at the end of 2014) a new trading system for beef purchased in self-service aisles.
The aim of this new generic designation is to simplify meat labelling by adding one to three stars on all packs of meat (depending on the muscle type); these stars represent the potential eating quality level of each cut of meat. The aim is to help consumers make purchasing decisions in a context where they do not have enough guidance to choose cuts of meat (as provided by butchers many years ago) thus increasing their satisfaction levels and limiting the risk of disappointment in terms of the eating experience.
This new mandatory labelling system of meat (for meat sold in self-service aisles only) came about following a ministerial decree published on 13 December 2014. It is a real breakthrough and is likely to reduce irregularity in terms of the proposed quality (Sans and Legrand Citation2018). This new regulation is based on three pieces of information, which must be systematically indicated to the self-service consumer: the cut, whose name can be simplified; the potential quality of each cut as estimated by practitioners (based on the average eating quality value of the cut derived from historically typical French cattle) and expressed in the number of stars; and the preferred cooking method (Sans and Legrand Citation2018).
After a few years of implementation of this star system, the aim of the current survey was to take stock of beef consumption habits, and to obtain initial feedback from consumers on the new French meat labelling system (i.e. the star system).
Material and methods
Data collection
To investigate consumers’ purchasing behaviours, attitudes and knowledge about new meat marketing labels (with stars) and beef preferences, an ad hoc questionnaire was designed. A total of 625 individuals participated in the survey either via face-to-face interviews (280 individuals) or via Facebook (345 individuals).
The questionnaire was the same in both surveys (see Supplemental Material) as was the target population, that is, people purchasing and consuming fresh beef at least twice a week (with the exception of minced beef, the expectations for minced beef being rather different than those for whole muscle).
The questionnaire was divided into three main sections. The first section included questions related to socio-demographical characteristics such as age (with different classes from 18 to 24 years, from 25 to 34, from 35 to 49, from 50 to 65 and over 65) and gender (male or female). The second section focussed on meat purchasing behaviours and consumption. Quantitative and qualitative aspects of beef consumption were examined, for example, a sking respondents about their habits, preferences, cuts they usually eat, and their beef consumption over the last 5 years. The new meat labelling system (with stars) was analysed in the third section of the questionnaire, which focused on consumer perceptions of this new beef labelling system.
Face-to-face interviews were conducted using paper questionnaires between October and December 2016. To answer the 30 questions on the questionnaire, the interviews lasted on average between 10 and 15 minutes. The sampling process respected a range of criteria such as the points of sale of the meat (hypermarkets, supermarkets and butchers’ shops), age bracket, gender and urban/rural distribution.
The same survey was also posted on Facebook (in January 2017). After eliminating respondents that did not meet the sample requirements (e.g. those who not make their own purchases, those who eat beef less than twice par week, etc.), the final sample included 345 persons (out of 570 respondents).
Respondents’ characteristics
Out of the 280 respondents participating in the face-to-face survey, 44% were males and 56% females. In the Facebook survey, the gender distribution is equivalent to 49% of males and 51% of females. This distribution is quite close to that of the French population, that is, 48% males and 52% females.
If the sampling of the face-to-face survey was carried out to have an age distribution comparable to the French population (Insee Citation2018) (), the age distribution of respondents participating in the Facebook survey shows a significant bias. The Facebook respondents were significantly younger, that is, with a high proportion of 18- to 24-year-old respondents (71%). This can be easily explained by the survey instrument (i.e. Facebook is a social network mostly used by young people) but also the length of the availability of the survey (only three days thus requiring a high level of responsiveness of the respondents).
Figure 1 Demographic profile of the population completing the face-to-face survey, the Facebook survey, and the French population (Papon and Beaumel Citation2018).
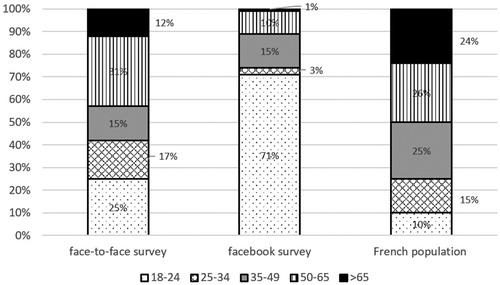
Even though there is a significant difference in terms of age distribution in the two sub-populations, the results of both surveys were found not to be significantly different. Thus, there were presented and analysed together.
Statistical analysis
As this survey is quantitative, it is important to estimate the margins of error associated with the different results (Ardilly Citation2006; ). A margin of error is the difference between the result obtained from the sample surveyed and that obtained if the entire population had been interviewed. In the case of a very large population (here consumers of beef in France), the margin of error (e) depends on the size of the sample (n), the estimated result (r) and a margin coefficient (t), here 1.96 in the case of a 95% confidence level.
Table 1. Margin of error associated with the observed proportions (for 625 respondents – with a confidence interval of 95%).
Rigorously, a margin of error can only be estimated in the case of a random sample, which we cannot guarantee in the context of these surveys. However, the margins of error of a quota sample remain similar to those of a random sample of the same size (Gerville-Réache and Couallier Citation2011), which is why we used this estimate. According to the , if 30% of the 625 respondents chose answer ‘A’, there is 95% chance than the result is located between 26.7% and 33.6% for the total target population. To present clearer results, the various margins of error, associated with the observed proportions with a confidence interval of 95%, were added in the figures. It appears that errors are the highest for proportions of 50% and then decrease in a symmetrical manner on both sides. Thus, a margin of error is equivalent for a proportion of 20% and 80%.
Results are expressed as percentages of answers. The dispersions of answers were compared across groups (face-to-face population and Facebook population) by chi2-tests. When the differences were found non-significant, the results of both populations were associated. On the contrary, when the differences were found significant, we dissociated the results of both groups.
Results
Reasons to eat beef or to eat less beef
Respondents taking part in the face-to-face survey say they eat beef because they like its taste (87%), but also because meat is a source of various important nutrients such as protein and iron (50% of the respondents).
Over the last few years, the respondents’ consumption has remained stable (42% of the respondents) or has diminished (50%; ). The reasons for the decline in meat consumption are numerous (): the too high price of beef (31%), possible health risks (25%), the impact of farming on the environment (10%), different purchasing practices, that is, less quantity and more quality (10%), lack of consistency in terms of sensory quality especially for tenderness and taste (6%), animal welfare concerns (5%) and the impact of health scandals (3%). The same arguments were put forward by the respondents surveyed on the internet but with a slightly different ranking, that is, rearing and slaughtering conditions had much greater importance for this population, which is mostly made up of young people who are probably more sensitive to the campaigns of animal welfare associations and/or anti-meat associations.
Figure 2 Respondents’ changes in beef consumption in recent years.
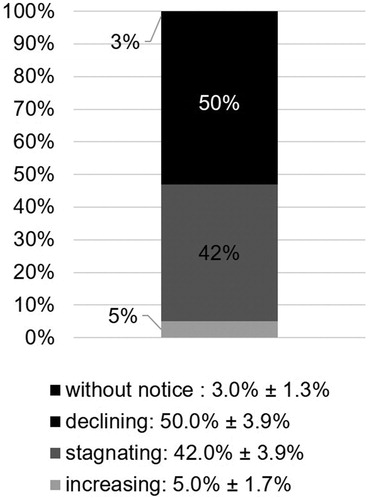
Table 2. Reasons for the respondents’ changes in beef consumption in the recent years.
A quarter of the respondents who have decreased their beef consumption did so because of the potential health risks that meat consumption may pose. Their fears mainly concern increased risks of developing colorectal cancer (52%) and/or cardiovascular diseases (25%) due to excess fat and cholesterol intake. Some respondents fear that meat contains hormones and/or antibiotics that could affect their health (14%). Finally, a small but significant number of respondents think that red meat is ‘bad for athletes’ (7%) and should therefore be limited.
Although over 60% of the respondents say they have not been disappointed recently when eating beef, all the respondents agree that the industry must improve its meat offering in terms of improving its tenderness and taste. The improvement should also concern the homogeneity of meat samples, in order that two similar pieces of meat corresponding to the same butcher’s cut have a similar eating experience.
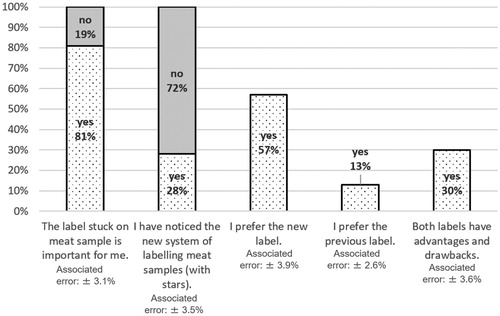
The respondents think that significant attention should be paid to labels (). Initially, respondents consider the name and price of the cut (rather than the price per kilogram) than other criteria such as the use-by date, the visual appearance of the cut, its geographical origin and possible quality signs.
Figure 3 Role of the label when making a beef purchase and consumer feedback about the star system.
These trends, which were highlighted in the face-to-face surveys, were confirmed in the internet survey. However, in the online survey, it should be noted that the bovine breed is a more important criterion: it is cited by 30% of the respondents on the internet compared to only 10% of the respondents taking part in the face-to-face survey.
Although most respondents point out the importance of the cut when making a purchasing decision, when they were shown a beef carcase, only 60% of the respondents were able to identify the best cuts as coming from the back and thigh, the remaining 40% assumed the best cuts came from the shoulder or neck. Two-thirds of the respondents (70%) can name between 1 and 4 cuts (including rib, rump, flank, fillet and sirloin); only 15% could name more cuts, and the remaining 15% could not name a specific muscle with the exception of ‘steak’. In this respect, the new meat labelling seems pertinent given many consumers’ ‘ignorance’ of the names of meat products.
Knowledge of the new grading system based on stars
While the respondents indicated that they paid close attention to the labels, a large proportion of the respondents (72%) had not noticed the presence of stars on labels on beef products in supermarket self-service aisles (the proportion being similar regardless of the attention paid by the respondents to the labels; ). Those respondents who noticed this new labelling (28%) made the connection with the quality of the meat (98% of cases) but rarely use the stars or the label to choose one piece of meat over another (60%). On the other hand, those who do use this potential quality ranking consider that the quality, as perceived in the mouth when tasting the meat, is reflected by the number of stars indicated on the label (over 75% of cases).
The respondents who had not noticed this new labelling (72%) did not have a clear idea of its meaning, although one-third of the respondents assumed it was connected with ‘quality’. However, they do not know what type of ‘quality’ it refers to (e.g. sensory, nutritional, usage. etc.). In addition, 13% of the respondents were not aware of the aims of the new system and say they would like to see a clear explanation of the star system on the pack.
When both labels (old and new labels) were shown to the respondents, 57% said they prefer the new labelling system (). The preference for the new label is significantly higher than the one for the previous label or the one for both labels (chi2 test, p < .001). Respondents find the new system clearer (75% of cases) due to the presence of stars, and like the cooking method tips (over 10% of cases). While this percentage may seem relatively low, it should be noted that only 13% of the respondents prefer the old labelling system while the remaining 30% see advantages in both systems. The respondents who prefer the old labelling system (13%) do not like not knowing the name of the cut (55% of the cases) and criticise the ‘marketing’ aspect, which does not ‘educate’ consumers (22%). A proposal put forward by 30% of the respondents who found advantages and disadvantages for each labelling system, would be to place the name of the cut in italics under the generic name in order to satisfy all meat consumers, that is, both educated consumers and those who do not know the names of cuts.
In addition to the sensory quality, the respondents think that the star system could also take into consideration other quality aspects such as an objective ranking of
rearing conditions and the origin of the meat (local or regional) (71%)
animal welfare (40%)
environmental impact (32%)
nutritional value (25%)
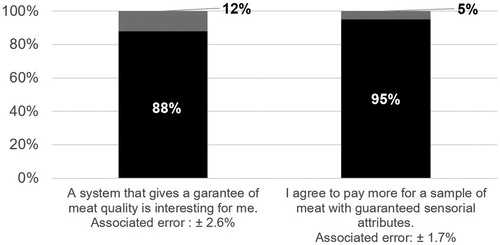
In terms of perspectives, 88% of the respondents would be interested in a system that would ensure a guaranteed level of meat tenderness/taste at the time of purchase. This interest in such a system is both expressed by men and women (p = .38), is independent from respondent’s age (p = .91) and salary level (p = .17). Consumers that eat meat each day or many times a week (respectively 23% and 47% of the respondents) appear to be more interested in such a system that those that consume meat less than 1 time a week (p < .001) ().
Table 3. Interest in a system guarantying meat quality depending on respondent’s characteristics (expressed as percentages).
Furthermore, 95% of these people would be willing to pay more for a cut of meat if such a system were implemented; the average extra cost being in the region of 5–7 Euros/kg of fresh meat (). Here, we can see a gap in terms of the two surveyed populations’ willingness to pay extra; this can be explained by the purchasing power of the two sub-populations: the face-to-face respondents (on average older) would accept an additional cost of about 8–9 Euros/kg while the respondents surveyed on social networks would be willing to pay a lower average extra cost (around 3–4 Euros/kg).
Figure 4 Interest in a system that could provide guarantees on meat quality.
According to our results, a classification scheme for tenderness and meat quality would be appreciated by French consumers. Among the 88% of respondent that would be interested in a system that would ensure a guaranteed level of meat tenderness/taste at the time of purchase, the proportion is quite equivalent among genders (89% of men and 87% of women) and age classes (from 89% of 18- to 24-year-old respondents to 86% of 65-year-old or more ones). Moreover, whatever their usual meat consumption (every day, every week, every month, less often), the respondents are highly favourable to such a guarantee system (respectively 80%, 88%, 85%, 100% of positive answers).
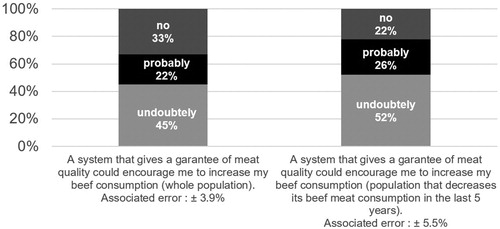
Undoubtedly, this type of system could encourage consumers to purchase and eat more beef undoubtedly (45%) or probably (22%). The same trend (chi2 test; p = .22) was obtained for the restricted population of consumers who have decreased their meat consumption in the last 5 years (respectively 22 and 26% of them consider that it will [undoubtedly or probably] lead to an increase in their beef consumption) ().
Figure 5 Possible impact on beef consumption following the introduction of a meat quality guarantee system.
Discussion
Trends and drivers of beef consumption and perception
In recent years, meat consumers have been increasingly seeking out new and healthier products (Kwiecińska et al. Citation2017). These observations support the idea that we eat meat because it is Necessary, Natural, Normal and Nice, 4Ns concept (Piazza et al. Citation2015).
Thus, this survey confirmed that the French consumers eat meat for the pleasure of its taste, as well as to cover their nutritional needs thus confirming the results of Piazza et al., (Citation2015). Moreover, some recent studies put the perceived safety risk into perspective, that is, indicating that consumers’ decisions to eat meat are gradually becoming more influenced by nutrition and health considerations (da Fonseca et al. Citation2008). Similarly, Pethick et al. (Citation2011) suggested that the priorities of the bovine and ovine sectors should, in addition to increasing meat yields to maximise the profit, guarantee good sensory and nutritional quality in order to better meet consumers’ expectations (Pethick et al. Citation2011).
However, beef consumption has decreased for almost 50% of the respondents confirming the trend towards flexitarianism [behaviour of persons whose diet is often vegetarian but sometimes includes meat, fish, or poultry] as reported by (Laisney Citation2016): 56% of French people say they eat less meat (compared to only 3% who say they eat more). The reasons behind this decline in beef consumption (too expensive, possible health risks, impact of livestock breeding on the environment, and animal welfare issues) are broadly consistent with the work conducted by (Laisney Citation2016).
Much of the literature indicates that tenderness is the most important factor in determining consumer satisfaction (Verbeke et al. Citation2010) even if, according to Bonny et al. (Citation2016, Citation2017), tenderness, flavour and overall liking appear to have similar weights. The fact that French people are generally satisfied with the quality of beef confirms the results of Normand et al. (Citation2014). Nevertheless, the beef industry must make progress in terms of offering meat that is more tender, and tastes better but also with a reduced variability in eating quality: it would be preferable that purchasing identical cuts of meat could give similar eating quality outcomes. Indeed, today, there is no clear link between the price of beef for the consumer and the taste quality of this meat in France (Normand et al. Citation2014) as producers are paid based on the carcase characteristics (conformation and fattening), which have little relationship to the taste quality of the meat (Bonny et al. Citation2016).
Consumers’ main purchasing criteria (i.e. name and price of the cut, use-by date, visual appearance of the cut, geographical origin and possible presence of a quality sign) confirm Tavoularis’s observations (2008) on the whole, even though the nature and ranking of the responses sometimes differ between studies depending on how the questions were asked. Overall, consumers place significant importance on the price, the geographical origin (especially in France) and a little less on the possible presence of an official quality sign (Tavoularis Citation2008).
Thus, led by market demand for higher intrinsic quality, better animal welfare, care for the environment, and sustainability, meat production systems are changing (Verbeke et al. Citation2010). Consumer attention in regard to animal welfare has been confirmed in several studies conducted at the European level (Boogaard et al. Citation2006; Vanhonacker et al. Citation2008; Troy and Kerry Citation2010; Toma et al. Citation2012). Citizens’ awareness of the environmental and ethical consequences of intensive livestock production has been progressively growing and more sustainable agricultural practices are being driven by citizens, and environmental and social concerns (Verbeke et al. Citation2010).
The main arguments, pro and cons of beef consumption
One of the main criticisms of beef identified in this survey is the fat content of meat. In Europe, a minimum of 3–4% fat content is regularly cited as being necessary to give sufficient taste and juiciness to the meat (Hocquette et al. Citation2015). It is known that fat plays a key role in tenderness thus contributing to at least 10% of the variability of the overall assessment (Hocquette et al. Citation2010). However, unlike other species, removing the inter-muscular and subcutaneous fat is easy when eating certain cuts (e.g. rib). Therefore, it is possible to significantly reduce the fat content of a cut of meat once it is on the plate (Geay et al. Citation2001). In reality, beef only contributes around 5% of the dietary fat intake in humans in France (Hocquette et al. Citation2015). It would be exaggerating to consider beef as being high in fat. Indeed, consumption of ‘denuded’ (highly trimmed of intermuscular fat) beef cuts represents a trivial source of dietary fat in the whole diet.
Regarding the health value of lipids, it depends on the composition of the fatty acids (FA) and beef generally has a bad reputation with regard to this. Saturated fatty acids (SFAs) and mono-unsaturated fatty acids are in the majority (around 45% of the total FAs for each type of FA) whereas the polyunsaturated fatty acid (PUFA) content, known for its beneficial properties for humans, is less present and relatively variable (3–12% of total FAs depending on the muscle type) (Gruffat et al. Citation2015). As a result, in standard beef, the PUFA/SFA ratio is unfavourably low (about 0.1) in terms of human health. However, as beef only makes a limited contribution to the French’s fat intake (under 5%), its contribution in terms of SFA intake, which is likely to have a negative impact on human health, is also modest (Van Elswyk and McNeill Citation2014). Moreover, the production of ‘quality’ beef through increasing its n-3 FAs and conjugated linoleic acids (CLA) levels, and decreasing their SFA levels is currently being developed through the introduction of different diets based on grass, or supplements from seeds/oils (namely linseed). For example, fresh grass contains on average 1–3% of FAs, 18:3n-3 represents 50–75% of the total FAs in the grass. Numerous studies (Scollan et al. Citation2014; Van Elswyk and McNeill Citation2014) indicate that a grass-based diet allows for meat production that is lower in lipids (−35 to −61%) but higher in PUFAs n-3 (×1.8 to 5.6), in CLAs (×1.2 to 2.1) and long FAs (×1.1 to 4.5) making it possible to optimise the nutritional value of meat Therefore, it may be excessive to consider the composition of FAs in beef as being disadvantageously unbalanced.
Regarding the risks to human health associated with beef consumption, and especially the risk of colon cancer, it has been established (Bouvard et al. Citation2015) that the consumption of red meat is probably carcinogenic for humans. Nevertheless, these risks only occur when meat consumption is very high, and thus only concern big consumers of beef (average consumption in Europe is around 40–50g/day while at-risk consumption is around 70g/day; (McAfee et al. Citation2010)) Moreover, overall modifications to diet are likely to limit the risks to human health, that is, through the reduction of lipid peroxidation via the consumption of antioxidants such as Vitamin E (Pierre Citation2016).
The various criticisms made against beef tend to make us overlook the main fact that beef is an important source of protein and is rich in essential amino acids that are quickly and easily digestible (Rémond et al. Citation2009). Beef is also a source of micro-nutrients (iron, zinc and vitamins B3, B6 and B12 in particular but also selenium, and vitamins B1, B2, B5 or B9) providing a significant share of our nutritional requirements.
Finally, despite the arguments put forward by some respondents, the consumption of meat and more particularly red meat can be encouraged for athletes as it is a non-negligible source of iron and protein; athletes have protein (1.2–1.5g/kg per day) and iron requirements that are significantly higher than non-athletes (Duchène et al. Citation2010). Physical activity increases iron loss and accelerates the synthesis of red blood cells necessary for oxygenation.
Among other risks to human health, some respondents mentioned antibiotics but a recent study (Roudaut et al. Citation2017) found that the rates of non-compliance on beef samples was significantly reduced. It can be considered that the frequency of non-compliance in terms of waiting times and prescriptions in cattle is low, although more progress is still possible. However, it should be noted that compliance with waiting times does not mean a total absence of residues in foodstuffs but it does prevent excess residues in terms of the regulatory threshold (i.e. the maximum limit for residues thus guaranteeing consumer safety).
In recent years, there has been an awareness among operators in the sectors, consumers and public authorities resulting in various action plans that aim to achieve a more prudent and reasoned use of antibiotics with a view to drastically reducing their use (Chardon and Brugère Citation2014).
In addition to these aspects, cattle production is also notable for the services provided by livestock, which have not been sufficiently developed and/or recognised by consumers. However, it is generally accepted that livestock contributes not only to the production of foodstuffs but also to improving environmental quality (contribution to the quality of ecosystems, the diversity of landscapes, recycling of co-products, etc.), regional vitality (agricultural, rural and agro-economic) and building cultural identity (aesthetics and typical nature of the region, gastronomic heritage, support for ancillary activities, etc.) (Ryschawy et al. Citation2017).
Willingness to pay for better beef
Our results confirm consumers’ willingness to pay more for a system guarantying eating meat quality, the average extra cost being in the region of 5–7 Euros/kilogram of fresh meat. These orders of magnitude seem lower to those previously claimed by (Bonny et al. Citation2017). Consumers are willing to pay for meat products from their own country of origin (Ehmke Citation2006; Loureiro and Umberger Citation2007). Consumers are willing to pay more for products with guaranteed attributes such as labels, traceability and origin information, tenderness, and certifications. In this survey, the organoleptic (sensory) quality of the product is of a high importance, whereas in previous cited studies (Ehmke Citation2006; Loureiro and Umberger Citation2007), it was assumed less important compared to the product’s safety guarantees. Nevertheless, as the French traceability system is particularly efficient, it could be hypothesised that consumers are now confident enough to attach less importance to this parameter. A survey with American citizens (Loureiro and Umberger Citation2007) highlights how consumers would prefer to pay a premium: firstly for safe certified meat, secondly for traceable meat (guaranteed origin), and finally for tender meat.
For French consumers (based on previous results), we can confirm (Verbeke et al. Citation2010) that a classification scheme for tenderness and meat quality would be appreciated by European consumers. This could be a European/French version of the Australian ‘Meat Standards Australia Beef Grading Model’, which provides a tool to estimate eating quality and the resulting grade of individual cuts and for different cooking methods of each cut.
Consumers generally highlight the importance of the cut when making purchasing decisions, which is highly relevant since different cuts have different tenderness potential. This explains why some quality prediction systems (e.g. the ‘Meat Standards Australia’ in Australia) are based on the cut of meat and not the carcase as is the case in Europe (Polkinghorne and Thompson Citation2010). In this respect, the star system is a real step forward in satisfying consumer expectations. However, this approach based on the cut and preferred cooking method is still incomplete as it does not take into account other factors that contribute to the variability of the taste quality of beef, notably the breed and age of the animal, maturation duration, etc. Thus, the quality expressed by the star system can be counter-productive as the stars may be considered as a quality ‘guarantee’ by some consumers, while, in reality, they only indicate potential quality, that is, solely related to muscle type and without taking into account the other aforementioned factors.
The Meat Standards Australia (MSA) system, which is also based on muscle type, is more accurate as it takes into account other factors from the farm to the plate (cooking method) through the slaughterhouse (carcase weight, animal maturity, pH, marbling, etc) and the retailer (ageing time). It was successfully tested in different countries (Hocquette et al. Citation2014; Guzek et al. Citation2015; Henchion et al. Citation2017), such as in Asia (South Korea, Japan), North America (USA), New Zealand, South Africa and also Europe (Northern Ireland, Poland and the Republic of Ireland), and particularly in France with French meat and French consumers (Legrand et al. Citation2013, Citation2017). Further developing the current star system, that is, to move towards a system comparable to the MSA model would make it possible to identify the best combinations, that is, between the animal, muscle, duration of maturation, and cooking method. Such an approach has been successfully studied in Europe (Bonny et al. Citation2018).
Conclusions
This survey clearly indicates that a large proportion of the respondents are not aware of the new French star system. In light of our results, this new meat labelling system (compulsory in self-service aisles only) may probably negatively affect meat consumption as it needs to be further explained and highlighted to consumers. While it is a step forward, it is only an initial step for the sector. As it stands, the star system does not take into account some of the factors of variation that have a significant impact on quality, notably the breed/breed type, age/degree of physiological maturity, management/breeding system, ageing, etc. Moreover, the quality expressed by the star system raises questions as the stars could (wrongly) be considered a ‘guarantee’ of quality by some consumers, whereas they only reflect potential quality (subject to variations according to various factors previously not taken into account). A well-functioning and reliable guarantee system including eating quality indicators could be of significant interest for French consumers. Guaranteeing consistent eating quality could not only increase consumer satisfaction but also lead to higher consumption of beef products (and thus to higher beef sector profitability). Further developing the star system to something comparable to the ‘Meat Standards Australia’ would be judicious.
This study will enable the industry to gain a deeper insight into consumers’ perceptions of the new ‘star system’. It also allows interested parties to better understand consumers’ beef preferences. Indeed, another main result of this survey is that health concerns are very important for the consumer, who is concerned by risks of developing colonic cancer or cardiovascular diseases and by hormones and/or antibiotics within meat that could affect their health. This study will also help the beef sector to develop effective beef marketing strategies to slow down the decrease in consumption (or even reverse the downward trend). Our conclusions can be used to better inform the beef industry on developing the ‘star’ system, which provides the consumer with more information (of interest for consumers).
Acknowledgements
These surveys were conducted by engineering students from the Bordeaux Sciences Agro (years 2015–2018 and 2016–2019).
Disclosure statement
The authors report no conflicts of interest. The authors alone are responsible for the content and writing of this article.
Related Research Data
References
- Ardilly P. 2006. Les techniques de sondage. Editions Technip Paris, France.
- Bonny SPF, Hocquette J-F, Pethick DW, Farmer LJ, Legrand I, Wierzbicki J, Allen P, Polkinghorne RJ, Gardner GE. 2016. The variation in the eating quality of beef from different sexes and breed classes cannot be completely explained by carcass measurements. Animal. 10:987–995.
- Bonny SPF, Hocquette J-F, Pethick DW, Legrand I, Wierzbicki J, Allen P, Farmer LJ, Polkinghorne RJ, Gardner GE. 2017. Untrained consumer assessment of the eating quality of beef: 1. A single composite score can predict beef quality grades. Animal. 11:1389–1398.
- Bonny SPF, Hocquette J-F, Pethick DW, Legrand I, Wierzbicki J, Allen P, Farmer LJ, Polkinghorne RJ, Gardner GE. 2018. The variability of the eating quality of beef can be reduced by predicting consumer satisfaction. Animal. 12:2434–2442.
- Boogaard BK, Oosting SJ, Bock BB. 2006. Elements of societal perception of farm animal welfare: a quantitative study in The Netherlands. Livest Sci. 104:13–22.
- Bouvard V, Loomis D, Guyton KZ, Grosse Y, El Ghissassi F, Benbrahim-Tallaa L, Guha N, Mattock H, Straif K. 2015. Carcinogenicity of consumption of red and processed meat. Lancet Oncol. 16:1599–1600.
- Chardon H, Brugère H. 2014. Usages des antibiotiques en élevage et filières viandes. Cah. Sécurité Sanit. Santé Anim. Cent. D’Information Viandes. http://www.interbev.fr/wp-content/uploads/2018/07/CIV-cahier-BD-26mai-logo-EcoAntibio.pdf
- da Fonseca M, da CP, Salay E. 2008. Beef, chicken and pork consumption and consumer safety and nutritional concerns in the City of Campinas, Brazil. Food Control. 19:1051–1058.
- Duchène C, Pascal G, Prigent S. 2010. Les viandes aujourd’hui: principales caractéristiques nutritionnelles. Cah Nutr Diététique. 45:44–54.
- Ehmke MT. 2006. International differences in consumer preferences for food country-of-origin: a meta-analysis. Am Agric Econ Assoc, 18p.http://ageconsearch.umn.edu/record/21193/files/sp06eh01.pdf
- Font-i-Furnols M, Guerrero L. 2014. Consumer preference, behavior and perception about meat and meat products: an overview. Meat Sci. 98:361–371.
- FranceAgriMer. 2015. Consommation des produits carnés en 2014, 4, 15p.
- Geay Y, Bauchart D, Hocquette J-F, Culioli J. 2001. Effect of nutritional factors on biochemical, structural and metabolic characteristics of muscles in ruminants, consequences on dietetic value and sensorial qualities of meat. Reprod Nutr Dev. 41:1–26. Erratum, 41, 377.
- Gerville-Réache L, Couallier V. 2011. Échantillon représentatif (d’une population finie): définition statistique et propriétés, 12p. https://hal.archives-ouvertes.fr/hal-00655566/document
- Gruffat D, Picard B, Bauchart D, Micol D. 2015. La viande bovine: les principales qualités recherchées. INRA Prod Anim. 28:99–104.
- Guzek D, Głąbska D, Gutkowska K, Wierzbicki J, Woźniak A, Wierzbicka A. 2015. Analysis of the factors creating consumer attributes of roasted beef steaks. Anim Sci J. 86:333–339.
- Henchion MM, McCarthy M, Resconi VC. 2017. Beef quality attributes: a systematic review of consumer perspectives. Meat Sci. 128:1–7.
- Hocquette A, Lambert C, Sinquin C, Peterolff L, Wagner Z, Bonny SP, Lebert A, Hocquette J-F. 2015. Educated consumers don’t believe artificial meat is the solution to the problems with the meat industry. J Integr Agric. 14:273–284.
- Hocquette JF, Gondret F, Baéza E, Médale F, Jurie C, Pethick DW. 2010. Intramuscular fat content in meat-producing animals: development, genetic and nutritional control, and identification of putative markers. Animal. 4:303–319.
- Insee. 2018. https://www.insee.fr/fr/statistiques/1892088?sommaire=1912926.
- Hocquette JF, Van Wezemael L, Chriki S, Legrand I, Verbeke W, Farmer L, Scollan ND, Polkinghorne R, Rødbotten R, Allen P, et al. 2014. Modelling of beef sensory quality for a better prediction of palatability. Meat Sci. 97:316–322.
- Kwiecińska K, Kosicka-Gębska M, Gębski J, Gutkowska K. 2017. Prediction of the conditions for the consumption of game by Polish consumers. Meat Sci. 131:28–33.
- Laisney C. 2016. Flexitarisme, végétarisme. Une tendance émergente? Viandes et Produits Carnés. VPC-2016-32-4-2. https://www.viandesetproduitscarnes.fr/index.php/fr/nutrition2/778-vegetarisme-et-flexitarisme-une-tendance-emergente
- Legrand I, Hocquette JF, Polkinghorne RJ, Pethick DW. 2013. Prediction of beef eating quality in France using the Meat Standards Australia system. Animal. 7:524–529.
- Legrand I, Hocquette JF, Polkinghorne RJ, Wierzbicki J. 2017. Comment prédire la qualité de la viande bovine en Europe en s’inspirant du système australien MSA. Innov Agron. 55:171–182.
- Loureiro ML, Umberger WJ. 2007. A choice experiment model for beef: what US consumer responses tell us about relative preferences for food safety, country-of-origin labeling and traceability. Food Policy. 32:496–514.
- McAfee AJ, McSorley EM, Cuskelly GJ, Moss BW, Wallace JM, Bonham MP, Fearon AM. 2010. Red meat consumption: an overview of the risks and benefits. Meat Sci. 84:1–13.
- Normand J, Rubat E, Evrat-Georgel C, Turin F, Denoyelle C. 2014. Les français sont-ils satisfaits de la tendreté de la viande bovine? Viandes Prod Carnés.VPC-2014-30-5-2. https://www.viandesetproduitscarnes.fr/index.php/fr/economie2/576-les-francais-sont-ils-satisfaits-de-la-tendrete-de-la-viande-bovine
- Papon S, Beaumel C. 2018. Bilan démographique 2017. Plus de 67 millions d’habitants en France au 1er janvier 2018. Insee première, n°1683, 4p.
- Pethick DW, Ball AJ, Banks RG, Hocquette JF. 2011. Current and future issues facing red meat quality in a competitive market and how to manage continuous improvement. Anim Prod Sci. 51:13–18.
- Piazza J, Ruby MB, Loughnan S, Luong M, Kulik J, Watkins HM, Seigerman M. 2015. Rationalizing meat consumption. The 4Ns. Appetite. 91:114–128.
- Pierre F. 2016. Produits carnés et risque de canacer : rôle du fer héminique et de la péroxydation lipidique. Viandes Prod Carnés. VPC-2016-32-4-5. https://www.viandesetproduitscarnes.fr/index.php/fr/nutrition2/787-produits-carnes-et-risque-de-cancer-role-du-fer-heminique-et-de-la-peroxydation-lipidique
- Polkinghorne RJ, Thompson JM. 2010. Meat standards and grading: a world view. Meat Sci. 86:227–235.
- Popkin BM. 2001. The nutrition transition and obesity in the developing world. J Nutr. 131:871S–873S.
- Rémond D, Peyron M-A, Savary-Auzeloux I. 2009. Viande et nutrition protéique. In: Bauchart D, Picard B, editors. Muscle et Viande de Ruminants. Editions Quae: Versailles (France); p. 133–142.
- Roudaut B, Fournet I, Pessel DH, Sanders P. 2017. Recherche de résidus d’antibiotiques dans la filière bovine française: des progrès à intensifier. Point Vét. Éd Expert Rural. 64–68, n°376.
- Ryschawy J, Martin G, Moraine M, Duru M, Therond O. 2017. Designing crop–livestock integration at different levels: Toward new agroecological models? Nutr Cycl Agroecosystems. 108:5–20.
- Sans P, Legrand I. 2018. In: Ellies-Oury MP, Hocquette JF (Eds.). La Chaîne de La Viande Bovine. Production, transformation, valorisation et consommation. Editions Lavoisier, Paris; p. 125–142.
- Scollan ND, Dannenberger D, Nuernberg K, Richardson I, MacKintosh S, Hocquette J-F, Moloney AP. 2014. Enhancing the nutritional and health value of beef lipids and their relationship with meat quality. Meat Sci. 97:384–394.
- Tavoularis G. 2008. Les signes officiels de qualité en perte de reconnaissance. Consomm Modes Vie. ISSN 0295-9976 n°212–10 juin 2008.
- Tilman D, Clark M. 2014. Global diets link environmental sustainability and human health. Nature. 515:518.
- Toma L, Stott AW, Revoredo-Giha C, Kupiec-Teahan B. 2012. Consumers and animal welfare. A comparison between European Union countries. Appetite. 58:597–607.
- Tomasevic I, Novakovic S, Solowiej B, Zdolec N, Skunca D, Krocko M, Nedomova S, Kolaj R, Aleksiev G, Djekic I. 2018. Consumers’ perceptions, attitudes and perceived quality of game meat in ten European countries. Meat Sci. 142:5–13.
- Troy DJ, Kerry JP. 2010. Consumer perception and the role of science in the meat industry. Meat Sci. 86:214–226.
- Van Elswyk ME, McNeill SH. 2014. Impact of grass/forage feeding versus grain finishing on beef nutrients and sensory quality: The US experience. Meat Sci. 96:535–540.
- Vanhonacker F, Verbeke W, Van Poucke E, Tuyttens FA. 2008. Do citizens and farmers interpret the concept of farm animal welfare differently? Livest. Sci. 116:126–136.
- Verbeke W, Pérez-Cueto FJ, de Barcellos MD, Krystallis A, Grunert KG. 2010. European citizen and consumer attitudes and preferences regarding beef and pork. Meat Sci. 84:284–292.