
Abstract
Forages dry matter (DM) could vary among batches and in particular when silages are fed. These variations could modify nutrients composition of total mixed ration and affect cows performance. The aim of this study was to evaluate the effect of application of a precision feeding system (PFS) based on a near infra-red scanner, on metabolic conditions and milk yield in lactating dairy cows. The study was performed in 7 farms where PFS was installed on feed mixer to perform a weight-adjustment of DM measured in real time on feeds. A cross-over (14 weeks periods) was applied, PFS was switched on (PF-ON) in three herds and off in the other four (PF-OFF) during 1st period, and vice versa in 2nd period. At the end of two periods, in each herd 7 early and 7 mid lactation cows, for a total of 196 cows, were checked for: blood parameters, milk yield and composition. During the study deviation of DM of target diet (calculated on amount of feed in recipe and applying the DM determined in laboratory) and diets really distributed to cows tended to be lower with PF-ON vs. PF-OFF (0.06 vs 0.12 kg, p = .12). In early lactating cows, lower blood urea (4.63 vs 4.88 mmol/L, p = .115) indicated a better feed protein utilisation in PF-ON vs. PF-OFF. Milk yield and composition were not affected. The use of PFS meliorated the consistency of TMR, which could determine a better efficiency of nutrients utilisation and a reduction of production costs.
Near infra-red (NIR) technology can be advantageously applied at farm level within a precision feeding system for dairy cows.
The system allowed a more constant daily supply of nutrients with a reduction of metabolic alterations and a higher efficiency of feed protein utilisation.
Utilization of NIR technology at farm level can be economically sustainable.
Highlights
Introduction
Economic and environmental sustainability is the key for animal breeding success (Babinszky and Halas Citation2009). Thus, to achieve these goals the nutrient availability should not limit animal’s welfare and performance (Nääs Citation2001). Consequently, it becomes compulsory the use of a precise matrix for both animal nutrient requirement and nutrient content of the feeds (Banhazi et al. 2012). In practice this is difficult to apply, due to the variability of animals within a herd and to the variability of feeds composition within a batch. Precision feeding aim to answer to these needs by the use of new devices, which allow to finely match nutritional animal requirement and feeds characteristics.
The nutrient concentrations in feedstuffs are characterised by large variability even over short periods of time (Weiss et al. Citation2012), causing variations in nutrient composition of the total mixed ration (TMR). These variations may affect health and yields of dairy cows, including incidence of displaced abomasum and fluctuations in average daily milk yield (Stone Citation2008), with consequences on farm profitability and sustainability (Fadel et al. Citation2006; Kohn Citation2006).
Diets for dairy cows are formulated on a DM basis, while in practice, individual feeds are included in the TMR on an as-fed basis. In their survey, Shaver and Kaiser (Citation2004) found that forage in diets for high-yielding cows ranged from 45 to 53% (DM basis) and corn silage was comprised of 41–68% (DM basis), thus its moisture variation could strongly influence the nutritional content of the diet. Weiss et al. (Citation2012) observed large variability in DM concentration of alfalfa and corn silage in samples collected within farms in both long-term and short-term periods. The variability of moisture content of wet feeds (mainly silages) directly influences the amount of DM and its nutrient composition. Furthermore, the variability of the DM content of TMR modifies the palatability and affects the sorting of ingredients (Leonardi et al. Citation2005; Eastridge Citation2006), generating additional variability on dry matter and nutrient intake, and increasing individual nutrient imbalance. The consequence could be a different fermentable energy intake, which in turn has been observed to alter milk cheese-making features (Calamari et al. Citation2010). Moreover, this aspect could occur more often when diets are largely based on silages, and this could be the case of the diets fed to cows of the farms producing milk for Grana Padano cheese, the main PDO of the Po river valley, which represents the largest plain area of Northern Italy. In fact, in farms that deliver milk for the production of Grana Padano cheese, the corn silage is the mainstay forage base, and on average the amount included in the ration for lactating cows is 23 kg/head per day (Mantovi et al. Citation2015), while, other silage (Lolium sp., Sorghum, Triticale, Wheat) are included in smaller amount (Mantovi et al. Citation2015).
To improve the TMR consistency, different strategies have been proposed (Weiss and St-Pierre 2009), and the most recent is a system based on a near infra-red (NIR) scanner (Barbi et al. Citation2010). The NIR Analyzer mounted on the scraper of the front miller performs a real-time NIR dry matter analysis of each ingredient and adapts their load from the as-fed to the dry matter weight, then ameliorating the TMR consistency, maintaining more constant the amount of distributed DM and the nutritional characteristics of TMR. A TMR as close as possible to the theoretical value should aid to reduce the metabolic disorders, crucial aspect for dairy cow in early lactation, which is its most critical phase. Therefore, the aim of the research was to evaluate the application in commercial farms of a precision feeding system on metabolic conditions and milk yield of lactating dairy cows.
Materials and methods
Animal and management
The research protocol and the animal care were in accordance with the Directive 2010/63/EU of the European Parliament and of the Council of September 22, 2010, on the protection of animals used for scientific purposes.
The current study was carried out on 7 dairy farms in Po Valley (Mantova and Brescia province). Their herd sizes were 110, 330, 600, 320, 210, 150, and 230 (herds A, B, C, D, E, F, and G respectively) adult cows, all of Holstein Friesian breed. The herds were representative of the typical herds of the Grana Padano area and were willing to participate in this study. All herds were in freestall barn and the lactating cows were kept in one pen and were fed TMR once a day in the morning. To ensure cows had ad libitum access to the TMR, the amount offered to the cows was assessed on a daily basis with the aim of producing from 3 to 8% refusal. Cows were milked twice daily (0300–0500 and 1500–1700 h).
All the herds involved in the trial were equipped with the dg precisionFEEDINGTM (Dinamica Generale, s.p.a., Mantova, ITALY), installed on the TMR wagon. The kit was constituted by: (1) DTMTM software for feeding management. It provided a full control on ingredients inventory; (2) Top Scale Indicator, a microcomputer installed on TMR wagon. It provided the sequence of loading of single feed, the record of the loading process and the adjustment of the load of single feed on the basis of their moisture to respect the target DM weight; (3) a NIR scanner (IRMTM FM). The IRM NIR Analyzer was mounted on the scraper of the front miller and performed a real-time NIR dry matter analysis of each ingredient.
The dg precisionFEEDINGTM (PFS) was installed in autumn 2014 on the TMR wagon in each herd involved in the trial. After a period of training (pre-experimental period), the experimental period started at the beginning of February 2015. The experimental design was a cross-over, consisting of two consecutive periods of 14 weeks each (Table ). The system was switched ON/OFF and OFF/ON between the two periods in each herd. In all herds and during both periods the PFS measured daily the DM of each silage loaded in the TMR wagon and, when the system was OFF no correction on the amount of silages to be loaded was applied by the system (PF-OFF). Conversely, when the system was ON, the system suggested to the operator a correction of the amount of silages to be loaded according to their DM (PF-ON).
Table 1. Experimental design.
At the end of each experimental period in every herd, 14 lactating multiparous dairy cows: 7 cows at 30–90 DIM and 7 at 150–220 DIM on sampling day and declared healthy by vets of the herds, were selected and checked for afternoon milk yield and composition, and the following morning, before TMR distribution, blood samples from jugular vein were withdrawn in tubes with Li-heparin as anticoagulant for metabolic profile determination. Just after blood sampling faeces samples have been collected. Cows checked at the end of the two experimental periods were different, i.e. early lactating cows checked in the first period were not checked as mid-lactating in the second.
Feed and diets sampling and analyses
Representative samples of forages, concentrate mixtures, and TMR were collected on days 0, 49 and 98 of each period for a total of 6 samples for each feed in each farm. DM was measured after oven drying at 65 °C till constant weight. After grinding, samples were analysed for crude protein (CP; 992.23, AOAC, 2005), ash (942.05, AOAC 2005), starch (996.11, AOAC 2005, using a K-TSTA assay kit, Megazyme International, Bray, Ireland). Neutral detergent fibre (NDF) and non-fibrous carbohydrates (NFC) were determined according to Van Soest et al. (Citation1991). Representative silages samples were also collected every month to measure moisture, which was used to update the recipe diet. The amount of each feed distributed to all lactating cows was recorded daily. At the end of the experimental period, for calculations and comparisons, the DM distributed to cows and the chemical characteristics of the TMR were calculated following three methods: (1) target diet (TD): calculated according to the amount of feeds in the recipe, and applying the DM determined in laboratory. The TD was used as reference diet and compared to the 2 following diets; (2) real diet (RD): calculated using the amount of each feed effectively loaded in the TMR wagon, and applying the DM of silages measured by the PFS; (3) real diet without operator error (RDWOE): retrospectively, elaborating the data obtained by PFS, loads of dry feeds different from target diet have been observed. These differences confounded the correction operated by the PFS, so to bring out the effect of PFS, RDWOE diets were calculated keeping fixed the amount of dry feeds (hays and concentrates) according to the recipe, using the amount of each wet feed (silages) effectively loaded in the TMR wagon, and applying the DM of silages measured by the PFS.
The DM delivered and the characteristics of the three diets, as well as the deviation among TD (used as reference diet) with RD and RDWOE, have been calculated daily. In all these calculations orts have not been considered.
Blood sampling and analyses
Blood samples were collected from the jugular vein in 10-mL Li-heparin tubes (Vacuette, containing 18 IU of Li-heparin mL-1, Kremsmünster, Austria) before the diet distribution, and immediately placed in an ice-water bath. A small amount of blood was used for haematocrit (Packed Cell Volume; PCV) determination in a capillary tube after high-speed centrifugation (15,000 × g for 10 min at room temperature). The remaining blood was centrifuged (3500 × g for 16 min at 4 °C) and the plasma was separated into several aliquots for storage at −20 °C until further analysis. Plasma metabolites were analysed at 37 °C by automated clinical analyser (ILAB 600, Instrumentation Laboratory, Lexington, MA). Kits purchased from IL (Instrumentation Laboratory, Lexington, MA) were used to measure glucose, total cholesterol, calcium, inorganic phosphorus, magnesium, total protein, albumin, and total bilirubin with colorimetric methods, urea with enzymatic method, while zinc was determined colorimetrically using a kit purchased Wako (Wako, Chemicals GmbH, Neuss, Germany). Kinetic analysis was used to determine activity of alkaline phosphatase (AP, EC 3.1.3.1), aspartate aminotransferase (AST, EC 2.6.1.1), γ-glutamyltransferase (GGT, EC 2.3.2.2) using commercial kits (Instrumentation Laboratory, Lexington, MA). Ceruloplasmin (Cp) and haptoglobin were determined with reagents prepared according to the methods reported by Calamari et al. (Citation2016a).
Animals inspection
After blood collection the animals were exteriorly examined according to the Integrated Diagnostic System Welfare (Calamari and Bertoni Citation2009) to evaluate effect of treatment on animal welfare. During the examination the following scores were evaluated:
cleanliness score (with scale from 1 to 5), observed in five anatomical areas (thigh, anogenital, foot-hock, rear-udder, lateral udder);
teat score (with scale from 1 to 5);
hoof and leg score (with scale from 1 to 5);
body condition score (with scale from 1 to 4; ADAS Citation1986).
Fecal sampling and analyses
Fecal sample was collected from the rectal ampulla, after blood sampling. Immediately after collection, the samples were delivered to the laboratory and after the measure of pH (potentiometric method) the DM content was determined in a ventilated oven at 65 °C. For volatile fatty acids (VFA) analysis, 10 g of fresh faecal sample were added with 90 mL of distilled water and homogenised for 2 min at normal speed, in a Stomacher (Seward Stomacher® 400 Circulator, International PBI, Milano). The homogenates were stored in aliquots at −20 °C until analysis. The VFA were analysed by gas chromatography using the method described by Minuti et al. (Citation2014).
Milk sampling and analyses
Representative milk samples were collected during the p.m. milking on the day before blood samples collection and immediately delivered to the laboratory. The analyses were performed on fresh samples. Fat, protein, lactose, and casein were determined using infra-red instrumentation (MilkoScan FT 120, Foss Electric, Hillerod, Denmark). Titratable acidity was also measured with MilkoScan FT 120 by using internal prediction model (Calamari et al. Citation2016b). Somatic cell count was measured using optofluorometric method (Fossomatic 5000, Foss Electric). Rennet coagulation properties (RCT: rennet clotting time, k20: curd firming rate, and a30: curd firmness) were measured using a computerised renneting metre (Foss Electric), where 12 mL of milk were heated to 35 °C, and 240 μL of rennet (Hansen standard 190 with 63% chymosin and 37% pepsin, Pacovis Amrein AG, Bern, Switzerland) diluted to 1.6% (wt/wt) in distilled water was added to milk.
Data processing and statistical analysis
The daily amount of milk delivered to cheese factory by each herd was used to calculate milk production on a weekly basis. The feeding cost was calculated on a weekly basis by using the amount of all feeds delivered daily to all lactating and dry cows. The calculation was performed applying a market price for each feed type, and maintaining constant these prices in all herds and throughout the time. The feeding cost per kg of milk was then calculated on a weekly basis, utilising the daily amount of milk delivered to cheese factory calculated always on a weekly basis.
All statistical analyses were performed using the statistical software package SAS 9.2 (SAS Inst. Inc., Cary, NC). Data were tested for non-normality by the Shapiro–Wilk test (SAS Inst. Inc.). In case of non-normality, parameters were normalised by log or exponential transformation. The blood and milk results from the 196 samples collected (at the end of the 2 periods, 7 cows for 2 stages of lactation, for 7 farms have been sampled) were analysed with ANOVA using a mixed model (MIXED procedure of SAS, SAS Inst. Inc.). The model included the effect of the precision feeding system (PFS) (2 levels: PF-ON and PF-OFF), lactation phase (LP) (2 levels: early and mid-lactation), period (2 levels), the interaction between PFS × LP and PFS × period and herd (7 levels), which was considered as subject for repeated measure. For each treatment, least squares means were computed, and preplanned pairwise comparisons (PDIFF option, SAS Inst. Inc.) were conducted when the F-test of one of the main factors (PFS, LP, and their interaction) was lower of 0.10. Statistical significance was designated as p < .05 and tendencies were declared at p < .10.
Diet evaluations and feeding cost were processed with repeated-measures ANOVA using a mixed model (MIXED procedure; SAS Inst. Inc.). The model included the effect of PFS (2 levels: PF-OFF and PF-ON), period (2 levels), week (14 levels), interaction PFS × week and herd (7 levels), which was considered as subject for repeated measure. The analysis was carried out using 3 covariance structures: autoregressive order, compound symmetry, and spatial power. These were ranked according to their Akaike and Schwarz Bayesian information criteria, with the one having the least information criterion value being eventually chosen (Littell et al. Citation1998). For each treatment, least squares means were computed, and comparison between PF-ON and PF-OFF in each week (PDIFF option, SAS Inst. Inc.) was conducted when the F-test of one of the main factors (PFS or interaction of PFS with week) was lower than 0.10.
Results
The trial was carried out in herds located in the area of Grana Padano cheese and the diet of lactating cows was based on corn silages in all herds (Table ). Actual inclusion of DM (determined in laboratory) from silage, mainly corn silage, expressed on total DM of TMR ranged from 22% as average value in herd A to 45% in herd C.
Table 2. Composition (mean and SD, expressed as DM) and main nutrient characteristics of TMRs used during the trial.
The CP concentration of the TMR samples collected during the trial was on average 16.3% DM, ranging among herds between 15.8 and 16.9% DM (Table ). The starch concentration of lactating TMR was on average 25.3% DM (Table ), ranging among herds between 21.8 and 27.9% DM. The NDF concentration of lactating TMR was on average 30.4% DM (Table ), ranging among herds between 29.0 and 32.1% DM.
The deviations among the DM of the target diet (TD) and the DM delivered with real diet (RD), or retrospectively calculated without the operator error (RDWOE) are shown in Table . Average difference between DM of RD and TD did not differ when PFS was used (PF-ON) or not (PF-OFF), but tended to be more closed to target value with PF-ON when the operator errors (RDWOE) were computed (Table ). With regard to nutrient content, only percentage of crude protein tended to be different between PF-OFF and PF-ON, but also in this case only in RDWOE, with lower value (so more close to TD) with PF-ON. Moreover, the absolute difference between the CP content, between RD and TD TMR, was on average 4.2% and 5.5% of the CP of TD, with the PF-ON and PF-OFF, respectively. No significant difference between PF-ON and PF-OFF were observed for the content of diets in NDF and starch. With the PF-OFF (no correction of amount of silages to be loaded according to silages DM content measured with NIR), the DM effectively delivered ranged between 97% (5th percentile) and 109.8% (95th percentile) of the DM of TD (Table ). With the PF-ON the DM delivered was closer to the DM of the TD (from 99.7 to 105.7%, 5th percentile and 95th percentile, respectively). However, an asymmetrical distribution around the DM of the TD was observed, with majority of greater values than lower values respect to the DM of the TD. In Table is also reported the variability of the DM delivered daily without operator error (RDWOE). These values better highlight the effect of the system in order to maintain constant the DM effectively distributed. With the PF-ON the values of DM delivered daily and calculated with this approach was very close to the TD (from 98.8 to 101.5%, 5th percentile and 95th percentile respectively), meanwhile a greater variability was observed with PF-OFF (from 96 to 107.0%, 5th percentile and 95th percentile respectively). The wide variability of DM delivered during the study and its reduction with PF-ON, could explain the significative interaction PFS*WK reported in Table .
Table 3. Mean differences of DM distributed daily and of its content (%) of crude protein (CP), NDF and starch as consequence of the variability in the DM content of silagesTable Footnotea.
Table 4. Difference of DM (kg/head d – in brackets calculated as %) of real diet with or without operator error respect to target diet as consequence of the variability in the DM content of silagesTable Footnotea.
The variability of the content of DM in silages affected the DM effectively loaded in the TMR wagon, and consequently influenced the moisture of the TMR and the concentration of the nutrient of the diet effectively delivered. On average the moisture of the TMR calculated daily for real diet (RD) was 46.1 ± 6.5% (range 35.5 to 55.3%) and 47.8 ± 6.1% (range 37.4 to 55.1%) with PF-OFF and PF-ON, respectively.
The cows selected for blood sampling were in early lactation (71 ± 22 and 64 ± 18 DIM with PF-ON and PF-OFF, respectively) and in mid lactation (206 ± 35 and 193 ± 27 DIM with PF-ON and PF-OFF, respectively). A significant effect of lactation phase (p = .008) and its interaction with the precision feeding system (PFS) effect (p = .07) was observed for plasma urea (Table ). Urea was lower (p < .05) with PF-ON vs. PF-OFF only in early lactating cows (Figure ). Also total cholesterol differed between PF-ON and PF-OFF only in early lactating cows, with greater values (p < .10) with PF-ON vs. PF-OFF (Figure ).
Figure 1. Urea (a), total cholesterol (b), Ca (c), and Zn (d) in plasma of dairy cows fed TMR managed by using the precision feeding. The precision feeding system measured daily the DM of each silage loaded in the TMR wagon and did not suggest correction on the amount of silages to be loaded (PF-OFF) or suggested the correction of the amount of silages to be loaded according the result of their DM (PF-ON). Values are least squares means, and vertical bars represent SEM. (α, β: p < .10; a, b: p < .05; A, B: p < .001).
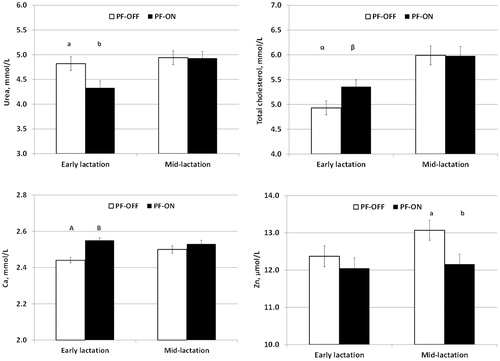
Table 5. Plasma variables (Least Squares Means) observed in dairy cows fed TMR managed by using (PF-ON) or not (PF-OFF) a precision feeding system.
Among minerals a significant effect of PFS for Ca, inorganic P, and Zn was observed (Table ). In particular for Ca was observed a significant interaction between PFS effect and lactation phase (p = .028), with greater values with PF-ON vs. PF-OFF only in early lactating cows (Figure ). Plasma Zn was greater (p < .05) in PF-OFF compared with PF-ON only in mid lactating cows (Figure ). Among the other plasma variables, only AP showed a tendency (p = .10) with greater values with PF-ON vs. PF-OFF.
Faecal characteristics were not affected by the PFS (Table ). Significant interaction between PFS and lactation phase was observed only for butyric acid (C4).
Table 6. DM, pH, and VFA observed in samples of faeces collected from dairy cows fed TMR managed by using (PF-ON) or not (PF-OFF) a precision feeding system.
In cows subjected to individual milk measurement, only a slight and not significant increase in milk yield was observed with PF-ON vs. PF-OFF (Table ). The main milk component changed according to the lactation phase, but neither effect of PFS nor its interaction with lactation phase was observed, with the exception of clotting features, with more favourable values in PF-OFF: lower rennet clotting time (p < .05) and higher curd firmness (p < .05).
Table 7. Milk yield and milk characteristics (Least Squares Means) observed in dairy cows fed TMR managed by using (PF-ON) or not (PF-OFF) a precision feeding system.
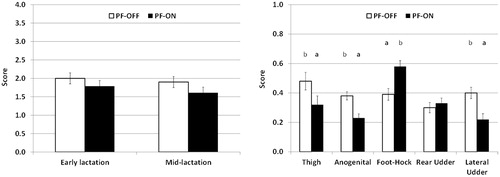
Among the results obtained from the animal inspection, only cleanliness showed a significant effect of the PFS. The effect was not significant for the overall cleanliness score obtained from the aggregation of the cleanliness score of each anatomical area (Figure ). Conversely, the score for some anatomical areas significantly differed (Figure ). Cleaner area (i.e. lower scores) were observed with PF-ON vs. PF-OFF for thigh, anogenital area, and lateral udder (p < .05). Cleaner foot-hock (p < .05) was conversely observed with PF-OFF compared with PF-ON. Body condition score did not differ between PF-ON and PF-OFF and in early lactating cows was on average 2.15 ± 0.23 with PF-ON and 2.11 ± 0.26 with PF-OFF. In mid lactating cows the average value of BCS was 2.24 ± 0.30 with PF-ON and 2.14 ± 0.26 with PF-OFF.
Figure 2. Global (a) and specific (b) cleanliness score of anatomical areas in dairy cows fed TMR managed by using the precision feeding. The precision feeding system measured daily the DM of each silage loaded in the TMR wagon and did not suggest correction on the amount of silages to be loaded (PF-OFF) or suggested the correction of the amount of silages to be loaded according the result of their DM (PF-ON). Values are least squares means, and vertical bars represent SEM. (a, b: p < .05).
The milk feeding cost was affected by the PFS, as consequence of the increase of total daily milk yield (+2.4%) and reduced total daily DM delivered (−1.35%) when PFS was active (PF-ON). On average the milk feeding cost was 0.177 vs. 0.188 €/kg of milk (p < .001) with PF-ON vs. PF-OFF. An interaction between PFS and week (p = .10) was observed, and the maximum difference between PF-ON and PF-OFF was observed at the end of the period, reaching a value of 0.171 €/kg of milk with PF-ON compared with a value of 0.196 €/kg of milk with PF-OFF.
Discussion
The diets for lactating cows used in the selected farms in this study were based on corn silage and the average amount used was close to data reported by Mantovi et al. (Citation2015). Overall, the amount of silage represented 36.7% of DM distributed with the TMR. Variations in moisture of silages observed in this study resulted in great instability in the amount and characteristics of the TMR (Table ), and the use of systems to control the variation of DM of silages was effective on the consistency of the TMR distributed daily, in fact variability of DM of TMRs was lower when system was active (PF-ON; Table ).
The daily variation of the moisture of silages affected the moisture of the TMR and consequently the daily amount of DM delivered per cow, as well as the nutrient composition of TMR, these short-term changes could have short-term effects on DMI and milk yield, though, mid-lactating cows in experimental conditions seemed to adapt quickly to similar dietary changes when the TMR offered daily was rigorously controlled for a target of 5% feed refusal (McBeth et al. Citation2013). The system used in our study was based on real time control of silage moisture, allowing to load, in the TMR wagon, the exact amount of the DM defined in the recipe for each silage, reducing the daily variability in the TMR characteristics. The daily deviation from TD was also affected by the operator error, due to a tendency to load into the TMR wagon more concentrate than the value indicated in the recipe. This increased the variability in the TMR characteristics, with either PF-OFF or PF-ON, however variability resulted lower with PF-ON. This also caused an asymmetrical distribution of the differences between the TMR delivered daily and the characteristics of the target TMR. Moreover, PFS can be useful in the practice since it is able to bring out any error made during the loading phase of the TMR.
The moisture contents of the TMR used in the dairy farms involved in this study were included in the range (40–60%) indicated by Eastridge (Citation2006) for high-yielding dairy herds, outside this range lower DMI may occur and TMR with less than 40% of moisture may result in higher sorting (Eastridge Citation2006). In our study the moisture of the TMR was sometimes close or lower to the threshold of the 40%, and this was observed particularly when the precision feeding system (PFS) was OFF, then, a TMR so dry likely allowed a higher sorting, and, consequently, a greater inconsistency of nutrient intake (Leonardi and Armentano Citation2003). In similar condition, this has been shown to affect milk yield of the herd (Sova et al. Citation2013). Moreover, excessive sorting of TMR could result in over-consumption of rapidly fermentable carbohydrates, with an increased risk of subacute rumen acidosis (DeVries et al. Citation2008).
Among the blood parameters related to the protein metabolism, a lower plasma urea concentration with PF-ON compared with PF-OFF was observed, but only in early lactating cows (Figure ). Many factors affect blood and milk urea (Spek et al. Citation2013), and besides the lactation phase (Bertoni et al. Citation1995; Godden et al. Citation2001), milk yield is one of main. Milk yield triggers DMI and then protein intake, influencing energy and protein balance, with consequences on blood urea concentration. In this study milk yield and milk protein concentration did not differ between cows fed with PF-ON compared with those fed with PF-OFF, but feed protein intake may have been more regular with PF-ON, since delivered DM and its protein content were less variable and closer to target values with PF-ON. Moreover, the variability in TMR moisture could have promoted sorting in cows fed diet with PF-OFF, this added to higher variability of DM distributed always observed with PF-OFF, could have caused alternating period of abundance or shortage of nutrients. These variations could promote higher rumen deamination during abundance or catabolic processes during the shortage of nutrients and mainly before TMR distribution, in both cases resulting in a greater release of NH3 and urea synthesis (Bertoni Citation1995). The early lactating cows could be more susceptible to these challenges because characterised by greater requirements. Because the blood samples were collected just before TMR distribution, this hypothesis could be plausible and could contribute to explain the difference in blood urea in early lactating cows. Moreover, the lower values of urea observed with PF-ON could also imply a greater efficiency nitrogen use.
The blood parameters related to inflammation (haptoglobin, ceruloplasmin, cholesterol, albumin and globulin) do not indicate a different health condition between cows fed diet with PF-ON compared with those fed diet with PF-OFF. Only lower values of plasma Zn, observed in cows fed diet with PF-ON, seems to indicate a better situation in PF-OFF. Anyway, this is contradicted by the lower levels of Ca and P in blood of cows at the end of PF-OFF period. In fact, during inflammation, a reduction of Ca and P in blood of dairy cows (Waldron et al. Citation2003), sheep (Minuti et al. Citation2013, Citation2014) and sows (Wang et al. Citation2006) has been observed. Nevertheless, the blood concentrations of Ca, P and Zn in cows at the end both periods were within the reference range (Bertoni and Trevisi Citation2013), so the differences observed seem of minor importance.
The level of total VFA concentration in faeces is affected by production of VFA and rate of absorption into the hindgut. The production of VFA is related to the amount of carbohydrates (starch and fibre) entering into the hindgut, and the majority of VFA produced in the hindgut are passively absorbed across the intestinal epithelium (Gressley et al. Citation2011). In this study the VFA concentration and their proportion in faecal samples did not differ between groups. Also the faecal pH did not differ. A tendency to lower faecal DM was observed in PF-OFF compared with PF-ON (p = .13). The faecal DM is negatively correlated with the NDF and ADF content in faeces (Ireland-Perry and Stallings Citation1993), for the greater capacity of the fibre to retain water. This could suggest that a greater amount of structural carbohydrate entered in the hindgut and in turn increased hindgut fermentation creating favourable conditions for an intestinal barrier lesions and consequent endotoxemia (Lambert Citation2009). This speculation could contribute to explain the slightly lower blood levels of Ca and P (likely for a lower gut absorption) observed in PF-OFF cows. Furthermore, manure consistency, which is related to level of feed digestion, is included among the factors associated with the level of cleanliness of animals (Hauge et al. Citation2012), and the greater dirt of the ano-genital area observed in PF-OFF cows seems to support more soft and poorly digested stools in these cows.
Daily milk yield calculated on a weekly basis as mean of total milk delivered to cheese factory divided by milked cows was unaffected by PFS. The main milk characteristics were similar between groups. The fat and protein concentration in milk observed in this study are slightly lower than the average values of the Holstein-Friesian cows observed in 2017 national survey (on average 3.75% and 3.30% w/v for fat and protein, respectively). This could be related to the effect of the lactation phase, checked cows where in early and mid-lactation, so in the phase where fat and protein contents are on average lower and, in addition, the study was performed in spring, season in which is well known occurring a natural reduction of milk components’ content. The rennet coagulation properties observed in this study, compared with the optimal values reported by Bittante et al. (Citation2012), showed higher RCT and lower a30. Also for these milk characteristics, there is an effect of lactation phase, with a worsening of the rennet clotting properties in early-mid lactation, and controversial results, i.e. worsening (i.e. longer) of RTC and a30 (i.e. less wide) and an improvement of k20 (i.e. shorter) in PF-ON, compared with PF-OFF, do not allow to draw definitive considerations about the effect of PFS on milk protein clotting.
Lastly, utilising the data from last week of each period, with PF-ON it has been calculated a slightly lower DM delivered to the cow (−1.3%) and a slightly higher milk yield (+2.4%). At the actual market price of feeds and milk, these differences have determined a reduction of feeding cost: on average 0.177 vs 0.188 €/kg of milk, for PF-ON vs PF-OFF.
Conclusions
TMR is used in the feeding of cows because in addition to providing all the nutrients at the same time, it should have the advantage of providing a constant supply over time. Our study shows that this is not always true, but due to the variations in the moisture of silages and operator error, TMR has wide variations even in relatively short periods. Our study has shown that the PFS used reduces the variability within TMR, both as DM and as nutritional characteristics, and in particular its protein content. This greater consistency could determine better metabolic conditions that are likely to improve yield and the economic efficiency of cattle breeding.
The results obtained in this study show that the device adopted for a more precision feeding, based on a near infra-red (NIR) scanner and performing a weight-adjustment of feed loaded on actual DM, was able to improve the consistency of the TMR in term of DM delivered and its chemical characteristics. The greater consistency of the TMR could have contributed to decrease metabolic alterations, which suggest a better efficiency of nutrient utilisation, from which seems to derive lower management costs.
Acknowledgments
The authors thank Dr. Angelo Stroppa (Grana Padano Consortium), engineers Andrea Ghiraldi and Alberto Barbi (Dinamica Generale, S.p.A.), and the farmers where the study was carried out.
Disclosure statement
The authors declare that there is no conflict of interest associated with the paper. The authors alone are responsible for the content and writing of this article.
Additional information
Funding
Related Research Data
References
- ADAS (Agricultural Development and Advisory Service) 1986 – Condition scoring of dairy cows. Ministry of Agriculture, Fisheries and Food (Publications), Lion House, Alnwick, P612.
- Babinszky L, Halas V. 2009. Innovative swine nutrition: some present and potential applications of latest scientific findings for safe pork production. Ital J Anim Sci. 8:7–20.
- Banhazi TM, Babinszky L, Halas V, Tscharke M. 2012. Precision livestock farming: precision feeding technologies and sustainable livestock production. Int J Agric Biol Eng. 5:54–61.
- Barbi A, Ghiraldi A, Manzoli M, Berzaghi P. 2010. Precision feeding: NIR on line for improving TMR consistency. The First North American Conference on Precision Dairy Management, Toronto, March 2-5.
- Bertoni G. 1995. Reference values and interpretation of urea levels in blood and milk. In Urea in milk: causes of variation, consequences for the animal and advices to correct. AIA, Rome. pp. 103–112.
- Bertoni G, Trevisi E. 2013. Use of the liver activity index and other metabolic variables in the assessment of metabolic health in dairy herds. Vet Clin North Am Food Anim Pract. 29:413–431.
- Bertoni G, Lombardelli R, Cappa V. 1995. Metabolite and hormone diurnal variations in the physiological phases of dairy cows. Zoot Nutr Anim. 21:271–283.
- Bittante G, Penasa M, Cecchinato A. 2012. Invited review: genetics and modeling of milk coagulation properties. J Dairy Sci. 95:6843–6870.
- Calamari L, Bertoni G. 2009. Model to evaluate welfare in dairy cow farms. Ital J Anim Sci.. 8:301–323.
- Calamari L, Piccioli-Cappelli F, Bani P, Maianti MG, Bertoni G. 2010. Effect of feeding dairy cows diets with different fermentable energy on milk cheese-making features. pp 679–680 in: 3rd EAAP International Symposium on “Energy And Protein Metabolism And Nutrition” (G.M. Crovetto ed.) - Parma (Italy), 6 -10 September 2010. EAAP publication No. 127.
- Calamari L, Ferrari A, Minuti A, Trevisi E. 2016a. Assessment of the main plasma parameters included in a metabolic profile of dairy cow based on Fourier Transform mid-infrared spectroscopy: preliminary results. BMC Vet Res. 12:4.
- Calamari L, Gobbi L, Bani P. 2016b. Improving the prediction ability of FT-MIR spectroscopy to assess titratable acidity in cow's milk. Food Chem. 192:477–484.
- DeVries TJ, Dohme F, Beauchemin KA. 2008. Repeated ruminal acidosis challenges in lactating dairy cows at high and low risk for developing acidosis: feed sorting. J Dairy Sci. 91:3958–3967.
- Eastridge ML. 2006. Major advances in applied dairy cattle nutrition. J Dairy Sci. 89:1311–1323.
- Fadel JG, Johnson HA, Robinson PH. 2006. Impact of variation in diet nutrient inputs on model output prediction. J Dairy Sci. 89:383.
- Godden SM, Lissemore KD, Kelton DF, Leslie KE, Walton JS, Lumsden JH. 2001. Factors associated with milk urea concentrations in Ontario dairy cows. J Dairy Sci. 84:107–114.
- Gressley TF, Hall MB, Armentano LE. 2011. Ruminant Nutrition Symposium: productivity, digestion, and health responses to hindgut acidosis in ruminants. J Anim Sci. 89:1120–1130.
- Hauge SJ, Kielland C, Ringdal G, Skjerve E, Nafstad O. 2012. Factors associated with cattle cleanliness on Norwegian dairy farms. J Dairy Sci. 95:2485–2496.
- Kohn RA. 2006. How can dairy nutrition models deal with uncertainty? J Dairy Sci. 89:382.
- Ireland-Perry RL, Stallings CC. 1993. Fecal consistency as related to dietary composition in lactating Holstein cows. J Dairy Sci. 76:1074–1082.
- Lambert GP. 2009. Stress-induced gastrointestinal barrier dysfunction and its inflammatory effects. J Anim Sci. 87:E101–E108.
- Leonardi C, Armentano LE. 2003. Effect of quantity, quality, and length of alfalfa hay on selective consumption by dairy cows. J Dairy Sci. 86:557–564.
- Leonardi C, Giannico F, Armentano LE. 2005. Effect of water addition on selective consumption (sorting) of dry diets by dairy cattle. J Dairy Sci. 88:1043–1049.
- Littell RC, Henry PR, Ammerman CB. 1998. Statistical analysis of repeated measures data using SAS procedures. J Anim Sci. 76:1216–1231.
- Mantovi P, Dal Prà A, Pacchioli MT, Ligabue M. 2015. Forage production and use in the dairy farming systems of Northern Italy. In Grassland and forages in high output dairy farming systems. Ed. Wageningen Academic Publishers (The Netherland) and European Grassland Federation EGF (Zürich, Switzerland), 67–76.
- McBeth LR, St-Pierre NR, Shoemaker DE, Weiss WP. 2013. Effects of transient changes in silage dry matter concentration on lactating dairy cows. J Dairy Sci. 96:3924–3935.
- Minuti A, Ahmed S, Trevisi E, Piccioli-Cappelli F, Bertoni G, Bani P. 2013. Assessment of gastrointestinal permeability by lactulose test in sheep after repeated indomethacin treatment. J Anim Sci. 91:5646–5653.
- Minuti A, Ahmed S, Trevisi E, Piccioli-Cappelli F, Bertoni G, Jahan N, Bani P. 2014. Experimental acute rumen acidosis in sheep: consequences on clinical, rumen, and gastrointestinal permeability conditions and blood chemistry. J Anim Sci. 92:3966–3977.
- Nääs I. 2001. Precision animal production. Agr Eng Int GIGR J Scient Res Dev. 3:1–10.
- Shaver R, Kaiser R. 2004. Feeding programs in high producing dairy herds. pp:143–170 in Proc. Tri-State Dairy Nutrition Conference, Fort Wayne, IN. The Ohio State Univ., Columbus.
- Sova AD, LeBlanc SL, McBride BW, DeVries TJ. 2013. Associations between herd-level feeding management practices, feed sorting, and milk production in free-stall dairy farms. J Dairy Sci. 96:4759–4770.
- Spek JW, Dijkstra J, Van Duinkerken G, Bannink A. 2013. A review of factors influencing milk urea concentration and its relationship with urinary urea excretion in lactating dairy cattle. J Agric Sci. 151:407–423.
- Stone B. 2008. Reducing the variation between formulated and consumed rations. Adv Dairy Technol. 20:145–162.
- Van Soest PJ, Robertson JB, Lewis BA. 1991. Methods for dietary fiber, neutral detergent fiber, and non-starch polysaccharides in relation to animal nutrition. J Dairy Sci. 74:3583–3597.
- Waldron MR, Nonnecke BJ, Nishida T, Horst RL, Overton TR. 2003. Effect of lipopolysaccharide infusion on serum macromineral and vitamin D concentrations in dairy cows. J Dairy Sci. 86:3440–3446.
- Wang JF, Wang M, Ma JL, Jiao LG, Zhou XY, Lindberg LE. 2006. The influence of intramammary lipopolysaccharide infusion on serum Ca, P, vitamin D, cytokines and cortisol concentrations in lactating sows. J Vet Med Series A. 53:113–118.
- Weiss WP, Shoemaker DE, McBeth LR, Yoder P, St-Pierre NR. 2012. Within farm variation in nutrient composition of feeds. Pages 103–117 in Proc. Tri-State Dairy Nutrition Conference, Fort Wayne, IN. The Ohio State Univ., Columbus.
- Weiss WP, St-Pierre NR. 2009. Impact and Management of Variability in Feed and Diet Composition. Pages 83-90 in Proc. Tri-State Dairy Nutrition Conference, April 21-22, 83-90.