
 ?Mathematical formulae have been encoded as MathML and are displayed in this HTML version using MathJax in order to improve their display. Uncheck the box to turn MathJax off. This feature requires Javascript. Click on a formula to zoom.
Abstract
Copy number variations (CNVs) can cause radical changes in phenotype variation, gene expression and evolutionary adaptation, through gene dosage effects, disruption of transcript arrangement and regulatory polymorphisms. Therefore, the current study was undertaken to investigate the distribution of glypican1 (GPC1) CNVs in five domestic yak breeds, and their association growth traits and gene expression. The data were analysed using real-time quantitative PCR (qPCR). Loss and normal copy number types had a significant (p < .05) associated with body height, weight and length and chest girth than gain of copy number types. Population studies indicated that loss of copy number was more frequently observed in the Tianzhu, Gannan and Plateau yaks than the Polled and Datong yaks. We elucidated a moderately negative and highly significant (p < .005) correlation among DNA copy numbers and mRNA transcription levels of GPC1. From these results, we hypothesise that GPC1 CNVs could alter mRNA transcription levels of skeletal muscles which impact on quantitative of growth traits. Our study makes data available for breeders and genomics studies focussing on the fundamental function of GPC1 CNVs in gene expression and growth traits and presents the foundation for future molecular marker application in designing yak breeding programmes.
The GPC1 gene encompasses within CNVRs of yak individuals that overlap with growth traits.
The copy number types of GPC1 had a significant associated with growth traits of yak breeds
Negative and highly significant correlation among DNA copy numbers and mRNA transcription levels of GPC1 are obtained
Highlights
Introduction
The yak (Bos grunniens) is one of the world’s most significant domestic animals and survives in the extremely harsh environment of the Qinghai-Tibetan Plateau ‘roof of the world’ (Wiener et al. Citation2003). Long hair and large horns are particular phenotypic characteristics of the yak, which is an iconic symbol of animal husbandry at the Qinghai-Tibetan Plateau (Liu et al. Citation2014). Indeed, the yak has become strongly integrated into Tibetans’ socio-cultural life (Liang et al. Citation2016) and occupies a significant economic role in the mountainous regions of Asia (Medugorac et al. Citation2017); they provide milk, meat, transportation (‘boat of the Plateau’), hair, draught power and fuel for dwellers in high-altitude environments (Wiener et al. Citation2003). Notably, the publication of genome assembly version 1.1 (Yak 1.1.) of Bos grunniens, which is comparable with the cattle genome (UMD 3.1), is significantly important for envisaging gene and protein function and providing genomic sequence data (Hu et al. Citation2012). In previous studies, genetic variation in livestock has been described using microsatellites (Curi et al. Citation2005) and single-nucleotide polymorphisms (SNPs) (Utsunomiya et al. Citation2013). Until recently, SNPs were considered nucleotide variations detected during genome sequencing, and the most important cause of genetic variation by the livestock research community. For this reason, many studies have utilised SNP markers for genetic improvement of beef and dairy cattle (Hayes et al. Citation2009; VanRaden et al. Citation2009; Wiggans et al. Citation2009). The development of yak gene-specific SNPs for adaptation mechanisms to hypoxia and growth, and detection of the causal mutation of polledness in yak breeds have been reported (Liu et al. Citation2014; Wu et al. Citation2015; Lan et al. Citation2018). However, Henrichsen, Chaignat, et al. (Citation2009) reported that CNVs are significant sources of genetic variation and play a major role in phenotypic diversity and evolutionary adaptation (Zhang et al. Citation2009; Hou et al. Citation2011); variation in the number of gene copies in the genome (Redon et al. Citation2006; Zhang et al. Citation2009) affects the expression of genes as well as having a large-scale influence on the transcriptome (Henrichsen, Chaignat, et al. Citation2009). Gene dosage, gene interruption, generation of a fusion gene, position effects, unmasking of recessive coding region mutations, and other functional SNPs are predominant molecular mechanisms by which CNVs convey diverse phenotypes and complex diseases (Lupski and Stankiewicz Citation2005; Redon et al. Citation2006; Stranger et al. Citation2007; Zhang et al. Citation2009).
Stranger et al. (Citation2007) reported that 83.6% and 17.7% of variation in gene expression was elucidated by SNPs and CNVs. According to Gamazon and Stranger (Citation2015), these findings explained the underestimation of the impact of CNVs on the transcriptome because of the relatively greater completeness of SNP genotyping and the difficulty of genotyping CNVs due to their size. In addition, de novo structural changes of gene frequency could be greater in magnitude than the rate of change of specific nucleotides (Lupski Citation2007; Zhang et al. Citation2009). This implies that CNVs are significant sources of various in genomic able to explain the missing heritability when compared with SNP variants. Genomic copy number variations stretching from 1 kb to several Mb contain gains and losses compared with the designated reference genome sequence (Scherer et al. Citation2007). Furthermore, in past years, genomic detection technologies have provided advanced knowledge for construction of maps of CNVs for cattle (Liu et al. Citation2010), horses (Ghosh et al. Citation2014), goats (Fontanesi et al. Citation2010), sheep (Liu et al. Citation2013), pigs (Paudel et al. Citation2013), dogs (Alvarez and Akey Citation2012), chickens (Zhang, Du, et al. Citation2014), and yaks (Zhang et al. Citation2016), using different methods including whole-genome sequencing, array-based comparative genomic hybridisation (aCGH), single nucleotide polymorphism (SNP) array, and next-generation sequencing (NGS) and providing a very significant resource for determining how CNVs convey economically important phenotypic traits in livestock species. A considerable number of studies have detected CNVs in genomic regions using different platforms; however, few or none have related this information to association and expression analysis. In the bovine genome, CNVs cover roughly 4.6% (Hou et al. Citation2011; Bagnato et al. Citation2015; Da Silva et al. Citation2016; Keel et al. Citation2016; Prinsen et al. Citation2016). In the human genome, CNVs contribute approximately 4.8–9.5% of variations, including the creation of evident phenotypic effects from the deletion of approximately 100 genes (Zarrei et al. Citation2015). Strikingly, in cattle, milk production is associated with CNVs (Xu, Cole, et al. Citation2014; Prinsen et al. Citation2017). Further studies performed in Chinese cattle revealed that CNVs of the leptin receptor (LEPR) (Shi et al. Citation2016), myosin heavy chain 3 (MYH3) (Xu, Shi, et al. Citation2014), potassium voltage-gated channel subfamily J member (KCNJ12) (Zhou et al. Citation2016), mitogen-activated protein kinase 10 (MAPK10) (Liu et al. Citation2016), MICAL-like 2 (MICAL-L2) (Xu et al. Citation2013), and phospholipase A2 group IID (PLA2G2D) (Zhang, Jia, et al. Citation2014) genes are associated with growth traits. In addition, Zhang et al. (Citation2016) underlined that CNVs are associated with genetic diversity between individuals (Stankiewicz and Lupski Citation2010) and susceptibility to a complex human disease (Yang et al. Citation2007).
In mammals, six classes of the glypican family have been identified; however, only glypican-1 (GPC1) (Campos et al. Citation1993), which is an extracellular heparin sulphate proteoglycan (Masuda et al. Citation2010; Harthan et al. Citation2013) is found in skeletal muscle. Velleman et al. (Citation2006) reported alteration of proliferation and differentiation by the GPC1 gene through fibroblast growth factor 2 (FGF2). Similarly, Song et al. (Citation2010) suggested that GPC1 plays a central role in cell proliferation, differentiation, and responsiveness to FGF2 in turkey myogenic satellite cells. Therefore, the above studies indicated that the GPC1 gene has a critical role among proteoglycans to differentially regulate muscle cell proliferation, differentiation, and cellular responsiveness to FGF2 (Brandan et al. Citation1996; Velleman et al. Citation2004, Citation2006, Citation2007, Citation2008, Citation2012). Interestingly, the CNVs of the GPC1 gene are related to meat production and quality, economically important traits that have been extensively considered for artificial selection in yak breeding (Zhang et al. Citation2016).
No previous studies have reported on the role of CNVs of the GPC1 gene in the domestic yak. Zhang et al. (Citation2016) confirmed that the yak GPC1 gene was found within a CNV region (CNVR) that encompasses quantitative trait loci (QTLs) influence muscle development and may affect growth traits through modulation of gene expression. Thus, the current study was undertaken to investigate the distribution of GPC1 CNVs in five domestic yak breeds and their relationship with growth traits and gene expression.
Materials and methods
Study location and body measurements
Five representative Chinese domestic yak breeds were studied: Polled yak (Qinghai province, Datong Yak Farm in Qinghai, China, elevation 3200 m), Tianzhu White yak (Gansu province, Tianzhu Tibetan autonomous county, China, elevation 3000 m), Plateau Yak (Qinghai province, northern and southern Qinghai, China, elevation 3700–4700 m), Datong Yak (Qinghai province, Datong Yak Farm in Qinghai, China, elevation 3200 m), Gannan yak (Gansu province, bordering Sichuan and Qinghai, China, elevation 3300–4400 m).
The animals were in good physical condition and not genetically related individuals. All yaks were grazed on natural pasture without feeding supplementation, which provided similar feeding conditions and management. Data on the growth traits of body weight, body height, body length, chest girth, and cannon width were collected form 536 individual of Datong yaks at 6 months (n = 353) and 5 years (n = 183) of age for related studies. Body measurements were taken according to the method of Gilbert et al. (Citation1993).
Data collection and isolation of ribonucleic acid (RNA) and deoxyribonucleic acid (DNA)
Fresh blood samples were collected from a total of 656 yaks (536 Datong yak, 30 Polled yaks, 30 Tianzhu yak, 30 Gannan yaks, and 30 Plateau yak) from the jugular vein into vacuum tubes (5 mL). From these 30 Datong, 30 Polled yaks, 30 Tianzhu yak, 30 Gannan yaks, and 30 Plateau yak were used for study of distribution of population. Tissue samples from skeletal muscle, heart, liver, lung, brain, spleen, kidney, and adipose fat (no adipose for foetal samples) were collected from three 90-day-old foetal (embryo) and three 3-year-old adult Datong yaks for total RNA isolation. In addition, 41 (n = 41) skeletal muscles were collected for gene expression and CNV studies from the multiple individuals of adult Datong yaks. All blood and tissue samples were stored at −80 °C before genomic DNA and total RNA purification.
Genomic DNA (gDNA) from blood samples was purified using a Clot Blood DNA kit (CWBIO, China, Beijing), and genomic DNA longer than 10 kb was obtained using a E.Z.N.A. MicroElute DNA Clean-Up kit (Omega Bio-tek, Norwalk, GA) following the manufacturer’s instructions. Genomic DNA from skeletal muscles was extracted with a DNeasy® Blood and Tissue kit (Qiagen®) following the manufacturer’s recommended standard procedure. Total RNA from the tissues was also isolated using a TRIzol reagent (TriPure Isolation Reagent, Roche, carlsbad, CA, USA) and an RNeasy® Blood and Tissue kit (Qiagen®), according to the manufacturers’ instructions. The concentration and quality of RNA and DNA were examined using a NanoDrop™ BioPhotometer 2000 (Thermo Fisher Scientific, Inc., Waltham, MA) and through electrophoresis on ethidium bromide-stained 1% agarose gels. Complementary DNA (cDNA) was produced by reverse transcription from 1 μg RNA using a PrimeScript RT Reagent Kit with genomic DNA Eraser (TaKaRa Bio Inc., Shiga, Japan).
Primer design and PCR amplification
According to available bovine gene sequences, a pair of primers was designed for analysis of CNV and gene expression of the GPC1 gene using the National centre for Biotechnology information (NCBI) primer-BLAST webtool (https://www.ncbi.nlm.nih.gov/tools/primer-blast/index.cgi?LINK_LOC=blastHome) (Table1). A polymerase chain reaction (PCR) mixture containing 50 ng gDNA or cDNA, GoTaq® Green master mix 2X, 10 μM primer, and nuclease-free water (ddH2O) was used for checking the amplification primers in a total volume of 25 μL (Promega, Madison, WI). Thermal cycling procedures were applied as follows: an initial denaturation at 95 °C for 2 min, followed by 35 cycles of extension at 72 °C for 5 min and holding tubes at 4 °C forever. The PCR products were loaded directly into 1.0% agarose gel because GoTaq® Green Master Mix reaction buffer contains dyes with sufficient density to sink in the wells of agarose or non-denaturing TBE polyacrylamide gels. The amplification primers were also checked by melting curve analysis of qPCR.
Copy number variation and expression of the GPC1 gene
Primers designed for copy number variation and gene expression analyses are illustrated in Table . The relative expression and CNVs of the bovine GPC1 gene were considered in this study using quantitative real-time polymerase chain reaction (qPCR). Neither CNVs nor segmental duplication of bovine basic transcription factor 3 (BTF3) genes was found among variants in genomic databases (Bickhart et al. Citation2012); therefore, BTF3 was used as a diploid internal reference gene for genomic qPCR. However, for gene expression studies, the bovine glyceraldehyde-3-phosphate dehydrogenase gene (GAPDH) was chosen as a reference gene because GAPDH is commonly used by biological researchers as a control for qPCR; it is considered a housekeeping gene owing to its stable expression in most tissues and cells (Butte et al. Citation2001). The relative mRNA expression and CNV of the GPC1 were investigated using the Bio-Rad CFX 96™ Real-Time Detection System (Bio-Rad, Hercules, CA). The qPCR was performed in a 25 μL total reaction mixture containing 50 ng of gDNA or cDNA, 12.5 μL SYBR® Premix Ex Taq TM II(2X) (Tli RNase H Plus), and 10 pmol of primers (TaKaRa Bio, Inc., Shiga, Japan). The thermal cycling profile for the qPCR experiment included one cycle of 95 °C for 1 min followed by 39 cycles of denaturation at 95 °C for 10s, annealing at 60 °C for 30s, and extension at 68 °C for 10s. Melting curve analysis and no-template control reactions were used for checking primers. All experiments were replicated three times, and the mean value and standard deviation were used for statistical analysis.
Table 1. Primers designed for qPCR based on bovine genome sequences.
Statistical analysis
Threshold cycle (ΔΔCt) values were used to investigate relative copy number (Yim et al. Citation2011). Copy number of DNA was calculated using the average threshold cycle (ΔCt) value for the three replicates normalised against the reference gene, BTF3, by subtracting the BTF3 Ct value from the sample Ct value for each replicate; the final copy number value was determined using the formula 2 × 2–ΔΔCt (Bae et al. Citation2010), where a copy number of 2 (diploid) was considered the normal DNA copy number (Yim et al. Citation2011). The Ct values were converted to the nearest integer as described elsewhere (Xu et al. Citation2013; Xu, Shi, et al. Citation2014; Liu et al. Citation2016; Shi et al. Citation2016; Zhou et al. Citation2016). The quantitative mRNA expression level of the target gene was determined by using the threshold cycle 2-△△Ct method (Schmittgen and Livak Citation2008).
The association between CNV types of the GPC1 gene and growth traits in Datong yaks was determined using analysis of variance (ANOVA) with SPSS software (IBM SPSS 20, Hausmalt, CH, Switzerland). In the biostatistical model, the copy number types were grouped into loss (copy number 0 or 1), gain (copy number > 2), and normal (copy number = 2) relative to the reference gene BTF3, as illustrated elsewhere (Xu et al. Citation2013; Xu, Shi, et al. 2014; Liu et al. Citation2016; Shi et al. Citation2016; Zhou et al. Citation2016). The following analytical models were fitted for growth traits:
where Yij is the observation of the growth traits; μ is the overall mean of each growth traits, CNVi is represents the fixed effects of the ith CNV type (i = 1, 2, 3) of GPC1 gene, Aj is the fixed effect of the jth age (j = 1, 2), and εij is the random residual error. Moreover, the Bonferroni correction, which presents a modified significance criterion (p/m, where m is the overall number of independent statistical tests conducted on the given data and p is the significance level of .05), was utilised to avoid type I errors derived from multiple comparisons (Xu et al. Citation2013).
The diversity between yak breeds was determined relative to the relative to the reference gene BTF3, using log2 ratio (log22-△△Ct) values; the copy number types were described as gain (>0.5), loss (<−0.5) and normal (<|±0.5|) (Xu et al. Citation2013; Xu, Shi, et al. Citation2014; Liu et al. Citation2016; Shi et al. Citation2016; Zhou et al. Citation2016). Pairwise comparison and scatter plots of yak breeds were carried out by using GraphPad Prism version 5.00.
Pearson Product Moment Correlation in R 2.15.0 software was used to determine the relationship between the log2 ratio of the DNA copy number and the messenger RNA (mRNA) GPC1 expression levels (Knezevic et al. Citation2007). According to Stranger et al. (Citation2007), correlations generated using log2 ratio signals give strong r2 and p values; therefore, the correlation study was performed directly using data obtained from log2 ratios as mentioned previously (Liu et al. Citation2016).
Results
Distribution of GPC1 CNV in populations
As shown in Figure , the GPC1 gene in the Tianzhu, Plateau, and Gannan yak individuals exhibited more copy number loss; however, the Datong and polled yak individuals exhibited gain copy numbers. As shown in Figure , across all breeds, there was an overall frequency of GPC1 copy number (Figure ) loss (copy number 0 or 1), normal level (copy number 2), and gain (more than two copies) of 55.3%, 26.7% and 18%, respectively (Supplementary Table S2). Among them, about 80% of Tianzhu, 80% of Plateau and 97.7% of Gannan yaks exhibited copy number loss while 53% of Datong and 50% of Polled yaks contained normal copy number types of in the CNV of the GPC1 gene (Supplementary Table S2). Significant differences were found in the pairwise comparisons of Polled vs. Datong, Tianzhu, Gannan, and Plateau yak, and Datong vs. Tianzhu, Gannan, and Plateau yak (p < .05, Supplementary Table S1); low significant differences were found for Tianzhu vs. Gannan yak breeds, while there was no significant difference for Datong vs. Polled, Plateau vs. Tianzhu and Gannan, and Gannan vs. Plateau yak breeds (Supplementary Table S1).
Figure 1. Distributions of the CNV of the GPC1 gene in five yak breeds. (A) Scatter plot of CNV of the GPC1 gene in five yak breeds (n = 30). (B) The frequency of copy numbers (0 and 1 = loss, 2= normal and >2= gain copy number types) in five yak populations. CNV: copy number variation.
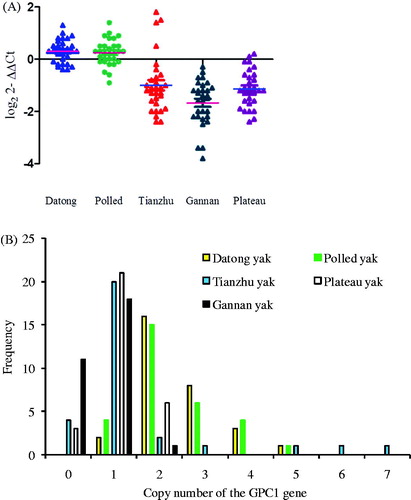
The copy number of the GPC1 gene ranged from zero to seven and one to five copies in Tianzhu, Datong and Polled yaks, respectively, indicating that the consequence of CNVs of the GPC1 gene may be high genetic variability within a population of these breeds (Figure ).
Association between GPC1 CNV and growth
A one-way ANOVA was carried out to determine the relationship between GPC1 CNV and growth traits in Datong yaks. As elucidated in Table , there was a remarkable association between growth traits and GPC1 CNV. These results showed that the loss and normal copy number types of the GPC1 gene is significantly associated (p < .05) with higher body length, weight and height and chest girth than the gain copy number type in six-month-old yaks. On the other hand, the loss copy number types of the GPC1 gene is highly associated (p < .05) with body weight, length and height and chest girth than gain copy number type in five-year-old yaks. Therefore, these results suggest that GPC1 CNV could be substantially related to growth traits of Datong yaks.
Table 2. Analysis of the association between CNVs in the GPC1 gene and growth traits in Datong yak breeds.
Expression pattern analysis of the GPC1 gene in different tissues
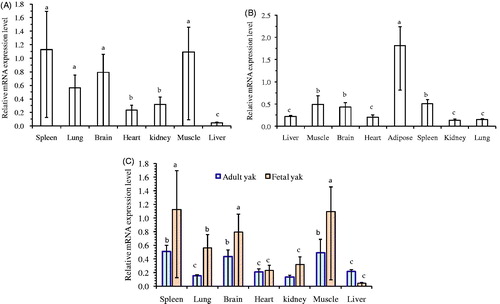
During foetal periods, GPC1 had noticeably high expression in muscle and spleen, while moderate expression was observed in brain and lung, and weak expression in liver, kidney and heart tissues (Figure ). However, significantly (p < .05) high mRNA expression levels of GPC1 were found in adipose tissues of adult yaks (Figure ). Also, moderate mRNA expression levels were identified in the spleen, muscle and brain, while low mRNA expression levels were observed in kidney, lung, heart and liver tissues (Figure ). Moreover, a significant increase in GPC1 mRNA levels was determined in the muscle, spleen, and brain between foetal and adult yak samples (p < .05) (Figure ).
Figure 2. Expression profiling of the GPC1 gene at two ages of Datong yak. (A) Expression pattern of the GPC1 gene in foetal yak. (B) Expression Pattern of the GPC1 gene in the adult yak. (C) Comparison of expression of GPC1 gen in two ages. The error bar indicated the standard deviation (SD). Different letters indicate significant difference (p < .05). CNV: copy number variation.
Correlation analysis of CNV and mRNA expression of the GPC1 gene
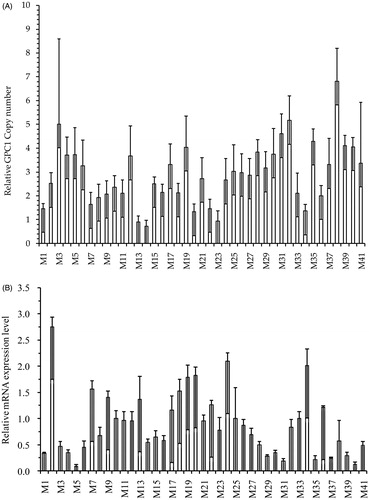
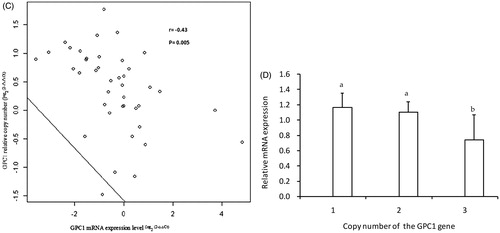
The genomic functions of the GPC1 CNVs and mRNA expression levels were examined in adult skeletal muscle based on the scale of expression. Among 41 skeletal muscles, we identified nine normal copy number types, 25 gain types, and seven loss types. The relative copy numbers and mRNA expression levels varied from one to seven copies (Figure ) and 0.12- to 2.75-fold (Figure ), respectively. In the meantime, a moderately negative and highly significant (p = .005) correlation (r = −0.43) was detected between CNV and mRNA expression levels (Figure ). On the other hand, in Figure , when comparing copy number types and gene expression, normal and loss copy number was significantly (p < .05) associated with higher mRNA expression levels than that of gain types, while no difference was observed between loss and normal copy number types.
Figure 3. Correlation analysis between the log2 ratio of gene expression and CNVs of GPC1 in skeletal muscle of adult Datong yak. (A) Copy number variation of GPC1 gene (n = 41, M1-M41). (B) GPC1 gene expression level (n = 41, M1–M41). (C) Correlation between DNA copy number and mRNA GPC1 gene expression level. (4-6D) The impacts of DNA CNVs on GPC1 mRNA gene expression level (≥1, n = 7; 2, n = 9; 3, n = 25) were evaluated between different CNV types. The error bar showed the standard deviation (SD). Different letters indicate significant difference (p < .05). CNV: copy number variation.
Discussion
In yak, CNV surveying has been restricted to the discovery of CNV regions (CNVRs) using aCGH (Zhang, Jia, et al. Citation2014), BovineHD Genotyping Bead Chip Array (Quanwei et al. Citation2014), and NGS (Zhang et al. Citation2016). However, no efforts have been made to study the association of CNV with gene expression in different breeds of Datong yak. Indeed, Xu et al. (Citation2016) indicated that the biological impact of CNVs was a dynamic research area, due to their diversity, origin, and genetic properties.
The qPCR detection method was highly powerful for CNV investigation (Liu et al. Citation2010; Cole et al. Citation2011; Bickhart et al. Citation2016; Zhang et al. Citation2016). The log2 ratio indicated that greater copy number loss was observed in the GPC1 CNVs in the Tianzhu, Gannan and plateau yak populations, whereas copy number gain was observed in the Datong and polled yaks. Population differentiation in this study was discovered using the log2 ratio to differentiate the diversity between yak breeds, and this method is more sensitive to detection of homozygous deletions than duplications (Olson Citation1996; Liu et al. Citation2016). On the other hand, gene loss was a major pattern of molecular evolution (Ko et al. Citation2012). Correspondingly, Zarrei et al. (Citation2015) found that CNVs caused by deletions and duplications in the genome were the predominant causes of the variability among populations, with duplications and deletions occurring as results of positive and negative selective pressure in the individual populations, respectively. These results further explain the frequencies of different copy-number types in five breeds with variations that could originate from the diversity of breeds kept in different environments (Lehnert et al. Citation2007; Yang et al. Citation2017) and selection (Xu et al. Citation2016; Yang et al. Citation2017). The present results show that the copy number gain events might be due to extra genetic material (artificial insemination, hybridisation and introgression) obtained during breed formation in Datong and Polled yak, since Datong yaks are produced by mating Huanhu yak cows with wild yaks (male) for meat production and Polled yak are produced from breeding Polled yak cows with horned yak bulls (Wiener et al. Citation2003; Liu et al. Citation2014); the other three yak breeds belong to the indigenous domestic yaks of China. These studies revealed that the CNVs of the GPC1 gene may affect the phenotypes of different breeds, hinting at discrepancy in genomic CNVs. This study was based on real-time polymerase chain reaction (qPCR) using five different domestic yaks; therefore, it is hard to judge the CNVs of genes in other studies due to the different populations, sizes, platforms, and algorithms applied for surveying.
Our results showed that the normal and loss of CNV types of the GPC1 gene are significantly (p < .05) associated with growth traits. This study may be revealed that GPC1 gene resides in the CNVR that influence on the quantitative traits of growth of yaks (Zhang et al. Citation2016). These results were confirmed by different scholars, and association between CNVs of the LEPR (Shi et al. Citation2016), MYH3 (Xu, Shi, et al. Citation2014), KCNJ12 (Zhou et al. Citation2016), MAPK10 (Liu et al. Citation2016), CYP4A11 (Yang et al. Citation2017), and MICAL-L2 (Xu et al. Citation2013) genes and growth traits of Chinese cattle have been reported. Previous work have also revealed that most CNV genes are located within CNVRs that overlap with QTLs (Liu et al. Citation2010). Moreover, work revealed by Stothard et al. (Citation2011) found that CNVs of the PLA2G2D gene was associated with milk production, health, and meat quality in beef and dairy cattle. Consistently, Cole et al. (Citation2011) revealed that genes and chromosome regions of CNVs were associated with body shape traits. Comparable to these results, the CNV of PLA2G2D gene was associated with growth traits (Zhang, Jia, et al. Citation2014). Furthermore, Da Silva et al. (Citation2016) reported that CNVs of the PLAG1 zinc finger (PLAG1) affect height. Therefore, this study was very interesting, because it clearly shows the association between CNVs and growth traits in the Datong yak breed; however, a larger yak population may be required for further elaboration.
The current study revealed that the CNVs of the GPC1 gene affect growth traits via altering mRNA transcription levels. Besides, GPC1 mRNA transcription levels were significantly (p < .05) high in muscle, spleen and brain among foetal and adult yaks (Figure ). However, the comparison showed that GPC1 mRNA transcription levels were significantly (p < .05) increased in muscle, spleen, brain and lung of foetal yak. Low mRNA expression levels were recorded in liver and heart tissues; this may indicate that GPC1 expression is highly regulated in liver and heart. In accordance with this result, a previous study indicated that the expression of GPC1 decreased with age, being increased in seven-week-old cells and decreased in 16-week-old cells compared with 1-day-old cells at 24 and 48 hours of differentiation in turkey (Harthan et al. Citation2013). Interestingly, the expression of GPC1 was age-dependant during proliferation and differentiation (Harthan et al. Citation2013), the origin of muscles (Zammit et al. Citation2002), genetics (Liu et al. Citation2006) and tissues (Guryev et al. Citation2008). The high expression of the GPC1 mRNA in the muscles might explain the important of the GPC1 gene for muscle proliferation and differentiation in embryonic stages of yak (Velleman et al. Citation2013). on the other hand, the high expression of the GPC1 mRNA in the in the brain is essential for development of brain physiology, because loss of the GPC1 gene predominantly affects brain size and patterns at birth (Jen et al. Citation2009). In accordance with previous observations of Shiau et al. (Citation2010) GPC1 mRNA transcription levels were significantly high in foetal Datong yaks, may be indicating the possible roles of GPC1 in the embryonic developments (Shiau et al. Citation2010). Comparable to these observations, high levels of GPC1 expression were found throughout the brain, kidney and skeletal system in mice (Litwack et al. Citation1998) and also a high expression of GPC1 in the skeletal muscle (Velleman and Song Citation2017).
Biologically, GPC1 mRNA expression levels in adult skeletal muscle were unquestionably influenced by CNVs. Meanwhile, a moderate negative correlation (r = -0.42) was reported between DNA copy number and mRNA expressions of the GPC1 gene, and this association was highly significant (p = .005). Consistent with these results, a negative correlation were reported between the levels of DNA copy number and MICAL-L2 gene in cattle (Xu et al. Citation2013), DNA copy number and the LEPR gene in cattle (Shi et al. Citation2016) and DNA copy numbers and the RHACD8 gene in chickens (Wright et al. Citation2009). However, a positive correlation was observed between the levels of DNA copy number and the MYH3 (Xu, Shi, et al. Citation2014) and MAPK10 (Liu et al. Citation2016) genes in cattle. Furthermore, Xu et al. (Citation2017) reported a positive association between the DNA copy number and the LEPR gene in the skeletal muscle and adipose tissues of Chinese cattle (Henrichsen, Vinckenbosch, et al. Citation2009). These results suggest that the mRNA expression and DNA copy numbers of GPC1 are negatively correlated due to gene dosage effects. Consistent with this study, Conrad et al. (Citation2010) and Feuk et al. (Citation2006) reported that CNV affects phenotypic variation directly through mechanisms of gene dosage and/or altering gene expression in the genomic regions. According to a study by Gamazon and Stranger (Citation2015), expression of dosage-sensitive genes could be modulated by gene duplication and deletion. In line with this result, Merla et al. (Citation2006) reported that gene transcription in tissues influenced by alteration of gene dosage and effects of neighbouring genomic regions (Stranger et al. Citation2007; Orozco and Cokus Citation2009). Correspondingly, Liu et al. (Citation2016) suggested that CNVs of MAPK10 affect gene expression through gene dosage and gene-gene and gene-environment interactions. In contrast, McCarroll and Altshuler (Citation2007) observed that mRNA expression levels affected by additional regulators or transcription factors that regulate gene expression in trans, and DNA methylation. Consistent with this finding, CNV is positively and/or negatively correlated with the mRNA expression landscape (McCarroll and Altshuler Citation2007; Guryev et al. Citation2008). Therefore, this observation revealed that GPC1 CNV may be a crucial factor accountable for the growth of yak breeds. The results of the present study showed that CNVs of GPC1 gene is associated with growth traits in the Datong yak breed.
Conclusions
The results elucidated that DNA copy number and mRNA expression were remarkably negatively correlated, showing the potential impact of GPC1 CNVs on growth traits in Datong yak breed. During the foetal stage, GPC1 genes were largely expressed in spleen, muscles, and brain tissues, underscoring their fundamental role in skeletal muscle development, muscle cell proliferation, differentiation and cellular responsiveness. This study reports on the crucial function of GPC1 CNVs in Chinese Datong yak breed, and it is hypothesis that a selection of the young animals on the base of their CNVs of the GPC1 gene important resources for future development of breeding programmes in yak.
Ethics of experimentation
The study was conducted between September 2016 and December 2017 at the Key Laboratory of Yak Breeding Engineering of Gansu Province, Lanzhou Institute of Husbandry and Pharmaceutical Sciences, and the data were obtained from yak breeding cooperatives of Gansu and Qinghai Province, China. All blood sample collection and body measurements were performed in strict accordance with the guide for the Care and Use of Laboratory Animals, Lanzhou Institute of Husbandry Animal and Pharmaceutical Sciences, China. Additionally, all the animals were slaughtered under anaesthesia, and all necessary efforts were made to minimise the risk of suffering. Thus, we were granted permission to perform this research study on yak, and the legal certificate number was SCXK (Gan) 2014-0002.
Acknowledgments
We thank Mr. Yong Feng Zhang for the guidance and technical assistance provided during the laboratory work and Dr. Hong Bo Wang, Ms. Li Xiaoxiao and Mr. Peng Tang for performing the blood sample collection.
Disclosure statement
The authors declare no conflict of interest. The founding sponsors had no role in the design of the study; in the collection, analyses, or interpretation of data; in the writing of the manuscript, and in the decision to publish the results.
Additional information
Funding
References
- Alvarez CE, Akey JM. 2012. Copy number variation in the domestic dog. Mamm Genome. 23:144–163.
- Bae JS, Cheong HS, Kim LH, NamGung S, Park TJ, Chun JY, Kim JY, Pasaje CF, Lee JS, Shin HD. 2010. Identification of copy number variations and common deletion polymorphisms in cattle. BMC Genomics. 11:232.
- Bagnato A, Strillacci MG, Pellegrino L, Schiavini F, Frigo E, Rossoni A, Fontanesi L, Maltecca C, Prinsen RTMM, Doleza MA. 2015. Identification and validation of copy number variants in Italian Brown Swiss dairy cattle using Illumina bovine SNP50 Beadchip. Italian J Anim Sci. 14:3900.
- Bickhart DM, Hou Y, Schroeder SG, Alkan C, Cardone MF, Matukumalli LK, Song J, Schnabel RD, Ventura M, Taylor JF. 2012. Copy number variation of individual cattle genomes using next-generation sequencing. Genome Res. 22:778–790.
- Bickhart DM, Xu L, Hutchison JL, Cole JB, Null DJ, Schroeder SG, et al. 2016. Diversity and population-genetic properties of copy number variations and multicopy genes in cattle. DNA Res. 23(3):253–262.
- Brandan E, Carey DJ, Larraín J, Melo F, Campos A. 1996. Synthesis and processing of glypican during differentiation of skeletal muscle cells. Eur J Cell Biol. 71:170–176.
- Butte AJ, Dzau VJ, Glueck SB. 2001. Further defining housekeeping, or "maintenance," genes Focus on "A compendium of gene expression in normal human tissues". Physiol. Genomics. 7:95–96.
- Campos A, Núñez R, Koenig CS, Carey DJ, Brandan E. 1993. A lipid-anchored heparan sulfate proteoglycan is present in the surface of differentiated skeletal muscle cells. Isolation and biochemical characterization. Eur J Biochem. 216:587–595.
- Cole J, Wiggans G, Ma L, Sonstegard T, Lawlor T, Crooker B, Van Tassell C, Yang J, Wang S, Matukumalli LK, et al. 2011. Genome-wide association analysis of thirty-one production, health, reproduction and body conformation traits in contemporary US Holstein cows. BMC Genomics. 12:408.
- Conrad DF, Pinto D, Redon R, Feuk L, Gokcumen O, Zhang Y, Aerts J, Andrews TD, Barnes C, Campbell P, et al. 2010. Origins and functional impact of copy number variation in the human genome. Nature. 464:704–712.
- Curi R, Oliveira H, Silveira A, Lopes C. 2005. Effects of polymorphic microsatellites in the regulatory region of IGF1 and GHR on growth and carcass traits in beef cattle. Anim Genet. 36:58–62.
- Da Silva JM, Poliana FG, da Silva LO, Carrijo Cintra L, Rezende PS, Michel EBY, Rodrigues Caetano A. 2016. Genome-wide copy number variation (CNV) detection in Nelore cattle reveals highly frequent variants in genome regions harboring QTLs affecting production traits. BMC Genomics. 17:454.
- Feuk L, Marshall CR, Wintle RF, Scherer SW. 2006. Structural variants: changing the landscape of chromosomes and design of disease studies. Hum Mol Genet. 15:R57–R66.
- Fontanesi L, Martelli PL, Beretti F, Riggio V, Dall'Olio S, Colombo M, Casadio R, Russo V, Portolano B. 2010. An initial comparative map of copy number variations in the goat (Capra hircus) genome. BMC Genomics. 11:639.
- Gamazon ER, Stranger BE. 2015. The impact of human copy number variation on gene expression. Brief Funct Genomics. 14:352–357.
- Ghosh S, Qu Z, Das PJ, Fang E, Juras R, Cothran EG, McDonell S, Kenney DG, Lear TL, Adelson DL, et al. 2014. Copy number variation in the horse genome. Plos Genet. 10:e1004712.
- Gilbert RP, Bailey DRC, Shannon NH. 1993. Linear body measurements of cattle before and after 20 years of selection for postweaning gain when fed two different diets. J Anim Sci. 71:1712–1720.
- Guryev V, Saar K, Adamovic T, Verheul M, van Heesch SA, Cook S, Pravenec M, Aitman T, Jacob H, Shull JD, et al. 2008. Distribution and functional impact of DNA copy number variation in the rat. Nat Genet. 40:538–545.
- Harthan LB, McFarland DC, Velleman SG. 2013. Changes in proliferation, differentiation, fibroblast growth factor 2 responsiveness and expression of syndecan-4 and glypican-1 with turkey satellite cell age. Develop Growth Differ. 55:622–634.
- Hayes BJ, Bowman PJ, Chamberlain AJ, Goddard ME. 2009. Invited review: Genomic selection in dairy cattle: progress and challenges. J. Dairy Sci. 92:433–443.
- Henrichsen CN, Chaignat E, Reymond A. 2009. Copy number variants, diseases and gene expression. Hum Mol Genet. 18:R1–R8.
- Henrichsen CN, Vinckenbosch N, Zöllner S, Chaignat E, Pradervand S, Schütz F, Ruedi M, Kaessmann H, Reymond A. 2009. Segmental copy number variation shapes tissue transcriptomes. Nat Genet. 41:424–429.
- Hou Y, Liu GE, Bickhart DM, Cardone MF, Wang K, Kim ES, Matukumalli LK, Ventura M, Song J, VanRaden PM, et al. 2011. Genomic characteristics of cattle copy number variations. BMC Genomics. 12:127.
- Hu Q, Ma T, Wang K, Xu T, Liu J, Qiu Q. 2012. The Yak genome database: an integrative database for studying yak biology and high-altitude adaption. BMC Genomics. 13:600.
- Jen YHL, Musacchio M, Lander D. 2009. Glypican-1 controls brain size through regulation of fibroblast growth factor signaling in early neurogenesis. Neural Deve. 4:33.
- Keel BN, Lindholm-Perry AK, Snelling WM. 2016. Evolutionary and functional features of copy number variation in the cattle genome. Front Genet. 7:207.
- Knezevic SZ, Streibig JC, Ritz C. 2007. Utilizing R software package for dose-response studies: the concept and data analysis. Weed Technol. 21:840–848.
- Ko DC, Gamazon ER, Shukla KP, Pfuetzner RA, Whittington D, Holden TD, Brittnacher MJ, Fong C, Radey M, Ogohara C, et al. 2012. Functional genetic screen of human diversity reveals that a methionine salvage enzyme regulates inflammatory cell death. Proc Nat Acad Sci U S A. 109:E2343–E2352.
- Lan D, Xiong X, Mipam TD, Fu C, Li Q, Ai Y, Hou D, Chai Z, Zhong J, Li J. 2018. Genetic diversity, molecular phylogeny, and selection evidence of jinchuan yak revealed by whole-genome resequencing. G3 (Bethesda). 8:945–952.
- Lehnert SA, Reverter A, Byrne KA, Wang Y, Nattrass GS, Hudson NJ, Greenwood PL. 2007. Gene expression studies of developing bovine longissimus muscle from two different beef cattle breeds. BMC Deve Biol. 7:95.
- Liang C, Wang L, Wu X, Wang K, Ding X, Wang M, Chu M, Xie X, Qiu Q, Yan P. 2016. Genome-wide association study identifies loci for the polled phenotype in yak. PLoS One. 11:e0158642.
- Litwack ED, Ivins JK, Kumbasar A, Paine-Saunders S, Stipp CS, Lander AD. 1998. Expression of the heparan sulfate proteoglycan glypican-1 in the developing rodent. Dev Dyn. 211:72–87.
- Liu C, McFarland DC, Nestor KE, Velleman SG. 2006. Differential expression of membrane-associated heparan sulfate proteoglycans in the skeletal muscle of turkeys with different growth rates. Poult. Sci. 85:422–428.
- Liu GE, Hou Y, Zhu B, Cardone MF, Jiang L, Cellamare A, Mitra A, Alexander LJ, Coutinho LL, Dell'Aquila ME, et al. 2010. Analysis of copy number variations among diverse cattle breeds. Genome Res. 20:693–670.
- Liu J, Zhang L, Xu L, Ren H, Lu J, Zhang X, Zhang S, Zhou X, Wei C, Zhao F, et al. 2013. Analysis of copy number variations in the sheep genome using 50K SNP BeadChip array. BMC Genomics. 14:229.
- Liu M, Li B, Huang Y, Yang M, Lan X, Lei C, Qu W, Bai Y, Chen H. 2016. Copy number variation of bovine MAPK10 modulates the transcriptional activity and affects growth traits. Liv. Sci. 194:44–50.
- Liu WB, Liu J, Liang CN, Guo X, Bao PJ, Chu M, Ding XZ, Wang HB, Zhu XS, Yan P. 2014. Associations of single nucleotide polymorphisms in candidate genes with the polled trait in Datong domestic yaks. Anim Genet. 45:138–141.
- Lupski JR. 2007. An evolution revolution provides further revelation. Bioessays. 29:1182–1184.
- Lupski JR, Stankiewicz P. 2005. Genomic disorders: Molecular mechanisms for rearrangements and conveyed phenotypes. PLoS Genet. 6:e49.
- Masuda YM, Wang X, Yokose S, Yamada Y, Kimura Y, Okano T, Matsumoto K. 2010. Effect of glypican-1 gene on the pulp cells during the reparative dentine process. Cell Biol Int. 34:1069–1074.
- McCarroll SA, Altshuler DM. 2007. Copy-number variation and association studies of human disease. Nat Genet. 39:S37–S42.
- Medugorac I, Graf A, Grohs C, Rothammer S, Zagdsuren Y, Gladyr E, Zinovieva N, Barbieri J, Seichter D, Russ I, Eggen A, et al. 2017. Whole-genome analysis of introgressive hybridization and characterization of the bovine legacy of Mongolian yaks. Nat Genet. 49:470–475.
- Merla G, Howald C, Henrichsen CN, Lyle R, Wyss C, Zabot MT, Antonarakis SE, Reymond A. 2006. Submicroscopic deletion in patients with Williams-Beuren syndrome influences expression levels of the nonhemizygous flanking genes. Am J Hum Genet. 79:332–341.
- Olson MV. 1996. When less is more: gene loss as an engine of evolutionary change. Am. J. Hum. Genet. 64:18–23.
- Olson MV. 1999. When less is more: gene loss as an engine of evolutionary change. Am J Hum Genet. 64:18–23.
- Orozco LD, Cokus SJ, Ghazalpour A, Ingram-Drake L, Wang S, Nas A, Che N, Araujo JA, Pellegrini M, Lusis AJ. 2009. Copy number variation influences gene expression and metabolic traits in mice. Hum Mol Genet. 18:4118–4129.
- Paudel Y, Madsen O, Megens HJ, Laurent AF, Mirte F, John B, Bastiaansen WM, Richard PM, Crooijmans A, Groenen MAM. 2013. Evolutionary dynamics of copy number variation in pig genomes in the context of adaptation and domestication. BMC Genomics. 14:1–13.
- Prinsen RTMM, Strillacci MG, Schiavini F, Santus E, Rossoni A, Maurer V, Bieber A, Gredler B, Dolezal M, Bagnato A. 2016. A genome-wide scan of copy number variants using high-density SNPs in Brown Swiss dairy cattle. Liv Sci. 191:153–160.
- Prinsen RTMM, Rossoni A, Gredler B, Bieber A, Bagnato A, Strillacci MG. 2017. A genome-wide association study between CNVs and quantitative traits in Brown Swiss cattle. Liv Sci. 202:7–12.
- Quanwei Z, Youji M, Yong Z, Xingxu Z. 2014. Cross-species Analysis of Copy Number Variations in domestic yak genome based study on Heterologous Hybridization using Bovine HD Genotyping bead Chip Array. Proceeding of the Fifth international conference on Yak, Lanzhou, China, pp.131–138.
- Redon R, Ishikawa S, Fitch KR, Feuk L, Perry GH, Andrews TD, Fiegler H, Shapero MH, Carson AR, Chen W, et al. 2006. Global variation in copy number in the human genome. Nature. 444:444–454.
- Scherer SW, Lee C, Birney E, Altshuler DM, Eichler EE, Carter NP, Hurles ME, Feuk L. 2007. Challenges and standards in integrating surveys of structural variation. Nat Genet. 39:S7–S15.
- Schmittgen TD, Livak KJ. 2008. Analyzing real-time PCR data by the comparative C(T) method. Nat Protoc. 3:1101–1107.
- Shi T, Yao X, Mingjuan Y, Yongzhen H, Xianyong L, Chuzhao L, Xinglei Q, Xiaoming Y, Hong C. 2016. Copy number variations at LEPR gene locus associated with gene expression and phenotypic traits in Chinese cattle. Anim Sci J. 87:336–343.
- Shiau CE, Hu N, Bronner-Fraser M. 2010. Altering Glypican-1 levels modulates canonical Wnt signaling during trigeminal placode development. Devel Biol. 348:107–118.
- Song Y, Nestor KE, McFarland DC, Velleman SG. 2010. Effect of glypican-1 covalently attached chains on turkey myogenic satellite cell proliferation, differentiation, and fibroblast growth factor 2 responsiveness. Poult Sci. 89:123–134.
- Stankiewicz P, Lupski JR. 2010. Structural variation in the human genome and its role in disease. Annu Rev Med. 61:437–455.
- Stothard P, Choi JW, Basu U, Sumner-Thomson JM, Meng Y, Liao X, Moore SS. 2011. Whole genome resequencing of black Angus and Holstein cattle for SNP and CNV discovery. BMC Genomics. 12:559.
- Stranger BE, Forrest MS, Dunning M, Ingle CE, Beazley C, Thorne N, Redon R, Bird CP, de Grassi A, Lee C, et al. 2007. Relative impact of nucleotide and copy number variation on gene expression phenotypes. Science. 315:848–853.
- Utsunomiya YT, do Carmo AS, Carvalheiro R, Neves HH, Matos MC, Zavarez LB, Pérez O'Brien AM, Sölkner J, McEwan JC, Cole JB, et al. 2013. Genome-wide association study for birth weight in Nellore cattle points to previously described orthologous genes affecting human and bovine height. BMC Genetics. 14:52.
- VanRaden PM, Van Tassell CP, Wiggans GR, Sonstegard TS, Schnabel RD, Taylor JF, Schenkel FS. 2009. Invited review: reliability of genomic predictions for North American Holstein bulls. J Dairy Sci. 92:16–24.
- Velleman SG. 2012. Meat Science and Muscle Biology Symposium: extracellular matrix regulation of skeletal muscle formation. J Anim Sci. 90:936–941.
- Velleman SG, Coy CS, McFarland DC. 2007. Effect of syndecan-1, syndecan-4, and glypican-1 on turkey muscle satellite cell proliferation, differentiation, and responsiveness to fibroblast growth factor 2. Poult Sci. 86:1406–1413.
- Velleman SG, Li X, Coy CS, McFarland DC. 2008. The effect of fibroblast growth factor 2 on the in vitro expression of syndecan-4 and glypican-1 in Turkey satellite cells. Poult Sci. 87:1834–1840.
- Velleman SG, Liu C, Coy CS, McFarland DC. 2006. Effects of glypican-1 on turkey skeletal muscle cell proliferation, differentiation and fibroblast growth factor 2 responsiveness. Develop GrowthDiffer. 48:271–276.
- Velleman SG, Liu X, Coy CS, McFarland DC. 2004. Effects of syndecan-1 and glypican on muscle cell proliferation and differentiation: Implications for possible functions during myogenesis. Poult. Sci. 83:1020–1027.
- Velleman SG, Song Y. 2017. Development and growth of the avian pectoralis major (breast) muscle: function of syndecan-4 and glypican-1 in adult myoblast proliferation and differentiation. Front Physiol. 8:577.
- Velleman SG, Song Y, Shin J, McFarland DC. 2013. Modulation of turkey myogenic satellite cell differentiation through the shedding of glypican-1. Comp Biochem Physiol Part A Mol Integr Physiol. 164:36–43.
- Wiener G, Jianlin H, Ruijun L. 2003. The Yak. 2nd ed. Bangkok (Thailand): FAO Regional Office for Asia and the Pacific Food and Agriculture Organization of the United Nations; pp.88–102.
- Wiggans GR, Sonstegard TS, VanRaden PM, Matukumalli LK, Schnabel RD, Taylor JF, Schenkel FS, Van Tassell CP. 2009. Selection of single-nucleotide polymorphisms and quality of genotypes used in genomic evaluation of dairy cattle in the United States and Canada. J Dairy Sci. 92:3431–3436.
- Wright D, Boije H, Meadows JRS, Bed'hom B, Gourichon D, Vieaud A, Tixier-Boichard M, Rubin CJ, Imsland F, Hallböök F, et al. 2009. Copy number variation in intron 1 of SOX5 causes the pea-comb phenotype in chickens. PLoS Genet. 5:e1000512.
- Wu XiaoY, Ding X, Chu M, Guo X, Bao PJ, Liang CN, Yan P. 2015. Novel SNP of EPAS1 gene associated with higher hemoglobin concentration revealed the hypoxia adaptation of yak (Bos grunniens). J Integert Agricul. 14:741–748.
- Xu L, Cole JB, Bickhart DM, Hou Y, Song J, VanRaden PM, Sonstegard TS, Van Tassell CP, Liu GE. 2014. Genome wide CNV analysis reveals additional variants associated with milk production traits in Holsteins. BMC Genomics. 15:683.
- Xu L, Hou Y, Bickhart DM, Zhou Y, Hay EHA, Song J, Sonstegard TS, Van Tassell CP, Liu GE. 2016. Population-genetic properties of differentiated copy number variations in cattle. Sci Rep. 6:23161
- Xu Y, Jiang Y, Shi T, Cai H, Lan X, Zhao X, Plath M, Chen H. 2017. Whole-genome sequencing reveals mutational landscape underlying phenotypic differences between two widespread Chinese cattle breeds. PLoS ONE. 12(8):e0183921.
- Xu Y, Shi T, Cai H, Zhou Y, Lan X, Zhang C, Lei C, Qi X, Chen H. 2014. Associations of MYH3 gene copy number variations with transcriptional expression and growth traits in Chinese cattle. Genetics. 535:106–111.
- Xu Y, Zhang LZ, Shi T, Zhou Y, Cai HF, Lan X, Zhang C, Lei C, Chen H. 2013. Copy number variations of MICAL-L2 shaping gene expression contribute to different phenotypes of cattle. Mamm Genome. 24:508–516.
- Yang M, Jingqiao LV, Liangzhi Z, Mingxun L, Yang Z, Xianyong L, Chuzhao L, Chen H. 2017. Association study and expression analysis of CYP4A11 gene copy number variation in Chinese cattle. Sci Rep. 7:46599.
- Yang Y, Chung EK, Wu YL, Savelli SL, Nagaraja HN, Zhou B, Hebert M, Jones KN, Shu Y, Kitzmiller K, et al. 2007. Gene copy-number variation and associated polymorphisms of complement component C4 in human systemic lupus erythematosus (SLE): low copy number is a risk factor for and high copy number is a protective factor against SLE susceptibility in European Americans. Am J Hum Genet. 80:1037–1054.
- Yim SH, Chung YJ, Jin EH, Shim SC, Kim JY, Kim YS, Hu HJ, Shin SH, Pae HO, Zouali M, et al. 2011. The potential role of VPREB1 gene copy number variation in susceptibility to rheumatoid arthritis. Mol. Immunol. 48:1338–1343.
- Zammit PS, Heslop L, Hudon V, Rosenblatt JD, Tajbakhsh S, Buckingham ME, Beauchamp JR, Partridge TA. 2002. Kinetics of myoblast proliferation show that resident satellite cells are competent to fully regenerate skeletal muscle fibers. Exp Cell Res. 281:39–49.
- Zarrei M, MacDonald JR, Merico D, Scherer SW. 2015. A copy number variation map of the human genome. Nat Rev Genet. 16:172–183.
- Zhang H, Du ZQ, Dong JQ, Wang HX, Shi HY, Wang N, Wang SZ, Li H. 2014. Detection of genome-wide copy number variations in two chicken lines divergently selected for abdominal fat content. BMC Genomics. 15:517.
- Zhang F, Gu W, Hurles ME, Lupski JR. 2009. Copy number variation in human health, disease, and evolution. Annu Rev Genomics Hum Genet. 10:451–481.
- Zhang L, Jia S, Yang M, Xu Y, Li C, Sun J, Huang Y, Lan X, Lei C, Zhou Y, et al. 2014. Detection of copy number variations and their effects in Chinese bulls. BMC Genomics. 15:480.
- Zhang X, Wang K, Wang L, Yang Y, Zhengqiang N, Xiuyue X, Xuemin S, Jin H, Dongshi W, Qiang Q. 2016. Genome-wide patterns of copy number variation in the Chinese yak genome. BMC Genomics. 17:379.
- Zhou Y, Utsunomiya T, Xu L, El Hamidi Abdel H, Derek MB, Pamela AA, Benjamin DR, Steven GS, Roberto C, Haroldo HRN, et al. 2016. Genome-wide CNV analysis reveals variants associated with growth traits in Bos indicus. BMC Genomics. 17:1–9.