
 ?Mathematical formulae have been encoded as MathML and are displayed in this HTML version using MathJax in order to improve their display. Uncheck the box to turn MathJax off. This feature requires Javascript. Click on a formula to zoom.
Abstract
The objective of this study was to characterise the peak yield (PY), peak day (PD) and the persistency (P) of the lactation curve of Murciano-Granadina goats by Spline considering the variation factors (region, type of kidding, lactation number and season) and their levels. A total of 1,349,347 test-day records from 180,872 lactations, of 85,404 goats were used. The analysed data with Spline model was considered for adequate fit in lactation curves for others traits in these goats. All factors affected the scale and/or shape of the lactation curve. In the region factor, significant differences (SD, p < .05) were observed in terms of the total milk yield (TY), final persistency (FP) and total persistency (TP) variables in favour of Almeria versus Cordoba and Granada; the PD variables, PY and initial persistency (IP) did not show SD (NSD, p > .05) between regions. The type of kidding presented SD among its levels (evident between double versus single and triple) with the exception of the PY. The lactation number for the variables of PD, PY and TY from second to fifth lactation showed NSD among themselves; but it did in the case of the first. The P of first lactation was longer, with a decrease in subsequent lactations. In the season factor, PD, TY and P presented SD; where the PD was divided into two groups: late group (winter-spring) and early group (fall-winter). The P, PY and PD can be considered as an additional selection criterion and thus modify the lactation curve.
The biomodeling of individualized lactation curves is an important information resource for farmers and their breeding program.
A conglomerate of microeffects such us climate, photoperiod, agroecological aspects, affect parameters of the lactation curve and their productions.
It is preferable to achieve lactations with more emphasis on persistency in order to provide animal welfare and obtain adequate economic benefits.
Highlights
Introduction
The Murciano-Granadina (MG) is the most important dairy goat breed of Spain, both in census and in production (Delgado et al. Citation2017). In addition to being very widespread throughout the Spanish territory, currently, herds of the MG are found in several countries in Europe, Africa and the Americas, representing an international repercussion. The breed is generally kept in semi-extensive systems under different climatic conditions (from sea level to 3000 m of altitude), grazing on natural pastures and shrubs throughout the year, with supplementation in critical periods, based on either by-products or commercial feed supplements (León et al. Citation2012).
The MG is a permanent polyestric breed with high prolificacy (two or more kids/parturition in multiparous females) having an average of 6 lactations, with mean productions of up to 584 L of milk per lactation, dairy yields of between 3 and 4 L in 24 h, also highlighting its high fat content (5.3%) and protein (3.6%) (Delgado et al. Citation2017), and its production is destined almost entirely to the cheese industry.
In goat production systems, the use of mathematical non-lineal functions is common in milk (Marín et al. Citation2009) as in meat production (Guevara et al. Citation2018). In dairy goat breeds, the lactation curve (LC) is an important source of information for both farmers and their breeding programme. Determining the best fit curve is an essential tool to detect potentially more productive goats in a herd (Shaat Citation2014) and to make a pre-selection of young animals destined for progeny testing (Fernández et al. Citation2002).
On the other hand, it would allow evaluating the evolution of dairy production and subsequent decision-making for management, such as the possible discarding of animals based on their efficient productive capacity (Adewumi et al. Citation2017).
The prediction of the milk yield in lactating animals allows an early evaluation of the candidates to be selected, and the evaluation of the total milk yield (TY) and the knowledge of the LC traits, including peak production and persistency (P) of lactation, are essential to evaluate the correct functioning of the improvement programme (León et al. Citation2012).
These LC are obtained from parameters that characterise it, first a phase of ascent (level of initial production until reaching the maximum production), followed by a period of maximum production or peak and finally, the phase of continuous descent called P (level at which the production or length of lactation is maintained) (Rekik et al. Citation2003; Macciotta et al. Citation2011) phases that are affected by genetic and environmental factors.
The path of the LC can be done through the use of empirical mathematical models and predicting the yield on each day of lactation with minimum error; but not all models fit a typical lactation curve (Fernández et al. Citation2002; Gonzáles-Peña et al. Citation2012). Therefore, the importance of mathematical models (citing Spline model) as useful tools for the description and analysis of LC (Brito et al. Citation2017) and that the MG breed has proven to be the best fit than several other common functions (Wood, Cappio-Borlino, Cobby and Le Du, Wilmink and Legendre) (León et al. Citation2012). Therefore, it is interesting to summarise the phenomenon of lactation in a few descriptive parameters, so that they can be interpreted biologically; referring to the rate of increase and decline of production before and after peak respectively, as well as the environmental factors that affect these parameters.
In the present work, we seek to generate information on the behaviour of the traits of peak yield (PY), peak day (PD) and P in the LC of the MG goats, considering the influence of the various factors to predict the total dairy production. Therefore, the main objective of this study was to phenotypically characterise the PY, PD and P of lactation in MG goats through the use of the Spline model and to evaluate the effect of some non-genetic factors over the variation of these parameters.
Materials and methods
Data
The data used in this research were taken from the historical data base of the official milk control programme (A4 methods – ICAR Citation1990) of The National Association of Breeders of the MG Goats (MURCIGRAN) and the mean lactation length was 210 days.
A more detailed description of breed as handling, feeding practices, level drying off goats, body conformation, milk production and quality, seminal doses, etc. is given in Delgado et al. (Citation2017), Ministry of Agriculture, Fisheries and Food of Spain and MURCIGRAN, where the last institutions have updated web pages daily providing official data.
The general file contained a total of 1,918,780 records, of which 315,663 corresponded to lactations of a total of 122,883 individuals, the age of the active animals was between 4 and 8 years, belonging to 245 farms (range of goats per herd 1297) located in three large dairy centres (Granada, Almeria and Cordoba). Regarding the body condition of all the animals from the year 2012, annual morphological qualifications are performed annually (annual average of 4789 animals in 30 herds) that are still under evaluation with a view to joining the improvement programme.
The coordinates of the regions of Granada (37° 10' 35 "N – 3° 35' 52" W), Almeria (37° 50'24 "N – 2° 28'4" W) and Cordoba (37° 53' 4 "N – 4° 46'44" W), although they are in the same autonomous community (Andalusia-Southern Spain) have a different climatic classification on the Köppen and Geiger scale as Cold semi-arid climate (BSk) for Almeria and the Hot-summer Mediterranean climate (Csa) for the case of Granada and Cordoba. Presenting variabilities in terms of average temperatures (15.5–18 °C), humidity (60–65%) and rainfall (228–612 mm).
During the exploratory analysis, the database was edited and standardised by applying filters with exclusion criteria, to eliminate the data considered anomalous (repeated records, lactations with less than 6 controls, or those daily yields that exceed 10 kg or are below 0.2 kg of milk). The pre-final file consisted of 1,349,347 records, which corresponded to 180,872 lactations belonging to 85,404 goats of 229 herds, subsequently; these data were grouped and coded by levels ().
Table 1. Data coding by levels.
Statistical analysis
The statistical analysis was divided into 4 steps:
(1) Processing of the data consisted in analysing the LC per animal, considering as variation factors (region, type of kidding, lactation number and season). To estimate these variation factors that affect the traits under study, a mixed model with random effects was applied (details and a summary can be found in the Supplementary Material Table S1).
(2) We used the mathematical model ‘Spline’ quadratic. This model was chosen because it has a better coefficient of determination (R2=0.98 for MG breed), flexibility and goodness of fit (Macciotta et al. Citation2011; León et al. Citation2012). This biomodeling of LC by an animal, allowed the adjustment of two or more straight lines that describe the production until and after the peak of lactation. Likewise, the general form of the function is in accordance with that presented by Brito et al. (Citation2017) and Meyer (Citation2005), the equation being stated as follows:
(1)
(1)
and
(2)
(2)
Where: yt represents the average daily milk production recorded on day t, while β0, β1, β2 and β3 are the parameters specifically designed to adapt to the shape of the LC due to its flexibility. Meanwhile, X is treated as an additional parameter to estimate and represents the day of lactation, where the knot point is produced, that is, where the two polynomial functions are linked.
(3) The P measures were identified from the knot in the individual curves by means of Spline, allowed us to locate each vertex of the generating polygon of the curve from the rate of ascent (RA) and taking into account the peak day (PD) that facilitated the training later of control points that showed the greatest tangible decline, to calculate and analyse the P or rates of descent (RD) in their different phases, such as: initial persistency (IP), final persistency (FP) and total persistency (TP).
Where IP: defined as the difference between the area under the LC in the middle third (71–140 days) and initial from 11–70 days. FP: defined as the difference between the area under the LC in the final third (141–210 days) and initial third of 11–70 days. TP: defined as the difference between the accumulated production of days 71–210 and the average of the initial third of 11–70 days. The P obtained is dimensionless.
(4) A comparison of means was made with the test of least significant difference (LSD).
For the application of filters with exclusion criteria and all statistical data analysis (realization of the 4 steps described above) we use the libraries (car, RODBC, nlme, Matrix, lme4, agricolae, lmerTest, free-knotsplines, LSD test) of the statistical software package ‘R’ version 3.2.3 (R Core Team Citation2014).
Results
shows the estimation of milk yields and P in the goat population MG and the variation factors according to the Spline model. The biomodeling of the LC of this population is presented in , where PY was reached 2.4 kg, at 50 days, being its TY of 435.81 kg, with global persistence of IP = 10.70, FP = 9.95 and TP = 10.28. In turn, the corresponding biomodeling of the curves as a function of the variation factor is presented in , respectively. In the variation factor region (), in function of TY, FP and TP variables, significant differences (SD) were observed between the three regions, where Almeria presents the FP and TP at 0.21 and 0.14, respectively and a TY (superior to 27.5 kg) superior to Cordoba and Granada. However, the PD, PY and IP variables did not show SD according to the regions, with average values of 49 days, 2.4 kg and 10.73, in that order.
Figure 1. Biomodeling of the lactation curve in Murciano-Granadina goats and their persistency. PY: peak yield; IP: initial persistency; FP: final persistency; TP: total persistency.
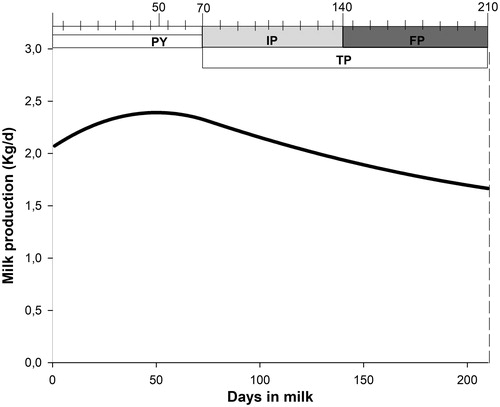
Figure 2. Biomodeling of the lactation curve in Murciano-Granadina goats: PY: peak yield; IP: initial persistency; FP: final persistency; TP: total persistency according to variation factors: (a) dairy control nuclei of Almeria, Cordoba and Granada; (b) type of kidding (single, twin, triplet and upper), (c) lactation number (first, second, third, fifth and upper); and (d) season (spring, summer, fall and winter); all adjusted by Spline.
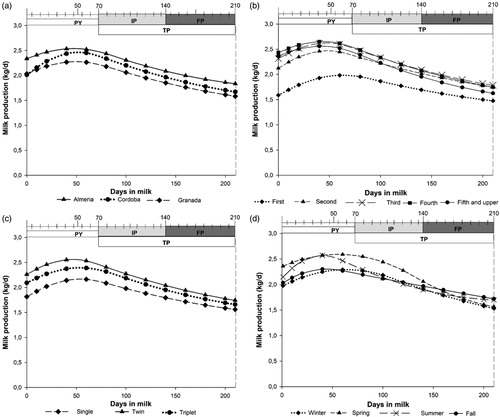
Table 2. Biomodeling of the lactation curve in Murciano-Granadina goat for knot, productions and persistency fitted by Spline function including full data set and to each level of the factors analysed.
shows the conduct of the curve as a function of the variation factor of the type of kidding; SD are appreciated between the different levels; except for the PY with an average value of 2.37 kg. These differences are more appreciable between the double kidding type versus single and triple kidding type; where the PD of the double kidding type reached around 7–8 days later with respect to the other kidding types (average closer to 53–54 days). The same situation presented the persistency (IP, FP and TP) even though presented SD; these are more evident between the double kidding type versus single and triple kidding type (similar P), highlighting that the latter showed better P. These results corroborate the importance of PD-late to have better lactations P for this factor. With regards to TY, the most appreciable difference is between the double kidding type versus single and triple kidding type, for the difference of 51.62 kg less with respect to the average of the other levels.
The lactation number, that is, first, second, third, fourth, fifth or more lactations (), clearly shows the evolution of milk production both for its increase and decrease; showing that the data obtained from PD, PY and TY; both for the second and fifth lactations did not show SD to each other. While SD are given regarding the first lactation showing that in the PD case it was presented 18 days later than the general average (45 days), the PY reached was lower with a difference of 0.59 kg; which is also reflected in the TY with a difference of 79.7% with respect to the subsequent lactation productions (general average for this factor 463.57 kg), this lactation having the least increase. The P obtained as a function of this variation factor presented SD with alternating values for each type of persistence (IP, FP and TP); data that show us that the longest P was presented by the first lactation to decrease in cascade form. In other words, the more lactations a goat has, the more persistent these detriments are, the more evident these decreases in the FP from the third lactation, while the IP and TP although they present losses, these are gradual in the different lactations.
shows the biomodel of the curves according to the function of season; confirming the climatic variations and food disposition between Mediterranean-continental climate zones (Almeria, Cordoba and Granada). The PY obtained for all seasons did not present SD and the PD were grouped into two groups; group 1 (winter, spring) and group 2 (summer, fall) where group 1 differs from group 2 by having the PD above the global PD of this factor (51 days) with more than 12 and 5 days, respectively. As for group 2, they presented early PD below the mean with differences of 11 and 6 days, respectively. The TY presented SD between the seasons; the spring season present better yields, producing 25.61 kg more above the average for this factor (441.24 kg), followed by the summer season which, in spite of producing 2.45 kg more above the average, did not present SD. Regarding the seasons of winter (18.85 kg) and fall (9.20 kg) there was no SD present between the two, but its low productions that were below the average for this factor stands out. Regarding the P obtained for this factor, SD are appreciated for both IP, FP and TP with values ranging from 9.91 to 10.94, with the fall season having the longest P, followed by summer and winter P that were similar, and culminating the block, the P of spring.
Discussion
Once defined the Spline model as the function presenting the best fitting for the Murciano-Granadina lactation curve by our own team (León et al. Citation2012), the model showed its versatility and flexibility for obtaining parameters and knots, for the biomodeling of the individual LC and from which it was possible to identify and infer traits such as PD, PY and P, useful in diverse aspects of the goat production. Taking into account the variation factors, they contribute to explain the variability of these traits, showing us a biologically real panorama of the MG goat population and offering new tools to favour the selection and improvement of the breed. The results are in agreement with that described by León et al. (Citation2012) and Macciotta et al. (Citation2011) who advocates that this model is specifically designed to adapt to the LC due to the good fit of data, likewise Meyer (Citation2005) point out that this model is flexible, number of parameters to be estimated more consistent, plausibility of results and fit.
The variation factors offer relevant information for the selection criteria for the variations that LC undergoes in the different breeds and periods, which have already been widely studied and described by Oravcová and Margetín (Citation2015), León et al. (Citation2012) and Macciotta et al. (Citation2011). In this way, the assessment of these production characteristics (PD, PY, TY, IP, FP and TP) and their relationships based on biomodeling, favour the breeding and genetic improvement of the breed corroborating what has been stated by Gonzáles-Peña et al. (Citation2012), Jakobsen et al. (Citation2002) and Swalve (Citation2000) who point out that in order to favour the selection and shorten the generational interval, early predictions about the genetic potential of an individual must be made.
In our results, PY was reached in the seventh week (50 days), values close to the intervals reported in the MG breed by León et al. (Citation2012), Dijkstra et al. (Citation2010) and Fernández et al. (Citation2002); which fix this PD between the 3rd and 8th week. This PY has been reported in other Spanish breeds, between the 2nd and 3rd week in the Majorera breed; in the 4th week in the Tinerfeña and Malagueña breeds cited in León et al. (Citation2012). In other breeds of goats, studies published by Rojo-Rubio et al. (Citation2016), Montaldo et al. (Citation1997), Mourad (Citation1992) and Gall (Citation1981) locate the PD at wide margins ranging from the 1st week (early) to the 20th week of lactation.
The location of the knots allowed us to identify adequately and by factor the RA, PD, RD represented by sections by IP, FP and TP. The P was presented with variations with respect to each factor. In general, there are two types of events, the first is early PD with a high PY providing a high TY but with low P; in the second, the relationship is inversely proportional; where if the late PD with moderately high PY, the TY will be diminished but will have better P. This tetrapartite connection affects the magnitude, temporality of dairy yields for each variation factor, but also allows us to evaluate the individual capacity of the MG goat to maintain adequate levels of production. In this regard Montaldo et al. (Citation1997), for different genetic groups, promotes a negative association between maximum production and P, suggesting differences in the relationship between CL parameters.
The results obtained by geographic region confirm the influence of the climate for high final productions, where Almeria has a milder climate (due to its proximity to the sea) with respect to Cordoba and Granada, corroborating what was described by León et al. (Citation2012), which makes it have summers with more comfortable temperatures (below 32 °C), less cold winters (9 °C) and presence of more hours of sunlight (2994 annual hours, datum AEMET-Spain), conditions that increase the photoperiod and thus a higher total yield. Similar results were found by Russo et al. (Citation2013), Flores et al. (Citation2011) and Garcia-Hernandez et al. (Citation2007) who described a correlation between photoperiod, food intake and milk yield. The regions of Cordoba and Granada, although they have a considerable number of hours of sunshine (2903 and 2899, respectively), often have temperatures of maximum or equal to 40 °C and minimum temperatures that range between −3 and −5 °C. Although goats are considered among the most heat-tolerant species, Todaro et al. (Citation2015) describe that exposing them to high temperatures has a high negative impact on immune function, udder health, production and reproduction. In this respect, studies conducted by Menéndez-Buxadera et al. (Citation2012) describe losses by thermal stress equivalent to 1.9% in the TY production of the herd during 7 days for the MG were quantified.
The double and triple kidding factor presented better TY than the single one; which was consistent with previous findings of Carnicella et al. (Citation2008) confirming the biological illustration described by Rojo-Rubio et al. (Citation2016) and Pulina et al. (Citation2007), who explained that the effect of prolificacy and production differences based on these aspects are determined by hormonal causes since the increase in the number of foetuses corresponds to a larger volume of the placenta that tends to increase the amount of placental lactogen, which intervenes in the development of the glandular tissue of the udder during pregnancy, promoting an increase in production and can be affected by nutritional manipulation and seasonal conditions. As for single kidding, authors such as Ahuya et al. (Citation2009), Carnicella et al. (Citation2008) and Vecerova and Krizek (Citation1993), have reported the significant effect of this type of kidding and its low milk production; where McGregor (Citation2018) added that the goats with single kids influence the composition of the milk (higher percentage of fat and protein); However, Peris et al. (Citation1997) concluded that prolificacy did not affect the dairy milk production or its composition in studies with MG goats.
In our results, the single and triple kidding type presented good P, in this respect Rojo-Rubio et al. (Citation2016) reported that P was higher for single kidding type than twins, contrary to what was described by León et al. (Citation2012) where P was higher when the number of offspring was smaller. Likewise, our results indicate that the PD along with PY are determinant to detect adequate P, being specific for the type of kidding that the PD be late and that PY is moderately high. Regarding the lactation number factor, it was observed that, starting from the second lactation, the TY values increased considerably, similar results with that described by León et al. (Citation2012), Carnicella et al. (Citation2008) and Fernández et al. (Citation2002), who reported an increase in milk production as the lactation number in goats increases.
In this study, high TY for this factor was observed in the third and fourth lactation according to what was reported by Goetsch et al. (Citation2011) and Carnicella et al. (Citation2008) however, studies such as that of Peris et al. (Citation1997) reported that these high TY would occur until the third lactation. Note that the third and fourth lactations followed a similar path with their increase and decline, with differences being highlighted regarding the fifth lactation, with a marked decrease in goats with ages over 7 years. Regarding the PD obtained for this factor, which went from day 42 to 63, they are positioned closely to the means described by León et al. (Citation2012), Haenlein (Citation2002), Rota et al. (Citation1993), Vecerova and Krizek (Citation1993) and higher than reported by Fernández et al. (Citation2002) from 14 to 31 days (1st, 2nd and 3rd lactation) in MG.
The first lactation presents peculiar data, where it showed a late PD, a low PY and TY. Where the TY represents 79.7% with respect to the production of subsequent lactations, similar results were described by Goetsch et al. (Citation2011) and Carnicella et al. (Citation2008) that reported the fall of the production in goats of first lactation, reaching only 70–80% of the production, with respect to later lactations. This low production has been amply explained by Stefanon et al. (Citation2002) who indicate that it is due to a physiological effect of the goat, an effect related to mammary development (completed in the fifth week of lactation) because they were lower in the first conception, this showed that the alveoli did not involute and were added to those that developed in the next lactation. The importance of this first lactation consisted of two points: the first confirmed the effect of lactation on the scale and shape of the LC, where Gipson and Grossman (Citation1990) emphasised that P is usually greater in the first lactation (consistent with our findings). The second constituted a determining factor in the composition of milk (milk richer in fat and protein), which in turn is closely related to the age of the animal (Carnicella et al. Citation2008). In this study, it was observed that 47.55% of the dairy goat census is in a range between 4 and 5 years of age.
The variability of the P obtained for these factors (more evident in FP from the third lactation) indicated that they were detrimental as the lactation number and age increased, in addition to being closely related to the presentation of the PD and the PY, suggesting that earlier PD was presented with the PY, and FP being the most affected. These results confirmed the inverse relationship between PY and P traits (modifying the shape of the LC) described by Montaldo et al. (Citation1997) and Gipson and Grossman (Citation1990). Regarding this, Stefanon et al. (Citation2002) suggested that it was preferable to achieve P lactations with less emphasis on PY and longer calving intervals in order to provide adequate animal welfare and to obtain adequate economic benefits. Regarding the season variation factor, SD did not exist in PY; however, these differences were appreciated in the case of TY, positioning the spring season with the best productions compared to the other season; results according to what was reported by León et al. (Citation2012) and Goetsch et al. (Citation2011).
On the other hand, the productions in the summer, fall and winter seasons were decreasing (in the order mentioned), confirming the fluctuations in dairy production. This coincides with the studies conducted by Montaldo et al. (Citation1997) in dairy goats (Alpine, Grenadine, Nubian, Saanen and Toggenburg crosses with local goats) indicating that a different scale effect of season on lactation curves in the different genetic groups affects the traits associated with lactation. As for the winter season, León et al. (Citation2012) indicated that goats which calved in this season present a moderate increase in milk yield up to the peak, probably reflecting the scarcity of food resources and the influence of adverse weather conditions in this period. The results found in this study are consistent with the aforementioned, with production in the summer and fall being above the average (441.2 kg). However, León et al. (Citation2012) warn that these results should be taken with caution, since the seasonal effects will depend on the climate variability by regions and the degree to which the management systems are able to minimise the exposure of the goats to the impact of the seasonal environmental effects.
Regarding the P obtained, they indicate that the fall season was the one that presented the best results for the IP, FP and TP but lower in the TY. It is worth mentioning that the final production was the one that presented the lowest values in all the seasons, a result that was inconsistent with that presented by León et al. (Citation2012) where it was indicated that the kids born in spring had the highest level of initial milk production and that they stayed with a good P after the peak. Also, the fall season was the one that presented a bad P attributing these results to the detrimental effects of low temperatures and food shortages. In our results, the longest P was associated with the presentation of late PD, the PY of each factor and the negative energy balance of the lactating female for each season; Although spring showed the best TY, it showed the least P, contrary to the winter season, which was the one with the lowest TY and longest P. Similar results were described by Montaldo et al. (Citation1997) indicating that it had lower PY and higher P in the months of November–February (part of fall and winter) than the months of March–October (spring, summer and part of fall).
In this regard, Macciotta et al. (Citation2011) described that models able to give an early estimate of P in lactation in progress may represent useful tools for both breeding and management strategies. In this regard, Capuco et al. (Citation2003) suggested that P lactations can also be increased with an increase in photoperiod, incorporating good management practices as breastfeeding progresses at different times of the year. In relation to this, Macciotta et al. (Citation2011), Dijkstra et al. (Citation2010) and Swalve and Gengler (Citation1999) describe that P (recommended as a selection index) that relates to the animal’s fitness and survival traits that reduce the classic metabolic stress of the high producers, and therefore animals with higher P are less exposed to health and fertility problems and can exploit efficiently cheaper feeds.
For all the above, it was suggested to find a balance between the duration of P and welfare of the animal, allowing us to obtain more efficient lactations (Capuco et al. Citation2003). Likewise, Pala and Savaş (Citation2005) and Jakobsen (Citation2000) concluded that a genetic selection can be made through P without altering the amount of total milk, while at the same time genetically modifying the lactation curve. In line with this argument, these results would allow incorporating these traits in the improvement scheme to later perform genetic evaluations and observe how the interrelation of old traits with new traits occurs.
Conclusions
The model Spline proved to be ideal in accurately describing the shape of the individualised lactation curve of the MG breed, suitably locating dairy productions, peaks and persistency in relation to the knots obtained and their variation factors (region, type of kidding, lactation number and season). Significant differences in the curve parameters conditioned by the region were observed, but it was not a pure effect, rather a conglomerate of micro effects such us climate, photoperiod, agroecological aspects, etc. Also, the studied curve parameters were affected by the prolificacy probably due to a hormonal interaction.
From the second to the fifth or higher lactation there was a ‘cascade’ effect, i.e. as the lactations progress, the persistency and the presentation of the days at the peak (precocious) decreased gradually but antagonistically presented their highest yields. The first lactation was the one that showed long persistency, presenting also the lowest production peak reached late, as well as the lowest Total Yield. The main differences between the seasons were recorded between spring and winter, where the superiority of spring in terms of Total Yield stands out, as well as the greater persistency in winter, reaching later with the lowest peak. As for fall and summer, the lowest persistency was recorded, reaching a production peak of the earliest and a similar total production.
Ethical Approval
The research reported in submitted paper have been conducted in an ethical and responsible manner, with the formal approval of the MURCIGRAN breeders' association (they provide us with data on historical dairy controls - A4 methods by ICAR, 1990- was described in materials and methods), no live experiments or clinical trials were conducted with the animals.
Acknowledgements
The authors thank MURCIGRAN. Special thanks to Devon Dublin PhD, for his support in the reviews.
Disclosure statement
No potential conflict of interest was reported by the authors.
Additional information
Funding
References
- Adewumi OO, Oluwatosin BO, Tona GO, Williams TJ, Olajide OO. 2017. Milk yield and milk composition of Kalahari Red goat and the performance of their kids in the humid zone. Arch Zootec. 66:587–592.
- Ahuya CO, Ojango JMK, Mosi RO, Peacock CP, Okeyo AM. 2009. Performance of Toggenburg dairy goats in smallholder production systems of the eastern highlands of Kenya. Small Rumin Res. 83:7–13.
- Brito LF, Silva FG, Oliveira HR, Souza NO, Caetano GC, Costa EV, Menezes GRO, Melo ALP, Rodrigues MT, Torres RA. 2017. Modelling lactation curves of dairy goats by fitting random regression models using Legendre polynomials or B-splines. Can J Anim Sci. 98:73–83.
- Capuco AV, Ellis SE, Hale SA, Long E, Erdman RA, Zhao X, Paape MJ. 2003. Lactation persistency: insights from mammary cell proliferation studies. J Anim Sci Suppl. 3:1831.
- Carnicella D, Dario M, Caribe-Ayres MC, Laudadio V, Dario C. 2008. The effect of diet, parity, year and number of kids on milk yield and milk composition in Maltese goat. Small Rumin Res. 77:71–74.
- Delgado JV, Landi V, Barba CJ, Fernández J, Gómez MM, Camacho ME, Martínez MA, Navas FJ, León JM. 2017. Murciano-Granadina Goat: A spanish local breed ready for the challenges of the twenty-first century. In: Simões J, Gutiérrez C (Eds). Sustainable goat production in adverse environments: Volume II. Cham: Springer International Publishing; p. 205–219.
- Dijkstra J, Lopez S, Bannink A, Dhanoa MS, Kebreab E, Odongo NE, Fathi Nasri MH, Behera UK, Hernandez-Ferrer D, France J. 2010. Evaluation of a mechanistic lactation model using cow, goat and sheep data. J Agric Sci. 148:249.
- Fernández C, Sánchez A, Garcés C. 2002. Modeling the lactation curve for test-day milk yield in Murciano-Granadina goats. Small Rumin Res. 46:29–41.
- Flores MJ, Flores JA, Elizundia JM, Mejia A, Delgadillo JA, Hernandez H. 2011. Artificial long-day photoperiod in the subtropics increases milk production in goats giving birth in late autumn. J Anim Sci. 89:856–862.
- Gall C. 1981. Goat production. London: Academic Press Inc. [accessed 2016 May 5]. http://www.cabdirect.org/abstracts/19810472665.html
- Garcia-Hernandez R, Newton G, Horner S, Nuti LC. 2007. Effect of photoperiod on milk yield and quality, and reproduction in dairy goats. Livest Sci. 110:214–220.
- Gipson TA, Grossman M. 1990. Lactation curves in dairy goats: a review. Small Rumin Res. 3:383–396.
- Goetsch A, Zeng S, Gipson T. 2011. Factors affecting goat milk production and quality. Small Rumin Res. 101:55–63.
- Gonzáles-Peña D, Acosta J, Guerra D, González N, Acosta M, Sosa D, Torres-Hernández G. 2012. Modeling of individual lactation curves for milk production in a population of Alpine goats in Cuba. Livest Sci. 150:42–50.
- Guevara CE, Rodrigues MT, Vieira RAM, da Silva MC, Lima MC, Hernandez-Herrera D. 2018. Non-linear models to describe the consumption, nutrient deposition in the body and growth of Saanen x Alpina goatlings. Arch Zootec. 67:41–53.
- Haenlein G. 2002. Feeding Goats for Improved Milk and Meat Production: Composition of goat milk and factors affecting it. Delaware (DE): Department of Animal and Food Science-University of Delaware Press. USA.
- ICAR. 1990. International Committee for Animal Recording | ICAR. [accessed 2012 May 10]. http://www.icar.org/
- Jakobsen JH. 2000. Genetic correlations between the shape of the lactation curve and disease resistance in dairy cattle [dissertation]. Copenhagen, Denmark: The Royal Veterinary and Agricultural University.
- Jakobsen JH, Madsen P, Jensen J, Pedersen J, Christensen LG, Sorensen D. 2002. Genetic parameters for milk production and persistency for Danish Holsteins estimated in random regression models using REML. J Dairy Sci. 85:1607–1616.
- León JM, Macciotta NPP, Gama LT, Barba C, Delgado JV. 2012. Characterization of the lactation curve in Murciano-Granadina dairy goats. Small Rumin Res. 107:76–84.
- Macciotta NPP, Dimauro C, Rassu SPG, Steri R, Pulina G. 2011. The mathematical description of lactation curves in dairy cattle. Ital J Anim Sci. 10:e51.
- Marín PA, Agudelo DA, Restrepo LF, Cañas JJ, Cerón-Muñoz M. 2009. Lactation curves in hybrid goats by the use of nonlinear mathematical models. Rev Lasallista Investig. 6:43–49.
- McGregor BA. 2018. The effects of nutrition and parity on the development and productivity of Angora goats: 3. Effects of six combinations of mid pregnancy and postnatal nutrition on udder development, lactation, milk composition and net energy of milk production. Small Rumin Res. 161:13–23.
- Menéndez-Buxadera A, Molina A, Arrebola F, Clemente I, Serradilla JM. 2012. Genetic variation of adaptation to heat stress in two Spanish dairy goat breeds. J Anim Breed Genet. 129:306–315.
- Meyer K. 2005. Random regression analyses using B-splines to model growth of Australian Angus cattle. Genet Sel Evol. 37:473–500.
- Montaldo H, Almanza A, Juárez A. 1997. Genetic group, age and season effects on lactation curve shape in goats. Small Rumin Res. 24:195–202.
- Mourad M. 1992. Effects of month of kidding, parity and litter size on milk yield of Alpine goats in Egypt. Small Rumin Res. 8:41–46.
- Oravcová M, Margetín M. 2015. First estimates of lactation curves in white shorthaired goats in Slovakia. Slovak J Anim Sci. 48:1–7.
- Pala A, Savaş T. 2005. Persistency within and between lactations in morning, evening and daily test day milk in dairy goats. Arch Anim Breed. 48:396–403.
- Peris S, Caja G, Such X, Casals R, Ferret A, Torre C. 1997. Influence of kid rearing systems on milk composition and yield of Murciano-Granadina dairy goats. J Dairy Sci. 80:3249–3255.
- Pulina G, Nudda A, Macciotta NPP, Battacone G, Giacomo Rassu SP, Cannas A. 2007. Non-nutritional factors affecting lactation persistency in dairy ewes: a review. Ital J Anim Sci. 6:115–141.
- R Core Team. 2014. R: A language and environment for statistical computing. R Found Stat Comput Vienna, Austria. [accessed 2014 May 11]. https://www.r-project.org/
- Rekik B, Gara AB, Hamouda MB, Hammami H. 2003. Fitting lactation curves of dairy cattle in different types of herds in Tunisia. Livest Prod Sci. 83:309–315.
- Rojo-Rubio R, Kholif AE, Salem AZM, Mendoza GD, Elghandour M, Vazquez-Armijo JF, Lee-Rangel H. 2016. Lactation curves and body weight changes of Alpine, Saanen and Anglo-Nubian goats as well as pre-weaning growth of their kids. J Appl Anim Res. 44:331–337.
- Rota AM, Gonzalo C, Rodriguez PL, Rojas AI, Martin L, Tovar JJ. 1993. Effects of stage of lactation and parity on somatic cell counts in milk of Verata goats and algebraic models of their lactation curves. Small Rumin Res. 12:211–219.
- Russo VM, Cameron AW, Dunshea FR, Tilbrook AJ, Leury BJ. 2013. Artificially extending photoperiod improves milk yield in dairy goats and is most effective in late lactation. Small Rumin Res. 113:179–186.
- Shaat I. 2014. Application of the Wood lactation curve in analysing the variation of daily milk yield in the Zaraibi goats in Egypt. Small Rumin Res. 117:25–33.
- Stefanon B, Colitti M, Gabai G, Knight CH, Wilde CJ. 2002. Mammary apoptosis and lactation persistency in dairy animals. J Dairy Res. 69:37–52.
- Swalve HH. 2000. Theoretical basis and computational methods for different test-day genetic evaluation methods. J Dairy Sci. 83:1115–1124.
- Swalve HH, Gengler N. 1999. Genetics of lactation persistency. Br Soc Anim Sci. 24:75–82.
- Todaro M, Dattena M, Acciaioli A, Bonanno A, Bruni G, Caroprese M, Mele M, Sevi A, Marinucci MT. 2015. Aseasonal sheep and goat milk production in the Mediterranean area: physiological and technical insights. Small Rumin Res. 126:59–66.
- Vecerova D, Krizek J. 1993. Analysis of variance of milk performance in goats of white short-woolen breed. Zivocisna Vyroba-UZPI (Czech Republic). 38:1–7.