
 ?Mathematical formulae have been encoded as MathML and are displayed in this HTML version using MathJax in order to improve their display. Uncheck the box to turn MathJax off. This feature requires Javascript. Click on a formula to zoom.
Abstract
Climate and animal agriculture are interrelated processes and related foods may be threatened through changes in temperature, rainfall and extreme weather events. The present study was aimed to investigate the climate trend over the production area of Grana Padano (GP) cheese. The area is in North of Italy, covers a total land of 46,000 km2 and it is highly suited for agricultural and livestock productions. Past (1971–2000), recent (2001–2010) and future (2020–2050) climate scenarios were considered and compared. The analysis showed positive anomalies both for minimum and maximum temperatures and a decrease of precipitation for recent and future climate. The Gaussen-Bagnouls classification pointed out a change from humid to semi-humid climate during summer months. These data suggest a warming trend and increasing risk of summer aridity over the production area of GP cheese. The analysis of temperature-humidity index (THI), from past throughout the future scenario, highlighted an increased risk of heat stress for dairy cows. The worst THI condition was predicted for July of the future scenario when milk loss may reach a level of 7 kg/cow/day. The changes in climate may threat the potential to produce GP cheese, indirectly by the negative effect of precipitation deficit on crops yield for cows feeding, directly by the increase of heat stress-related milk loss. These findings may be of help to animate the debate on climate change-related impacts on regional food systems and support policymakers in developing adaptation strategies for the production system of GP cheese.
Climate is changing in the north Italy.
Warming and aridity trend may threat the production of Grana Padano cheese.
Adaptation measures are required.
Highlights
Introduction
Numerous evidences prove that the climate is changing with effects on human life and activities. Animal agriculture systems are needed to supply food but they are likely to be affected by climate, through an indirect effect on feed production (Özkan et al. Citation2016) and a direct impact on animal welfare, production and reproduction (Bernabucci et al. Citation2010). The increase of temperature, the concentration of pouring rains and the lengthening of droughts are weather features related to climate change that may threaten crops yield and carrying capacity of rangelands in south Europe with the reduction of the suitable areas for traditional agricultural activities (Olesen and Bindi Citation2002; Nardone et al. Citation2010).
Heat stress due to high temperatures is one of major factor affecting dairy cow health and milk yield loss (Bernabucci et al. Citation2010). The degree of heat stress is measured by the temperature-humidity index (THI) (Hahn et al. Citation2003; Bohmanova et al. Citation2007) and critical thresholds for dairy cows, specific of the production system analysed, were provided (Bouraoui et al. Citation2002; Brügemann et al. Citation2012; Bernabucci et al. Citation2014).
Italian agro-industry is an important economic sector providing numerous high-quality foods and more than 200 are PDO (Protected Designation of Origin) or PGI (Protected Geographical Indication) labelled as defined in the Council Regulation CE 510/2006. The Grana Padano (GP) cheese is produced in the north Italy with a specific production protocol and it is recognised as PDO food since 1996.
The production of GP cheese involves about 5700 farms, 350,000 dairy cows, 148 dairies and 40,000 workers. About 2.3 million of tonnes of milk (23% of national milk production) are used every year to produce 4.5 million of cheese shapes with an economic values of 1.6 billion € (data available at: www.granapadano.it). The study on the effects of climate change on animal agriculture systems, even at regional scale, is important to guarantee animal well-being and to sustain rural communities and local products.
A recent study from South Africa investigated this issue and the milk yield produced by Holstein cows at pasture was associated with the pattern of heat stress to model geographical areas for optimal milk production under current and future climatic conditions (Williams et al. Citation2016). Although climate trend over the north Italy were forecasted (Tomozeiu et al. Citation2018), to date there is a lack of information about the future pattern of THI and related potential milk loss for the production area of Grana Padano cheese. Therefore, the present study was aimed at studying the patterns of temperature, rainfall and THI-related risk of milk loss over the GP cheese production area for past (1971–2000), recent (2001–2010) and future (2021–2050) climate scenarios.
Materials and methods
Study area
The production area of Grana Padano (GP) cheese is in North Italy and it is characterised by 38.5%, 16.7% and 44.8% of plain, hill and mountain, respectively. The production area of Grana Padano DOP, indicated in the production specification rules, includes the provinces of: Alessandria, Asti, Biella, Cuneo, Novara, Torino, Verbania, Vercelli, Bergamo, Brescia, Como, Cremona, Lecco, Lodi, Mantova (on the left of Po river), Milano, Monza, Pavia, Sondrio, Varese, Trento, Padova, Rovigo, Treviso, Venezia, Verona, Vicenza, Bologna (on the right of Reno river), Ferrara, Forlì Cesena, Piacenza, Ravenna and Rimini, as well as the follow municipalities in Bolzano province: Anterivo, Lauregno, Proves, Senale-S. Felice e Trodena (www.granapadano.it).
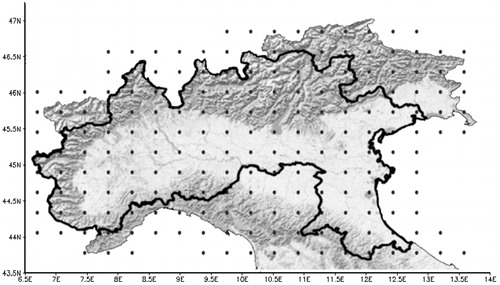
The map (ArcGIS software Citation2009) of north Italy with the regular grid (30 × 30 km) and the boundaries of the production area of GP cheese is shown in . The plain area is a part of the Po Valley and it includes most farms and dairies belonging the consortium of GP cheese. The area also extends toward the Alps mountains (north side) where is produced a special brand of GP cheese called Trentin Grana. The flat conformation and the water availability make the north Italy highly suited for forages and grains production. For this reason, the area has a high livestock stocking density composed by dairy cows farms, mainly to produce milk for GP cheese, beef cattle, swine and poultry.
Figure 1. Geographical map of the North Italy. The dark points represent the regular grid of 30 × 30 km from the agro-weather national database (BDAN) used in the study. The marked area corresponds to the production area indicated in the production specification rules of Grana Padano cheese (www.granapadano.it).
Meteorological data
Weather data referred to the period 1971–2010 were provided by agro-weather informatics national network (SIAN Citation2013). These data were estimated on a regular grid of 30 × 30 km () using the methodology of the kriging with external drift. The weather values at each point of this regular grid were calculated, starting from the data recorded in the Italian weather stations present in the neighbourhood of each node of regular grid, by an analytic function which depends on the distance, orientation and altitude. In this way it was possible to introduce the landforms of the area that strongly and differently influence the value of the meteorological variable considered (Perini et al. Citation2004).
Then, daily values of temperature (maximum and minimum), relative humidity (maximum and minimum) and precipitation were calculated for each node of regular grid and used to characterise the climatic conditions of the production area of GP cheese from 1971 to 2010. In addition, the temperature-humidity index (THI) was also calculated for each node and used to measure the degree of heat stress in dairy cattle (NOAA Citation1976):
(1)
(1)
Where, temperature (T) is expressed in °C and relative humidity (RH) in fraction of unit.
Future weather data (2021–2050) of temperature, precipitation, relative humidity and THI were carried out by using original climate projections coming from COSMO-CLM simulations performed under the project GEMINA (Project Italian MIUR/MATTM n. 232/2011), at ca. 0.0715° grid resolution and for the period 1971–2050. COSMO-CLM was forced by the global model CMCC-CM (Scoccimarro et al. Citation2011), using 20C3M forcing (i.e. GHGs as observed in the 20th century; http://www.ipcc-data.org/ar4/scenario-20C3M.html) from 1971 to 2005 and the IPCC-AR5 emission scenarios from 2006 to 2050 with representative concentration pathways (RCP) of 8.5.
Basic quality control procedures were applied to time series of weather data as indicated in the guide to the global observing system provided by World Meteorological Organisation (WMO Citation2007). The quality control procedures performed on temperature, relative humidity and precipitation were: completeness, extremes values, variability, internal and spatial consistencies. The missing and incorrect data were replaced from average values calculated on 5-day periods centred on concerned day. Validated data were used to analyse the pattern of temperature, precipitation and THI over the production area of GP cheese during the past (1971–2000), recent (2001–2010) and future (2021–2050) climate scenarios.
Climate anomalies
An anomaly is when something is different from average calculated over long time series. The anomaly shows if an area is warmer or cooler, rainier or drier in a given time (e.g. month) compared to the same period of a climate normals. The climate normals, as defined by the WMO, is based on 30-year historical averages of weather variables. Since 2015 the WMO refers the climatological standard normal to the averages of climatological data computed for the most-recent 30-year period finishing in a year ending with 0 (WMO Citation2017). We calculated the anomalies of temperature, precipitation and THI comparing weather series of the recent (2001–2010) and future (2021–2050) scenarios with the more recent climate normals of 1971–2000 and 1981–2010, respectively.
The future anomalies were shown by maps produced using an interactive desktop tool for visualisation and manipulation of earth science data (free software) called GrADS (Grid Analysis and Display System). In addition to this, the Gaussen-Bagnouls classification was used (Bagnouls and Gaussen Citation1957) to classify the past and recent climate according dry and wet conditions of the territory. The analysis combines monthly pattern of air temperature (°C) and precipitation (mm) displaying values as a combined double-scale representation throughout the year and it results in a useful tool to determinate the aridity of the climate as a long-term climatic trend. The combination of temperature (T) and precipitation (P) determines three types of climate feature in the Gaussen-Bagnouls classification: humid climate if P > 3T; semi-humid climate if 2T < P < 3T and arid climate if P < 2T.
Heat stress-related risk of milk loss
Starting from the weather data validated as describe above, maps of THI were produced (ArcGIS software Citation2009) for past (1971–2000), recent (2001–2010) and future (2021–2050) scenarios. The analysis was done only for the hottest months of June, July, August and September because the heat stress-related risk of milk loss has none meaning for colder weather regimes. Although the THI well indicates the degree of heat stress in livestock (low, moderate or high) its values are not easily associable to the magnitude of production loss. In the present study the maps of THI showing the risk of heat stress for dairy cows have been associated to the degree of heat stress-related production loss throughout the adoption of specific critic thresholds of THI.
The thresholds of THI and the magnitude of losses were extrapolated from our previous research (Bernabucci et al. Citation2014), conducted mainly on dairy cows bred in the north Italy, where the effects of THI on productive traits (milk, protein and fat yield) were calculated using test day records of cows. The study provided different thresholds and degree of losses in relation to the parity of cows and to the trait considered.
For these study, we need the average values, representative of Italian Holstein cow population, of THI thresholds and production losses for milk, protein and fat yield. The information used from Bernabucci study were: the thresholds of THI indicated for each parity and productive trait, the regression coefficients indicating the amount of loss for each parity and productive trait and the percentage of cow consistency for each parity on total cow population. Then, the average values of THI thresholds and yield losses, weighted for the number of cows for each parity, were calculated for each production trait according to the following formulas:
(2)
(2)
(3)
(3)
Where, %P is the percentage of cows in the total population for parity 1, 2 and 3. The THIthreshold_P is the threshold of THI for parity 1, 2 and 3. The bP is the regression coefficient of yield loss for parity 1, 2 and 3.
In are reported the thresholds of THI and the corresponding yield losses for each productive trait that were adopted to evaluate the heat stress-related risk of production loss over the production area of GP cheese. We assumed that the thresholds and the magnitude of yield losses were the same throughout the three scenarios analysed. All analyses were performed using R Core Team (Citation2012).
Table 1. Thresholds of THI indicating the beginning of heat stress and yield loss of milk, protein and fat for each unit of increment of THI above the threshold.
Results
Climate anomalies
shows monthly anomalies of temperature (maximum and minimum), THI (maximum and minimum) and precipitation recorded in the recent scenario 2001–2010 compared with the thirty years past reference (1971–2000). The analysis highlighted a general increase of temperature and THI, both for minimum and maximum values, and a decrease of rainfall. June pointed out the highest increase of 2.06 and 1.58 °C of maximum and minimum temperature, respectively. April, May, July, August and November showed positive anomalies of maximum temperatures greater than 1 °C. The same months showed also positive anomalies of minimum temperature that were below one degree except for November where the anomaly reached 1.18 °C.
Table 2. Monthly anomalies of temperature, THI and precipitation observed in the recent period (2001–2010) compared with the thirty years of reference 1971–2000.
June and November showed the greatest increase of THI, both for maximum and minimum values. April, May and October pointed out anomalies for maximum and minimum THI greater than one unit. The only negative anomalies were observed in September for maximum values and for minimum ones in December and January.
Precipitation decreased in almost all months of the year and the greatest reduction was observed in October (−37.25 mm). It should be noticed that rainfall decreased during all summer months and this pattern was more evident in June (−22.42 mm). On the other hand, precipitation showed the greatest increase in November (+39.66 mm) and, in a lesser extent, in February, April and December.
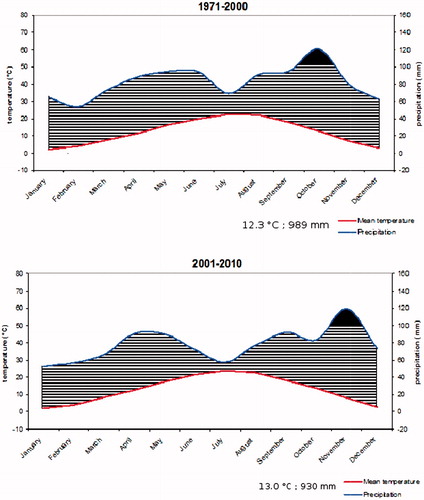
The monthly pattern of temperature and precipitation, both for the recent and past scenario, are shown through the Gaussen-Bagnouls output in . This method helps to figure out if there is a risk of aridity. The data of past scenario pointed out the lower values of precipitation in correspondence of the hottest months of July and August. In this case, precipitation (P) was greater of three times of temperature (T), a climatic condition that corresponds to a humid climate (P > 3T) in the Gaussen-Bagnouls classification. The analysis of the recent scenario pointed out a reduction of precipitation during summer and, in this case, the Gaussen-Bagnouls classification of July and August changed from humid to semi-humid climate (2T < P < 3T). Furthermore, it is also of interest the shift from October to November of high regime of precipitation (above 100 mm).
Figure 2. The Gaussen-Bagnouls classification method: (a) 1971–2000 and (b) 2001–2010. Monthly temperature and precipitation are related to describe the climatic feature of the area of GP: humid climate if P > 3T; semi-humid climate if 2T < P < 3T and arid climate if P < 2T. GP: Grana Padano.
Annual future anomalies of temperature (maximum and minimum), THI and precipitation are reported in . The analysis pointed out positive values of maximum temperature between 1 and 2 °C that will interest all the production area of GP cheese. Minimum temperature showed different levels of increase relative to the part of the area considered: from 1 to 1.5 °C in the northern and central-eastern sides; up to two degrees in the rest of the area.
Figure 3. Yearly anomalies of future scenarios 2021–2050 versus thirty years reference 1981–2010 in the production area of Grana Padano (marked): (a) maximum temperature (in °C); (b) minimum temperature (in °C); (c) Temperature Humidity Index (unit of THI); (d) precipitation (in mm). THI: temperature-humidity index.
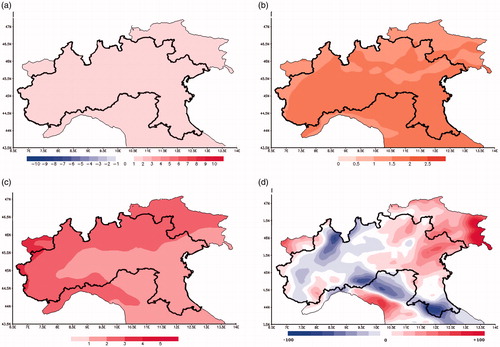
The analysis of future THI (June, July, August and September) showed an increased risk of heat stress over the production area of GP cheese. Positive anomalies up to 2 units of THI were pointed out for the flat part of the area. The worst condition, corresponding to 2–3 units of increment of THI, was highlighted over the hills and mountains, in the northern and western side of the area. The analysis of precipitation provided both positive and negative anomalies, an increase up to 50 mm in the eastern part of the production area of GP cheese and a reduction of the same magnitude in the northern and western side.
Heat stress-related risk of milk loss
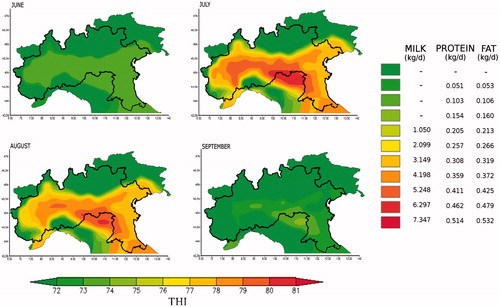
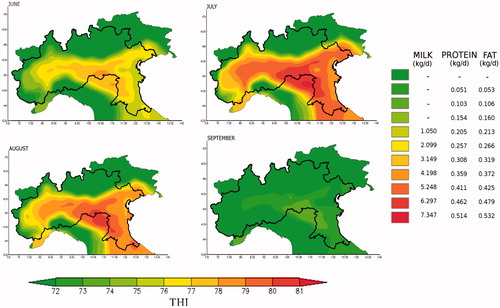
Maps of the summer (June, July, August and September) THI-related risk of production loss for the past (1971–2000), recent (2001–2010) and future (2021–2050) scenarios were provided. July and August were the only months affected by higher degree of heat stress in the past scenario. In this context, July pointed out the worst THI (about 80 units) that affected mainly the central and flat part of the production area of GP cheese. This condition of heat stress was associated to a loss of 5.248, 0.411 and 0.425 kg/cow/day for milk, fat and protein yield, respectively. June and September showed a moderate level of heat stress with low risk of loss only for protein and fat yield ().
Figure 4. THI-related risk of milk, protein and fat yield loss (kg/d) in the production area of Grana Padano (marked) during the period 1971–2000 in the months of June, July, August and September. The colours from green to red indicate increasing values of THI (from 72 to 81) to which correspond different degree of production loss: null (green) and maximum (red). THI: temperature-humidity index.
shows a worsening of heat stress conditions in the recent scenario (2001–2010). June had the strongest increase of THI, especially in the flat area, then it was associated to a risk of yield loss of milk, protein and fat (3.15, 0.30 and 0.32 kg/cow/day, respectively). July and August showed a widespread increase of THI and, even in this case, the central and flat part of the area was that more exposed. The heat stress reached values, in particular in July, corresponding to a maximum risk of production loss of 6.29, 0.46 and 0.48 kg/cow/day for milk, protein and fat, respectively. September was exposed to moderate heat stress that, as well as for the past scenario, corresponded to a low risk of protein and fat yield loss. The mountain area of GP (northern side), both for past and recent scenario, was not affected by critical values of THI.
Figure 5. THI-related risk of milk, protein and fat yield loss (kg/d) in the production area of Grana Padano (marked) during the period 2001–2010 in the months of June, July, August and September. The colours from green to red indicate increasing values of THI (from 72 to 81) to which correspond different degree of production loss: null (green) and maximum (red).THI: temperature-humidity index.
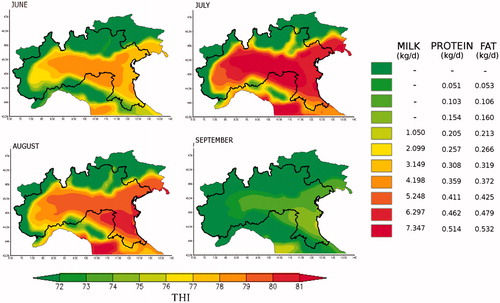
Results of the future scenario indicated a further worsening of THI associated to an increased risk of production loss spread over the production area of GP cheese (). July will have the most critical heat stress condition that will be associated to highest loss of milk, protein and fat yield (7.3, 0.5 and 0.5 kg/cow/day, respectively). All flat part of the area will be exposed to the risk of yield loss of 6.29, 0.46 and 0.48 kg/cow/day (milk, protein and fat, respectively) in August. The THI will continue to increase in June and heat stress may be responsible of loss of 5.2 kg/cow/day for milk and 0.4 kg/cow/day for protein and fat. September will have a slight increase of THI and, even in this scenario, only protein and fat yield will be affected by heat stress. Finally, the future worsening condition of heat stress will interest even the mountain side of the area in the hottest months of July and August.
Figure 6. THI-related risk of milk, protein and fat yield loss (kg/d) in the production area of Grana Padano (marked) during the period 2021–2050 in the months of June, July, August and September. The colours from green to red indicate increasing values of THI (from 72 to 81) to which correspond different degree of production loss: null (green) and maximum (red). THI: temperature-humidity index.
Discussion
Climate changes may impact on food system both by short term, resulting from more frequent and more intense extreme weather events, and long-term, caused by changing temperatures and rainfall patterns (FAO Citation2008). The present study was aimed to investigate long-term changes of temperature and rainfall over the production area of GP cheese. The analysis highlighted a warming trend and a reduction of rainfall especially in summer months. These climatic changes may threat the production of GP cheese from two perspectives: indirectly as the effects on agricultural activities for feed production; directly as the impact on animal welfare and production.
As indicated by Fuhrer et al. (Citation2014), the atmospheric water budget (precipitation minus evaporative demand) strongly influences soil water availability. The reduction of soil water availability is one of the most dominant limiting factors for crop production and it may occur because of the decrease in rainfall and/or by the increase of evaporation due to higher temperatures (Maracchi et al. Citation2005).
The Gaussen-Bagnouls classification showed a changing from humid to semi-humid of the summer climate and it suggests a reduction of soil water availability due to the increase of temperature and decrease of rainfall. The analysis of future scenario seems to confirm this trend where positive anomalies of temperature and negative anomalies of precipitation (especially in June and July, data not shown) were highlighted across the whole area of GP cheese.
This climate trend suggests an increased risk of water stress that may have a negative consequence on grains and forages production. Then the irrigation will be ever more important for dairy farms belonging to the consortium of GP cheese to guarantee a good level of self-supply of feed. However, the success of irrigation will depend on the severity of precipitation deficit, the water reserves availability (e.g. rivers) and the capacity of farms to adopt irrigation systems that work with lower volume of water.
The analysis of THI pointed out an increasing heat stress-related risk widespread over the production area of GP cheese, even in the mountain part, and a lengthening of the critical season from June until September. Heat stress is a major factor that can negatively affect milk production in dairy cows, especially in animals of high genetic merit (Nardone et al. Citation2010). Milk yield is positively correlated with feed intake and metabolic heat production. Dairy cows regulate body temperature reducing feed intake in order to reduce metabolic heat, then the drop of milk production is a consequence of this process.
In the present study, we adopted critical thresholds of THI to estimate heat stress-related risk of milk loss as function of past, recent and future pattern of THI. This approach suggests that dairy farms belonging to the consortium of GP cheese are exposed to an increasing risk of milk loss caused by the rising of heat stress both for intensity and length of exposure. The critical thresholds of THI used here were extrapolated from our previous study, aimed to estimate the susceptibility of Italian Holstein cows to heat stress and it was based on the analysis of individual test day records recorded during the years 2002–2007 (Bernabucci et al. Citation2014).
Considering this, we are confident that the maps of recent scenario well fit the heat stress-related risk of milk loss because they refer to the loss recorded in those years throughout the test day milk yield of cows. We can assume that these critical thresholds of THI well express the susceptibility of Italian dairy cows to heat stress considering both the genetic merit of animals and the thermal management of the recent scenario.
On the other hand, it is reasonable to think that the estimated heat-related milk loss for past and future scenarios could be affected by some confounding factors. The interpretation of past and future results should take into account the changes of animal due to genetic selection and the changes of thermal management with the implementation of newer and more effective solutions in mitigating heat stress. Both these aspects may have an impact to define the vulnerability of cows to hot climate.
In the seventies, eighties and nineties the genetic selection of cows was focussed mainly of high heritable productive traits, then the genetic merit for milk yield was improved while that for functional traits, such as fertility and longevity, was decreased. Because the negative genetic correlations between productive traits and heat tolerance (ranged from −0.24 to −0.56), the continued selection of productive traits may have contributed in decreasing heat tolerance (Bernabucci et al. Citation2014).
The aims of genetic selection of dairy cows are changing to face the new challenge of sustainability of dairy products, then traits such as fertility, longevity and health parameters will be even more important. In addition to this, even the method of genetic selection is changing, and the new genomic approach will lead faster improvements and the possibility to select productive and functional traits together. Recently, a genome-wide association analysis was carried out on 423 genotyped bulls and eight markers for productive traits were identified (Macciotta et al. Citation2017). The gene discovery analysis conducted in the surrounding of these markers highlighted interesting genes and some of them have been already associated with the mechanism of heat tolerance. These findings may be considered for future selection schemes of Italian dairy cows to improve heat tolerance and maintain milk yield.
Thermal management strategies may be used to mitigate the adverse effects of heat stress and they can be subdivided in structural (e.g. fans, sprinklers, orientation of barn and construction materials, shades, type of bedding), management (feeding and reproduction) and proactive solutions (e.g. weather alert).
The evaporative cooling system combines the use of water (high or low pressure) to wet the coat and fans to move air and facilitate heat dissipation. This system is the most widespread system because it allows to provide immediate thermal relief for dairy cows when challenged by high temperatures. The other structural solutions such as orientation and construction materials should be taken into account for new barns and they can be considered as a passive adaptation strategies.
Feeding strategies of heat stressed dairy cows consider the concentration of energy of diet, the integration of mineral and vitamins, the use of feed additives such as yeasts and plant extracts (Conte et al. Citation2018). Summer fertility may be improved by hormonally induced timed artificial insemination and by embryo transfer that allows embryos to bypass the period when they are most sensitive to elevated temperature (Hansen and Aréchiga Citation1999).
The THI forecasting services are available in different countries and since 2011 it is released even for Italy. In collaboration with the research unit for climatology and meteorology applied to agriculture (Beltrano et al. Citation2010) heat warning system for dairy cow was realised. The system forecasts THI for Italy (daytime and night-time) up to six days considering critical thresholds for production and mortality (http://cma.entecra.it/sac). The warning system is a useful tool because it informs the farmers in advance of the arrival of critical weather conditions such as heat waves. Next challenge will be the realisation of a heat warning service customised for farm in relation to the geographical position, barn structures, management adopted and genotype of animal.
In addition to the milk loss, a further reduction of cheese yield may derive from the worsening of cheese-making properties of Grana Padano cheese observed in correspondence of high temperature (Bernabucci et al. Citation2015). This process was suggested to be linked with the change of milk protein fraction because of αS-casein and β-casein drop and the increase of undefined proteins.
The changes in climate observed here may threat economic incoming of stakeholders involved in GP cheese supply chain. The prediction of climatic-related incoming loss in livestock system is not easy to model because many factors are involved. However, a recent study has evaluated the direct effect of THI on milk yield produced in the UK dairy system for the scenario 2010–2100 (Fodor et al. Citation2018). These authors estimated heat stress-related annual incoming loss if no adaptation measures would have been taken. The loss will be of £13.4M as the average per year (corresponding to 7% of current average annual dairy farm business income) and it will reach £33.8M in the years with the worst THI (corresponding to 18% of current average annual dairy farm business income).
The economic evaluation of the impact of heat stress on the production system of GP cheese was out of our aims. However, considering changes in climate occurring in the north Italy, it is reasonable to speculate that farmers and dairies belongings the consortium of GP cheese may be at high risk of incoming loss because of the adverse climate-related effects on quantity and quality of milk produced.
Conclusions
The production system of Grana Padano cheese is one of the most important components of Italian agro-food sector and any reduction of its productivity capacity will have negative impacts on economic conditions in Italy. The system is at high risk by direct and indirect effects of climate change. The reduction of precipitation and the increase of temperature may have negative impacts on the capacity of dairy farm to produce feeds and milk.
Coping with climate change-related risks throughout the food production chain (in this context of the GP) requires knowledge of climate trends and of adaptation measures. The system will be able to suffer huge economic losses, so it will be important that the adaptation does not burden only on the stakeholders and in any case, it will be important that the extra costs for these measures are offset by higher income.
From a risk assessment perspective, the findings pointed out in the present study could be used as a communication tool for stakeholders, policy makers and public opinion. Moreover, the maps could also be used as a management tool to highlight heat stress risk areas to prioritise adaptation strategies.
Disclosure statement
No potential conflict of interest was reported by the authors.
Additional information
Funding
Related Research Data
References
- ArcGIS software, Version 9.3.1. 2009. Esri. [acccessed 2013 Oct 16). http://www.esri.com.
- Bagnouls F, Gaussen H. 1957. Les climatsbiologiques et leur classification. Geo. 66:193–220.
- Beltrano MC, Esposito S, Primi V, Vitali A. 2010. Livestock innovative Italian forecasting heat warning system. In EMS Annual Meeting Abstracts, 11th EMS / 10th ECAM. Vol. 8, EMS2011-8-6.
- Bernabucci U, Lacetera N, Baumgard LH, Rhoads RP, Ronchi B, Nardone A. 2010. Metabolic and hormonal acclimation to heat stress in domesticated ruminants. Animal. 4:1167–1183.
- Bernabucci U, Biffani S, Buggiotti L, Vitali A, Lacetera N, Nardone A. 2014. The effects of heat stress in Italian Holstein dairy cattle. J Dairy Sci. 97:471–486.
- Bernabucci U, Basiricò L, Morera P, Dipasquale D, Vitali A, Cappelli FP, Calamari L. 2015. Effect of summer season on milk protein fractions in Holstein cows. J Dairy Sci. 98:1815–1827.
- Bohmanova J, Misztal I, Cole JB. 2007. Temperature-humidity indices as indicators of milk production losses due to heat stress. J Dairy Sci. 90:1947–1956.
- Bouraoui R, Lahmar M, Majdoub A, Djemali M, Belyea R. 2002. The relationship of temperature-humidity index with milk production of dairy cows in a Mediterranean climate. Anim Res. 51:479–491.
- Brügemann K, Gernand E, König von Borstel U, König S. 2012. Defining and evaluating heat stress thresholds in different dairy cow production systems. Arch Tierzucht. 55:13–24.
- Conte G, Ciampolini R, Cassandro M, Lasagna E, Calamari L, Bernabucci U, Abeni F. 2018. Feeding and nutrition management of heat-stressed dairy ruminants. Ital J Anim Sci. 17:604–620.
- FAO. 2008. Climate change and food security: A framework document. Rome (Italy): FAO. [accessed 2018 Oct 10]. http://www.fao.org/docrep/010/k2595e/k2595e00.htm.
- Fodor N, Foskolos A, Topp CFE, Moorby JM, Pásztor L, Foyer CH. 2018. Spatially explicit estimation of heat stress-related impacts of climate change on the milk production of dairy cows in the United Kingdom. PLoS One. 13:e0197076.
- Fuhrer J, Smith P, Gobiet A. 2014. Implications of climate change scenarios for agriculture in alpine regions-a case study in the Swiss Rhone catchment. Sci Total Environ. 493:1232–1241.
- GrADS (Grid Analysis and Display System) Version 1.7 beta 7, compiled by Karin Meier-Fleischer. [accessed 2013 Feb 21]. http://www.iges.org/grads.
- Hahn GL, Mader TL, Eigenberg RA. 2003. Perspective on development of thermal indices for animal studies and management. EAAP Technic Ser. 7:31–44.
- Hansen PJ, Aréchiga CF. 1999. Strategies for managing reproduction in the heat-stressed dairy cow. J Anim Sci. 77(2):36–50.
- Macciotta NPP, Biffani S, Bernabucci U, Lacetera N, Vitali A, Ajmone-Marsan P, Nardone A. 2017. Derivation and genome-wide association study of a principal component-based measure of heat tolerance in dairy cattle. J Dairy Sci. 100:4683–4697.
- Maracchi G, Sirotenko O, Bindi M. 2005. Impacts of present and future climate variability on agriculture and forestry in the temperate regions: Europe. Climatic Change. 70:117–135.
- Nardone A, Ronchi B, Lacetera N, Ranieri MS, Bernabucci U. 2010. Effects of climate change on animal production and sustainability of livestock system. Livest Sci. 130:57–69.
- NOAA. 1976. Livestock hot weather stress. Regional Operations Manual Letter C-31-76. National Oceanic and Atmospheric Administration. US Govt. Printing Office, Washington, DC.
- Olesen JE, Bindi M. 2002. Consequences of climate change for European agricultural productivity, land use and policy. Euro J Agronomy. 16:239–262.
- Özkan Ş, Vitali A, Lacetera N, Amon B, Bannink A, Bartley DJ, Blanco-Penedo I, de Haas Y, Dufrasne I, Elliott J, et al. 2016. Challenges and priorities for modelling livestock health and pathogens in the context of climate change. Environ Res. 151:130–144.
- Perini L, Beltrano MC, Dal Monte G, Esposito S, Caruso T, Motisi A, Marra FP. 2004. Atlante Agroclimatico - agroclimatologia, pedologia, fenologia del territorio italiano. Roma (Italy): UCEA. (in Italian).
- R Core Team. 2012. R: A language and environment for statistical computing. Vienna (Austria): R Foundation for Statistical Computing. ISBN 3-900051-07-0. www.R-project.org [accessed 2013 Feb 3].
- Scoccimarro E, Gualdi S, Bellucci A, Sanna A, Fogli PG, Manzini E, Vichi M, Oddo P, Navarra A. 2011. Effects of tropical cyclones on ocean heat transport in a high resolution coupled general circulation model. J Climate. 24:4368–4384.
- Segnalini M, Nardone A, Bernabucci U, Vitali A, Ronchi B, Lacetera N. 2011. Dynamics of the temperature-humidity index in the Mediterranean basin. Int J Biometeorol. 55:253–263.
- SIAN. 2013. Sistema Informatico Agricolo Nazionale. [accessed 2013 Apr 5]. http://www.sian.it/portale-sian/home.jsp.
- Tomozeiu R, Pasqui M, Quaresima S. 2018. Future changes of air temperature over Italian agricultural areas: a statistical downscaling technique applied to 2021–2050 and 2071–2100 periods. Meteorol Atmos Phys. 130:543–563.
- Williams R, Scholtz MM, Neser F. 2016. Geographical influence of heat stress on milk production of Holstein dairy cattle on pasture in South Africa under current and future climatic conditions. SA J An Sci. 46:441–447.
- WMO. 2007. Guide to the Global Observing System. WMO Publisher No. 488. Geneva. ISBN 92-63-13488-3.
- WMO. 2017. Guidelines on the Calculation of Climate Normals. WMO Publisher No. 1203. Geneva. ISBN 978-92-63-11203-3.