
 ?Mathematical formulae have been encoded as MathML and are displayed in this HTML version using MathJax in order to improve their display. Uncheck the box to turn MathJax off. This feature requires Javascript. Click on a formula to zoom.
Abstract
Grana Padano (GP) and Parmigiano Reggiano (PR) are the two most important Italian PDO cheeses. To improve the environmental sustainability of their production, a Life Cycle Assessment (LCA) was completed on 84 dairy farms located in the province of Mantova (Northern Italy). In particular, 33 farms delivered milk for GP production, whereas 51 farms to dairies for PR production. In GP farms, maize silage represented 33.7% of total farmland and alfalfa represented 28.1%. While in PR farms, alfalfa represented 63.6% of total farmland. Fat and Protein Corrected Milk (FPCM) and Dairy Efficiency (DE, calculated as kg of produced FPCM per kg of DM intake) were different in the two production system: FPCM was 30.2 ± 4.32 kg/d in GP farms and 25.0 ± 4.71 kg/d in PR farms; DE was 1.35 ± 0.26 in GP farms, and 1.15 ± 0.22 in PR farms. Mitigation strategies to improve both environmental and economic sustainability were suggested focussing on forage crop production, milk production, herd management and off-farm purchased feed. From the preliminary results, there is evidence that improvements are needed. Climate Change (kg CO2 eq/kg FPCM) and Land Use (kg Carbon deficit/kg FPCM) were similar (1.38 ± 0.33 and 19.3 ± 7.08 for GP system; 1.46 ± 0.37 and 21.8 ± 11.4 for PR system). The most efficient farms in terms of milk production and DE generally showed the best environmental and economic sustainability, while the others show worse outcomes, mainly due to poor DE, livestock-management issues, feed purchase and ration composition.
84 farms producing milk for Grana Padano and Parmigiano Reggiano cheese were studied in the Province of Mantova.
Life Cycle Assessment was used to quantify the environmental impacts of farms and statistical analysis was helpful to identify 6 clusters.
Farm, animal and milk efficiencies were poor and mitigation strategies to improve the sustainability of milk production were suggested.
Highlights
Introduction
Grana Padano and Parmigiano Reggiano cheeses are the two most important dairy products of Protected Designation of Origin (PDO) in the Italian agri-food context. Their production has a huge market impact because they are among the most exported Italian agri-food products worldwide (Bava et al. Citation2018). In 2017, 190,353 tons of Grana Padano (GP) and 147,125 tons of Parmigiano Reggiano (PR) were produced in Italy. Both of them together represent 74.3% of the total Italian PDO cheese production and show an annual average revenue from their export equal to 734 €/ton (CLAL Citation2019). The same trend is confirmed for 2018, with +0.11% and +0.39% tons of GP and PR produced, respectively. The production chains of GP and PR are quite complex and involve several stakeholders and producers that contribute to the environmental and economic sustainability of these cheeses. Being PDOs, production disciplinary that direct the production processes are present, and compulsorily affect production factors and managerial choices of farmers and producers.
The dairy farming context is quite complex and characterised by several driving forces; therefore, several farms must be investigated to get statistically relevant information about the local milk production system (Guerci et al. Citation2013; O’Brien et al. Citation2015; Zucali et al. Citation2018). This complexity supports the need of detailed primary data for achieving reliable environmental results (Lovarelli and Bacenetti Citation2017). In particular, agricultural and livestock processes highlight the biggest difficulties in data collection mainly because of the sector’s intrinsic variability: seasonality, dependence on natural systems and local pedo-climatic features (Lovarelli et al. Citation2018; van der Werf et al. Citation2014) as well as complexity of the herd composition and management, feed self-production and purchase, ratio equilibrium and animal health (Bava et al. Citation2014; Conte et al. Citation2018).
In this context, efficiency improvements for dairy farms, animal management and animal feeding are key aspects for the mitigation of the environmental impacts associated with dairy farming (de Boer et al. Citation2011; Mostert et al. Citation2018), other animal productions (Berton et al. Citation2018; Vellinga et al. Citation2011) and crops production for feed purposes (Tuomisto et al. Citation2012; Zucali et al. Citation2018). In a literature review by Baldini et al. (Citation2017), authors investigated recent studies on Life Cycle Assessment of milk production showing that there is still need of consistency in the assumptions and in the investigated inventory data in order to bring to comparability among studies. Additionally, the complexity behind agricultural activities makes difficult to identify straightforwardly improvable aspects (Vellinga et al. Citation2011). Among these, for example, the environmental benefits must be associated with economic ones in order to identify effective viable improvements (O’Brien et al. Citation2015).
In this study, the aim is to evaluate the performance of dairy farms producing milk to be transformed in GP and PR cheeses focussing on the environmental point of view. The dairy farms are analysed in the province of Mantova (Northern Italy), which represents about 10% of the area of Lombardy region. Dairy farms in Lombardy in 2018 delivered over 5,215,000 tons of milk, corresponding to 43.2% of the Italian milk production. Of this amount, Mantova province contributed with a share of 18.9%, representing the third province in Lombardy as delivered milk (CLAL Citation2019). The studied dairy farms were investigated adopting the Life Cycle Assessment (LCA) method to quantify the environmental impact of every farm and promote mitigation strategies for a more sustainable milk production pathway. Additionally, a statistical analysis was performed to identify the production models with a sustainable behaviour on the environmental and livestock management issues.
Materials and methods
Collected data on 84 farms were used to perform an LCA study and, subsequently, statistical analysis was performed to identify a relationship among dairy farms’ issues and their environmental behaviours.
Life cycle assessment method
In the following sections, the specific steps of the LCA study are described in agreement with ISO 14040 series (Citation2006).
Goal
LCA is applied to quantify the environmental impact of milk production on the analysed farms and to investigate the possible improvements for making this system more environmentally efficient, still respecting the Production Disciplinary for GP and PR cheeses.
Functional unit and system boundary
The selected Functional Unit (FU) for the analysed farms is 1 kg of Fat and Protein Corrected Milk (FPCM) (4% fat and 3.3% protein) produced by milking cows. This is a key choice for gathering effective and comparable results (Danieli and Ronchi Citation2018), and agrees with several studies about milk production (Bacenetti et al. Citation2016; Dalla Riva et al. Citation2017; Gollnow et al. Citation2014) as well as with the recommendation by IDF (Citation2015) which is also internationally adopted for standard decision-making on milk issues.
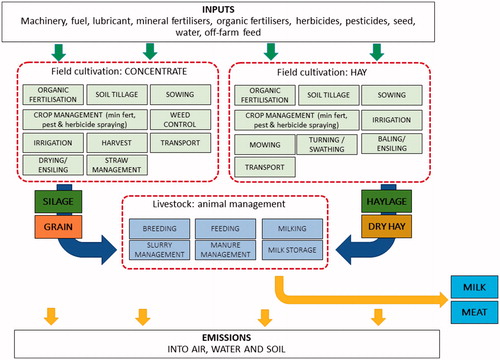
This assessment has a ‘cradle to farm gate’ approach. In the system boundary are included all inputs (e.g. machinery, fuel, lubricant, organic and mineral fertilisers, pesticides, water, off farm feed and bedding) and outputs (emissions to air, soil and water) for the production of milk and meat, as reported in Figure .
Figure 1. System boundary that describes the farm system was analysed and inputs and outputs were taken into account in LCA.
Description of the system and inventory data collection
During 2017, 84 dairy cattle farms, representative of GP and PR sector, were investigated through questionnaires to farmers exploring data about year 2016. All farms are located in the Province of Mantova, where a temperate climate is present, with an average yearly temperature equal to 13.0 °C (ranging from 1.9 °C in January and 23.6 °C in July); rainfall is 797 mm and is quite homogeneously distributed during the year (on average, higher rainfall is observed in autumn) (ARPA, Citation2016).
The analysed farms sell milk to eight dairies, of which four produce Grana Padano (GP) and four produce Parmigiano Reggiano (PR). In particular, 33 of the 84 farms sell milk to dairies for GP production, whereas 51 farms sell milk to dairies for PR production. This involves that the farms respond to two different cheese production disciplinary characterised by different production choices that affect, mainly, farm organisation for field cultivation and milk production.
All data were collected during surveys on farms carried out by experts by asking farmers for information about
field production (e.g. cultivated crops, area and yields, cultivation practices, inputs such as fertilisers, water, machinery);
herd management (e.g. number of animals, types of animals, purchasing/selling of animals);
milk production (e.g. milk yield, milk quality, protein and fat content);
feeding (e.g. type and quality of feed, cultivated and purchased feed);
manure and slurry management (e.g. availability of manure and/or slurry, storing system, distribution system on field, time and technology adopted for the distribution);
infrastructure of the dairy farm (e.g. cattle housing, milking parlour, slurry and manure storage).
Information collected through questionnaires was analysed and inventory data were introduced in the SimaPro® software (PRé Consultants Citation2016). Considering the cultivated crops on farm, the whole cropping system inclusive of all field operations (with the specific inputs and outputs for field cultivation) was analysed. In addition, all purchased feed and bedding was introduced considering transport distances on every farm, as well as the quantified emissions related to field cultivation, animal ruminal activity and manure and slurry storage and distribution. Electricity, methane, liquefied petroleum gas (LPG) and diesel fuel were also considered in accordance with the declarations from questionnaires about the energy use on farm.
More in details, emissions from the application of Nitrogen (N) and Phosphorus (P) fertilisers, the IPCC method (IPCC Citation2006a, 2006b) was adopted. Following this method, ammonia (NH3), nitrous oxide (N2O) and nitric oxide (NO) were quantified per farm by considering the cultivated area, the amounts of mineral fertilisers and slurry and/or manure spread on fields. Similarly, phosphate (PO4) emissions were quantified following Nemecek and Kägi (Citation2007). With regard to organic fertilisers, also the storage emissions were assessed by considering the number and type of animals present on farm, the type of fertiliser (slurry and/or manure) and specific emission factors for methane (CH4), NH3 and NO. Finally, animals’ emissions were quantified (CH4 and N2O) considering the number and type of animals as well as the chemical composition and nutritive value of the feed rations analysed with CPM Dairy®, following Moraes et al. (Citation2014). According to this method, dry matter intake (DMI; kg DMI) is the main driver of CH4 emissions from ruminal fermentation (Pirlo and Carè Citation2013).
Background data for the production of seeds, diesel fuel, methane and LPG, fertilisers and pesticides, and for the production, maintenance and disposal of capital goods such as tractors and machines were obtained from the Ecoinvent v.3 database (Weidema et al. Citation2013). Farm structures and milking parlour construction, maintenance and disposal were excluded from the analysis, also in accordance with IDF (Citation2015) and the application rules defined with the recent Product Environmental Footprint Category Rules (PEFCR) for dairy products (EDA Citation2018).
Field production system
Table reports information about the total cultivated area and the percentage of cultivated crop on the total area. In particular, farms that produce milk for GP cheese production, having the possibility to feed animals with silage crops, are characterised by 33.7% of the total cultivated area dedicated to maize for silage, followed by alfalfa hay (28.1% cultivated area) and wheat mainly harvested as hay (9.5% cultivated area). Differently, farms that produce milk for PR cheese production are subject to the production disciplinary that forces them to feed cows without crop silages, thus the most cultivated crop is alfalfa hay (63.6% area). This, in fact, allows farmers to produce hay with a good protein content and to reduce the need of purchasing protein-rich feed. The other cultivated crops are wheat (11.1% of area, commonly harvested as hay) and maize for silage (7.2% of area) that, however, is commonly sold.
Table 1. Main inventory data about the on-farm field cultivation area. The sum of the land area dedicated to each crop is given as absolute value (ha) and as percentage of the total area of farms analysed in the study.
In general, farms producing milk for PR cheese are characterised, on average, by higher cultivated area per farm respect to those producing milk for GP. This is mostly due to the need of achieving a good level of feed self-sufficiency considering that crop silages are forbidden on PR farms. On GP farms, instead, farmers can select a double cropping system (about 35.5% of cultivated area) by cultivating both winter and summer crops maximising the feed self-sufficiency even with a reduced cultivated area.
Herd composition, milk production and feeding ration
In Table , is reported the average herd composition and milk production of farms, and data are grouped per cheese production system. In particular, all data show higher values in farms for GP cheese production respect to those for PR cheese production, except for the individual daily DMI that is related to the composition of the feed ration of dairy cows. Given the feed ration, individual milk production is higher for cows in the farms producing for GP respect to those for PR (30.2 and 25.0 kg FPCM/d per cow in GP and PR farms, respectively), and a similar trend occurs with Dairy Efficiency (DE, kg FPCM/kg DMI).
Table 2. Main inventory data about herds and milk production.
Manure and slurry management
The availability and the management of manure and slurry are among the most critical issues. Commonly, in major part, manure and slurry were spread on field in spring and autumn, whereas only a low number of farms was characterised by the absence of manure (5%). Nevertheless, all farms purchase cows’ bedding, using straw (89%), sawdust (14%) and maize straw (5%) depending on the specific farm management and livestock organisation. In particular, solid floor was registered on more than 80% of dairy cows’ structures, while grilled floor was found in less than 10%. The most adopted solutions for manure and slurry management in solid floor for lactating cows were bunks (71%) and permanent litter (10%), whereas for dry cows it was 45% and 41%, respectively. Transport distances of the purchased bedding are included within the range of 5–50 km. On two farms, a ferti-irrigation system was available.
Allocation
Allocation was calculated for every farm in accordance with IDF (Citation2015) as shown in the following equation:
(1)
(1)
where MT is the mass of live weight (kg); ML is the mass of fat and protein corrected milk (kg).
The average allocation value for milk in the studied farms was 81.2% (±7.3%) for those producing milk to GP and 83.3% (±10.3%) for those producing milk to PR.
Impact assessment
The following environmental impact categories were considered by using the ILCD characterisation method (ILCD Handbook Citation2011): Climate Change (CC, kg CO2 eq), Photochemical Oxidant Formation (POF, kg NMVOC eq), Acidification (TA, molc H+ eq), Freshwater Eutrophication (FE, kg P eq), Marine Eutrophication (ME, kg N eq), Terrestrial Eutrophication (TE, molc N eq), Land Use (LU, kg carbon deficit), and Mineral, Fossil and Renewable resources Depletion (MFRD, kg Sb eq).
Farm nutrients balances
For the evaluations about farms’ efficiency in using N and P nutrients, the following features were considered with the aim of assessing the farm balance of N and P as difference between incoming and outgoing N and P sources.
To quantify farm N balance, the purchased inputs (kg/ha) were feed, N fertilisers, bedding, animals, and N deposition and fixation on field; the outputs considered the sold amounts (kg/ha) of: feed/crops, slurry/manure, animals and delivered milk. Except for deposition and fixation, the same inputs and outputs were adopted for farm P balance. Both farm balances were quantified considering the related N and P composition of all inputs and outputs.
Economic indicator
On every farm, the Income Over Feed Cost (IOFC) expressed as €/d per milking cow was calculated. This indicator gives information about the farm income due to the selling of FPCM net of the costs related to the ration. In more details, IOFC is calculated as difference between the income from the selling of milk (€/d per milking cow) and the cost from the daily ration (€/d per milking cow).
Methods for the statistical analysis
Statistical analysis was performed using SAS 9.4 (SAS Citation2012, SAS Inc., Cary, NC).
Principal components analysis (PCA) was carried out to show the multiple relations between the new components. Then, with the most relevant variables identified through Factor Analysis and PCA, a cluster analysis was performed with the ‘average’ method, considering Climate Change (CC) from LCA the only impact category included.
To analyse the fixed effect of cluster class a General Linear Model analysis (proc GLM) was performed on impact categories by a model with cheese production system (n = 2), dairy (n = 8) and cluster group (n = 6) as fixed effects.
Results
Results of the environmental assessment
LCA results were quantified for every farm and were then grouped per dairy (4 to GP and 4 to PR) and, finally, per cheese typology (GP and PR).
Table shows the average environmental impact of milk production of the 33 farms producing milk further sold to the four dairies for GP cheese production and their average. Instead, Table shows these values for the four dairies that transform milk in PR cheese. From these results, it can be highlighted that there are noticeable differences among dairies, although not significantly. In particular, focussing on CC the highest values are gathered in GP2, PR2 and PR4. For them, the reason is mostly due to the fact that in these dairies the average (i) number of lactating cows (67, 65 and 79, respectively, for GP2, PR2 and PR4), (ii) milk production per cow (23.7, 24.2 and 24.4 kg FPCM/d, respectively), and (iii) land area (25, 43 and 36 ha, respectively) are very low compared to the other dairies. This means that farms selling milk to these three dairies are, on average, quite small, have inefficient milk production and need purchasing considerable amounts of feed that deeply worsen the environmental outcomes.
Table 3. Average environmental impact of 1 kg FPCM produced by the farms that sell milk to each of the four dairies for GP cheese production.
Table 4. Average environmental impact of 1 kg FPCM produced by the farms that sell milk to each of the four dairies for PR cheese production.
The most sustainable dairies, instead, are GP1 and GP4 that are characterised by
the best DE which is 1.34 and 1.47 in GP1 and GP4, respectively,
the highest FPCM production per cow (28.5 and 31.7 kg FPCM/d per cow in GP1 and GP4, respectively),
the highest production self-sufficiency (on average 82% and 65%, respectively),
number of lactating cows and cultivated area within the average for GP dairies.
Additionally, these farms also show the highest IOFC (on average 12.8 and 15.3 €/d per cow, respectively).
Results from the statistical analysis
Factor analysis identified three factors (eigenvalues >1) that explained 70% of the variation in the results. Separately per factor, the correlations were used to label the factors with a farming strategy. Factors 1, 2 and 3 (Table ) were labelled ‘Climate Change and efficiency’, ‘Livestock Units’ and ‘Farm size and animal intake’.
Table 5. Results of the factor analysis. In bold are reported the loading values with the main relevance on the factors (>0.6 as absolute value).
All variables in the factor analysis with a loading value >0.6 were found in only one factor, except for the land area in which both factors 1 and 3 contributed −0.63 and 0.65, respectively.
The first factor, named ‘Climate Change and efficiency’ was characterised by highly positive loading values in terms of CC and animal emissions from rumen fermentation, and it was also characterised by highly negative ones in terms of DE (kg FPCM/kg DMI) and of the delivered milk per lactating cow (kg/d). This means that increasing animal emissions involves increasing importantly the CC, whereas increasing DE and milk production involves important reductions in CC. Regarding factor 2, named ‘Livestock Units’, the main positive loading values consist in the stocking rate defined by the livestock units (LU/ha) and in N and P farm balances. Factor 3, named ‘Farm dimension and animal intake’, instead, was characterised by positive loading values related to DMI (kg DMI/d), number of cows (n) and land area (ha).
Figure shows PCA. As expected and already gathered from factor analysis, components 1 and 2 highlight that CC is closely related to animal and field emissions and that number of cows, milk production, DMI and DE are closely related. For the components 1 and 3, the relation is close among emissions from field, animals and storage, CC, N and P farm balances and the purchased feed. In addition, also the number of cows and the field area are closely related (Figure – middle).
Figure 2. Results of the PCA analysis with three components.
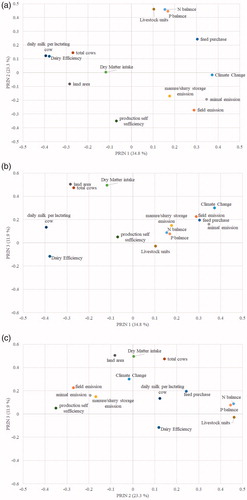
For the components 2 and 3, the relation is close among emissions from field, animals and storage and self-sufficiency, while CC is closely related with the field area and the DMI (Figure – bottom).
From the cluster analysis, six main clusters were defined and consisted of farms with similar characteristics. The variables adopted for building clusters are reported in Table , where are also shown mean and standard deviations values per cluster of these variables.
Table 6. Means and standard deviations for the main variables that define the six clusters.
The worst DE is gathered from clusters 1 and 4. Cluster 1 is characterised by the lowest number of cows and production self-sufficiency with cultivated crops; moreover, it has quite high stocking rate meaning that the farm area is restrained. Cluster 4, instead, is characterised by a reduced stocking rate and a very high production self-sufficiency. This means that these farms in cluster 1 and 4 need an important improvement for DE. Cluster 1 has 21.4% of farms from GP cheese system, while Cluster 4 has 62.5% from GP cheese system.
Clusters 5 and 6 have the highest DE values, the biggest dimensions (high number of cows and stocking rate) and an average self-sufficiency (57–63%). These are the most efficient and well-organised farms. The remaining clusters 2 and 3 include mean performing farms, where improvements can also bring to beneficial effects.
Table shows least square means for the studied variables following the groups derived from cluster analysis. The number of observations present in each cluster informs about the number of farms included in each cluster. Except for N and P farm balances, the derived model shows statistical significance. Contrasts were also calculated reporting: (i) contrast of clusters 1, 2, 3 respect to 4 (thus excluding the two best clusters), (ii) contrast of clusters 5 and 6 respect to 4 (thus considering the two best ones respect to the worst) and (iii) contrast of all clusters respect to number 4. Almost all contrasts are statistically significant.
Table 7. Results of GLM with LSMEANS values per farm characteristics.
Table shows least square means for the environmental impact categories considered and following the division in the six clusters. The model shows statistical significance for 5 of the 8 impact categories.
Table 8. Results of GLM with LSMEANS values per impact category.
Also from these values, it results that cluster 4 shows the worst behaviour for most of the variables. In particular, it has the worst least square mean values for all the 8 studied environmental impact categories, the lowest values in terms of IOFC, FPCM per cow, and FPCM per ha. Moreover, it has the highest percentage of forage in the ration (>62%) and the lowest N and P balances. This cluster is composed of the smallest and least efficient farms; 62.5% of the eight farms of this cluster produce milk to GP cheese production. These outcomes are also in line with the findings described in Section 3.1.
In cluster 5, instead, are included 10 among the best farms for six of the eight environmental impact categories (CC, POF, FE, ME, LU and MFRD). Also for FPCM per ha, it has the best outcomes. However, cluster 5 is quite similar and close to cluster 6, which includes as well good performing farms in terms of land area, IOFC and FPCM per cow. Therefore, in these two clusters are present the most efficient and sustainable dairy farms (i.e. 18 farms in total), half of which produce milk to GP and half to PR cheeses.
Together with cluster 4, cluster 1 is one of the groups in which considerable improvements should be achieved. In particular, cluster 1 is the most numerous (28 observations). Among them, 21.4% are farms producing milk for GP cheese, while the remaining 78.6% produce milk for PR. This cluster is characterised by mean values of farms with the worst DE (1.06 kg FPCM/kg DMI) and second worst IOFC (7.04 €/d per cow), the lowest number of cows (44.3 cows) and land area (16.5 ha). Moreover, the worst least square mean values for N and P balances and average production self-sufficiency are present. In this case, double cropping is 3.9% of the land area, which is supported by the fact that most farms belong to PR production (i.e. most land area dedicated to alfalfa and pluri-annual hay crops).
From these analyses, it emerges that clusters to which paying the highest attention are cluster 1 and 4, followed by clusters 2 and 3. For cluster 1, the most important steps regard introducing productive improvements (i.e. balanced feed ration) that bring to environmental mitigation strategies for most farms producing milk for PR cheese production, which is also widely recognised as a production system with an inescapable lower efficiency respect to other systems (mainly because of the production disciplinary). The attention to the feed ration for cows should bring improvements to DE and FPCM production, although an unavoidable drawback is linked intrinsically to the reduced farm dimensions. For cluster 4, instead, farms producing milk for both GP and PR are present, which means that also a group of farms for GP cheese production is inefficient and should be improved considerably, at least in terms of DE and FPCM as well as of all environmental impact categories. Moreover, cluster 2 and partially cluster 3 behave better than 1 and 4, but their results are also affected by the low farm dimension (with a reduced number of cows and land area).
Finally, from the LCA study were identified the hotspot processes of dairy farms. By grouping the farms in accordance with the results of cluster analysis, Figures report the environmental hotspots per cluster for 4 of the assessed impact categories (CC, FE, LU and MFRD).
Figure 3. Hotspot processes of every cluster to CC impact category. All processes included in the study are reported in the legend.
CC: climate change.
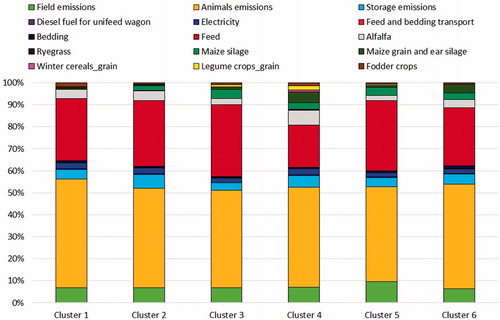
Figure 4. Hotspot processes of every cluster to FE impact category. All processes included in the study are reported in the legend.
FE: freshwater eutrophication (kg P eq).
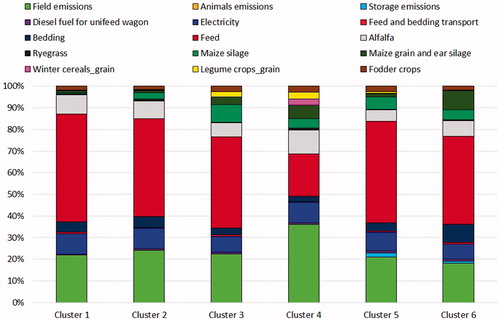
Figure 5. Hotspot processes of every cluster to LU impact category. All processes included in the study are reported in the legend.
LU: land use (kg carbon deficit).
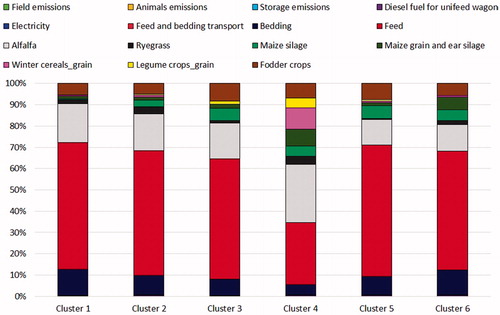
Figure 6. Hotspot processes of every cluster to MFRD impact category. All processes included in the study are reported in the legend.
MFRD: mineral, fossil and renewable resources depletion (kg Sb eq).
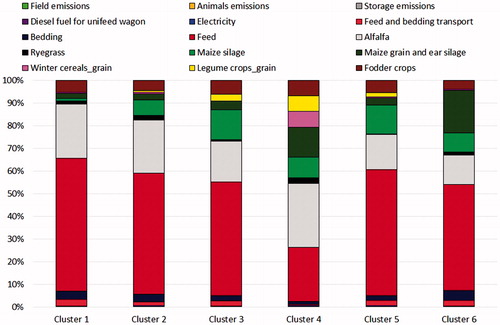
The main hotspots represent the processes to which paying the highest attention for achieving improvements in the environmental sustainability. In particular, the contribution of every process to the environmental impact of each category and cluster differs, but the highest attention should be paid to (i) emissions deriving from field practices, animal rumen fermentation and manure and slurry storage, (ii) feed rations and (iii) alfalfa cultivation.
In particular, on CC, animal emissions (mostly due to the CH4 produced during ruminal activity) and feed purchase (due to the use of inputs such as diesel fuel, machinery, fertilisers and pesticides and to the feed transport) are the most important hotspot processes contributing to the environmental impact of 1 kg FPCM. Animal emissions contributed from 43% to 49% to CC, respectively, for clusters 5 and 1. Feed purchase, instead, contributed to CC between 19% and 33%, respectively, for clusters 4 and 3.
On FE (and also on ME even if not shown graphically), field emissions (FE: 18–36%, respectively, in clusters 6 and 4) and the feed purchase (FE: 20–50%, respectively, in clusters 4 and 1) are prominent due to the released nutrients during the cultivation. Instead, on TE and TA the storage emissions together with field and animal emissions are the main responsible of the environmental impact.
On LU and MFRD, the main contributors are the feed purchase (LU: 29–62%, respectively, for clusters 4 and 5; MFRD: 24–59%, respectively, for clusters 4 and 1) followed by alfalfa cultivation (between 12% and 28% for both categories, with the lower values for clusters 5 and 6 and the higher values for cluster 4). In this case, soybean produced in Latin America has a deep role on land use and the use of resources. Similarly, the feed purchase was the most important hotspot also on POF (not shown graphically) (26–52% of the impact, respectively for clusters 4 and 1) followed by animal emissions (<15% for all clusters). Diesel fuel for the diet feeder, electricity, transport of feed and bedding as well as other crops cultivated on field (ryegrass, winter cereals, legumes and fodder crops) never represent hotspot processes (with contributions <10%). The bedding purchase is never hotspot but its contribution is not negligible (5–12%) on LU. A similar condition occurs for maize cultivation (<19%) on the category MFRD.
Among the analysed clusters, the most evident differences can be gathered from cluster 4 that shows different trends mainly for CC, FE, LU and MFRD (and even if not reported graphically also for ME and POF). These differences are connected with the low efficiencies of the dairy farming systems and with the small farm dimensions, according to which a small change in the processing can make bigger differences in the contribution analysis.
Discussion
The environmental outcomes of the 84 analysed farms showed mean values consistent with literature findings and with the relation between environmental sustainability and dairy farm efficiency (Pirlo Citation2012; Guerci et al. Citation2013; Zucali et al. Citation2016). Average lower values for CC (1.11 ± 0.22 kg CO2 eq/kg FPCM) were found in Gollnow et al. (Citation2014) for Australian dairy milk production but different methodological choices may have affected this result. On average, farms producing milk for PR production have a higher environmental impact respect to those producing milk for GP production (for CC, 1.455 ± 0.374 kg CO2 eq/kg FPCM respect to 1.379 ± 0.325 kg CO2 eq/kg FPCM of GP farms). In few small farms, the environmental outcomes were unexpectedly high, but the reason is related to the uncommon allocation values (>90% of the impact attributed to FPCM) and low farm efficiencies that resulted in low milk production (<23 kg FPCM/d).
The common characteristics of farms were identified through the grouping in the cluster analysis. This allowed identifying that worse performing farms have inefficient dairy farming (low milk production, unbalanced rations, reduced land area). Cluster 4 (defined as the worst performing cluster) includes farms with the worst farm efficiency among which both PR and GP farms are included. Therefore, the production disciplinary is not the main cause of cows’ inefficiency. Instead, the complete dairy farm organisation can make the difference. In particular, from this analysis the economy of scale resulted being one of the main drivers affecting dairy and farming efficiencies, as well as the environmental and economic sustainability. From the results, this is gathered by Factor analysis and PCA from which emerged that improving DE allowed reducing CC while the increase in emissions and purchased feed negatively affected CC. Stocking rate and N and P farm balances, instead, are closely related, and at their increase also emissions and CC increase. However, at higher stocking rate, higher DE is achieved, showing more intensity in farming and, consequently, also the possibility to improve farm sustainability. Similar findings were found in O’Brien et al. (Citation2015) in regard of milk productivity and purchased feed, in Bava et al. (Citation2014) in regard of stocking rate and intensive farming, and in Vellinga et al. (Citation2011). This last also reported some general mitigation strategies suggesting that they are commonly farm-specific and that farmers usually adopt mitigation solutions that are simple, cost effective or with relatively small additional costs. However, they also reported that 25–30% of CC impact reduction is an achievable result.
Pirlo and Carè (Citation2013) specifically developed a tool for estimating the carbon footprint of milk production immediately proposing mitigation strategies to improve milk sustainability. Again similar to this study, animal and storage emissions and feed purchase played the major role on CC impact category, as observed also in Gerber et al. (Citation2013) and Zucali et al. (Citation2016). Additionally, also decreasing the unproductive period (i.e. heifers calving period) could help in reducing the environmental and economic costs allocated to milk production, as well as lameness (Mostert et al. Citation2018). With regard to crops cultivation, crop management is very important, but pest control and irrigation resulted among the least practised operations on the studied farms, both of which should be practised for better yield (Bacenetti et al. Citation2018). Moreover, although being important to analyse the whole cheese production chain, in this study the focus was on milk production (farm gate) because of its prominent role respect to the transformation; this is in accordance with other studies such as Dalla Riva et al. (Citation2018) on Asiago PDO and Bava et al. (Citation2018) on Grana Padano PDO. Although in this study the differences between production disciplinary of GP and PR emerged in regard of the farm choices, they did not represent the main driver for environmental sustainability. Instead, farm efficiency and managerial choices are the most affecting, as also reported in de Boer et al. (Citation2011) and Gaudino et al. (Citation2014).
Several are the mitigation strategies to be introduced for improving the environmental sustainability of milk production. In fact, the results of both LCA and statistical analysis are straightforward in highlighting that emissions from enteric fermentation, spreading of fertilisers on field and storage of slurry and manure, together with feed purchase deeply affect all environmental impact categories. In regard to cattle management, the most important variables to be improved are milk production, feed self-sufficiency, feed composition and ration balance. Their increase permits to achieve good FPCM and DE partially using home-grown crops and possible alternative purchased feed with a higher environmental sustainability (for example, reducing the use of imported soybean – characterised by a strong impact due to cultivation, land use change and transport – and increasing other oil/protein crops such as sunflower cultivated locally). These strategies permit reducing the impact on climate change, acidification, eutrophication, land use and energy and resources use as well as increasing the IOFC (€/d per cow). Additionally, even if not much attention was paid on this issue in this study, improved techniques for storing and spreading on field slurry and manure should be considered. This permits to reduce NH3 emissions to air (Provolo et al. Citation2018) as well as NO3 and PO4 leaching and runoff, which affect particulate matter formation, acidification and eutrophication impact categories. Positive effects on the same categories can be achieved improving crops production, especially that of alfalfa, which is widely cultivated (i.e. 28.1% and 63.6% in GP and PR farms, respectively).
Although these strategies can be quite common, they allow achieving good results on both the environmental and the economic sides and this is supported by the cluster analysis from which clear distinctions emerged between efficient and inefficient farming systems.
Conclusions
In this study, a representative sample of farms of the Province of Mantova (Italy) was analysed permitting to make evaluations on the cultivation and livestock systems, as well as on the main contributors to the environmental impact of milk production of this important area for dairy farming. With this picture, extensively valid mitigation strategies can be suggested and potentially accomplished on a wide scale.
From the results, it emerges that there is a close relation between efficient farms and environmental sustainability, pointing out that efficient farms have the best environmental performances and income. Small farms with few cows, reduced land area and low production resulted negative options on the environmental and economic (IOFC) point of view, but improvements can be achieved by mitigating the effect of feed ration and composition.
With the identification of the relations among dairy farm variables and environmental impact, the results of this study permit to understand the direction towards which improving the efficiency of resource use, balanced feed intake and feed self-sufficiency, and finally increasing milk productivity and environmental and economic benefits. Moreover, they can help highlighting the importance of circular economy and of environmental assessment studies as tools that help make valid decisions. It is essential to go towards the direction of farming efficiency and dissemination of innovations to farmers, who represent the main drivers towards effective efficient changes on farms.
Acknowledgements
Authors would like to thank the expert technicians Sebastiano Buffa, Stefano Garimberti, Marco Bellini, Gabriele Caleffi and Daniele Longhi for the data collection and Consorzio Latterie Virgilio for the data contribution.
Disclosure statement
No potential conflict of interest was reported by the authors.
Additional information
Funding
References
- ARPA. 2016. Meteorological data. [Accessed 2019 Mar 14]. http://www.arpalombardia.it/siti/arpalombardia/meteo/richiesta-dati-misurati/Pagine/RichiestaDatiMisurati.aspx
- Bacenetti J, Bava L, Zucali M, Lovarelli D, Sandrucci A, Tamburini A, Fiala M. 2016. Anaerobic digestion and milking frequency as mitigation strategies of the environmental burden in the milk production system. Sci Total Environ. 539:450–459.
- Bacenetti J, Lovarelli D, Tedesco D, Pretolani R, Ferrante V. 2018. Environmental impact assessment of alfalfa (Medicago sativa L.) hay production. Sci Total Environ. 635:551–558.
- Baldini C, Gardoni D, Guarino M. 2017. A critical review of the recent evolution of life cycle assessment applied to milk production. J Clean Prod. 140:421–435.
- Bava L, Bacenetti J, Gislon G, Pellegrino L, D'Incecco P, Sandrucci A, Tamburini A, Fiala M, Zucali M. 2018. Impact assessment of traditional food manufacturing: the case of Grana Padano cheese. Sci Total Environ. 626:1200–1209.
- Bava L, Sandrucci A, Zucali M, Guerci M, Tamburini A. 2014. How can farming intensification affect the environmental impact of milk production? J Dairy Sci. 97:4579–4593.
- Berton M, Cesaro G, Gallo L, Ramanzin M, Sturaro E. 2018. Sources of variation of the environmental impact of cereal-based intensive beef finishing herds. Ital J Anim Sci. 17:767–776.
- *CLAL. 2019. Italy Milk Dairy Market. [Accessed 2019 Mar 14]. https://www.clal.it/?section=formaggi_dop; https://www.clal.it/?section=consegne_reg_it; https://www.clal.it/?section=riepilogo_istat
- Conte G, Ciampolini R, Cassandro M, Lasagna E, Calamari L, Bernabucci U, Abeni F. 2018. Feeding and nutrition management of heat-stressed dairy ruminants. Ital J Anim Sci. 17:604–620.
- Dalla Riva A, Burek J, Kim D, Thoma G, Cassandro M, De Marchi M. 2018. The environmental analysis of asiago PDO cheese: a case study from farm gate-to-plant gate. Ital J Anim Sci. 17:250–262.
- Dalla Riva A, Burek J, Kim D, Thoma G, Cassandro M, De Marchi M. 2017. Environmental life cycle assessment of Italian mozzarella cheese: hotspots and improvement opportunities. J Dairy Sci. 100:7933–7952.
- Danieli PP, Ronchi B. 2018. Developing a predictive model for the energy content of goat milk as the basis for a functional unit formulation to be used in the life cycle assessment of dairy goat production systems. Animal. 12:408–416.
- de Boer IJM, Cederberg C, Eady S, Gollnow S, Kristensen T, Macleod M, Meul M, Nemecek T, Phong LT, Thoma G, et al. 2011. Greenhouse gas mitigation in animal production: towards an integrated life cycle sustainability assessment. Curr Opin Environ Sustain. 3:423–431.
- EDA European Dairy Association. 2018. Product Environmental Footprint Category Rules for dairy products. [Accessed 2019 Mar 14]. http://ec.europa.eu/environment/eussd/smgp/pdf/PEFCR-DairyProducts_2018-04-25_V1.pdf
- Gaudino S, Goia I, Grignani C, Monaco S, Sacco D. 2014. Assessing agro-environmental performance of dairy farms in northwest Italy based on aggregated results from indicators. J Environ Manage. 140:120–134.
- Gerber PJ, Steinfeld H, Henderson B, Mottet A, Opio C, Dijkman J, Falcucci A, Tempio G. 2013. Tackling climate change through livestock – a global assessment of emissions and mitigation opportunities. Roma (Italy): Food and Agriculture Organisation of the United Nations (FAO).
- Gollnow S, Lundie S, Moore AD, McLaren J, van Buuren N, Stahle P, Christie K, Thylmann D, Rehl T. 2014. Carbon footprint of milk production from dairy cows in Australia. Int Dairy J. 37:31–38.
- Guerci M, Bava L, Zucali M, Sandrucci A, Penati C, Tamburini A. 2013. Effect of farming strategies on environmental impact of intensive dairy farms in Italy. J Dairy Res. 80:300–308.
- International Dairy Federation (IDF). 2015. A common carbon footprint approach for dairy. The IDF guide to standard lifecycle assessment methodology for the dairy sector. In the Bulletin of the IDF No 479/2010. International Dairy Federation, Brussels, Belgium.
- International Reference Life Cycle Data System (ILCD). 2011. Handbook- Recommendations for Life Cycle Impact Assessment in the European context, 2011. EUR 24571 EN. Luxemburg. Publications Office of the EU.
- IPCC. 2006a. Emissions from livestock and manure management. In: IPCC, Eggleston H, Buendia L, Miwa K, Ngara T, Tanabe K, editors. IPCC Guidelines for national greenhouse gas inventories. Volume 4: Agriculture, forestry and other land use. Chapter 10. Hayama, Japan: Institute for Global Environmental Strategies.
- IPCC. 2006b. N2O emissions from managed soils, and CO2 emissions from lime and urea application. In: IPCC, Eggleston H, Buendia L, Miwa K, Ngara T, Tanabe K, editors. IPCC guidelines for national greenhouse gas inventories. Volume 4: Agriculture, forestry and other land use. Chapter 11. Hayama, Japan: Institute for Global Environmental Strategies.
- ISO 14040 series. 2006. Environmental management – Life cycle assessment – requirements and guidelines. Geneva (Switzerland): International Organization for Standardization.
- Lovarelli D, Bacenetti J. 2017. Seedbed preparation for arable crops: environmental impact of alternative mechanical solutions. Soil Tillage Res. 174:156–168.
- Lovarelli D, Fiala M, Larsson G. 2018. Fuel consumption and exhaust emissions during on-field tractor activity: a possible improving strategy for the environmental load of agricultural mechanisation. Comput Electron Agric. 151:238–248.
- Moraes LE, Strathe AB, Fadel JG, Casper DP, Kebreab E. 2014. Prediction of enteric methane emissions from cattle. Global Change Biol. 20:2140–2148.
- Mostert PF, van Middelaar CE, de Boer IJM, Bokkers E. 2018. The impact of foot lesions in dairy cows on greenhouse gas emissions of milk production. Agric Syst. 167:206–212.
- Nemecek T, Kägi T. 2007. Life cycle inventories of agricultural production systems. Final Report Ecoinvent v2.0 No. 15aAgroscope FAL Reckenholz and FAT Taenikon. Swiss Centre for Life Cycle Inventories, Zürich and Dübendorf, Switzerland.
- O’Brien D, Hennessy T, Moran B, Shalloo L. 2015. Relating the carbon footprint of milk from Irish dairy farms to economic performance. J Dairy Sci. 98:7394–7407.
- Pirlo G. 2012. Cradle-to-farm gate analysis of milk carbon footprint: a descriptive review. Ital J Anim Sci. 11:109–118.
- Pirlo G, Carè S. 2013. A simplified tool for estimating Carbon Footprint of dairy cattle milk. Ital J Anim Sci. 12:497–506.
- PRé Consultants. 2016. SimaPro 8.4.0.0. Amersfoort (the Netherlands). LCA Software.
- Provolo G, Mattachini G, Finzi A, Cattaneo M, Guido V, Riva E. 2018. Global warming and acidification potential assessment of a collective manure management system for bioenergy production and nitrogen removal in Northern Italy. Sustainability. 10:3653.
- SAS 9.4 (TS1M3). 2012. SAS Inst. Inc. Cary, NC.
- Tuomisto HL, Hodge ID, Riordan P, MacDonald DW. 2012. Comparing energy balances, greenhouse gas balances and biodiversity impacts of contrasting farming systems with alternative land uses. Agric Syst. 108:42–49.
- van der Werf HMG, Garnett T, Corson MS, Hayashi K, Huisingh D, Cederberg C. 2014. Towards eco-efficient agriculture and food systems: theory, praxis and future challenges. J Clean Prod. 73:1–4.
- Vellinga TV, de Haan MHA, Schils RLM, Evers A, van den Pol–van Dasselaar A. 2011. Implementation of GHG mitigation on intensive dairy farms: farmers' preferences and variation in cost effectiveness. Livest Sci. 137:185–195.
- Weidema BP, Bauer C, Hischier R, Mutel C, Nemecek T, Reinhard J, Vadenbo CO, Wernet G. 2013. Overview and methodology. Data quality guideline for the ecoinvent database version 3. Ecoinvent Report 1(v3). St. Gallen: The Ecoinvent Centre.
- Zucali M, Bacenetti J, Tamburini A, Nonini L, Sandrucci A, Bava L. 2018. Environmental impact assessment of different cropping systems of home-grown feed for milk production. J Clean Prod. 172:3734–3746.
- Zucali M, Battelli G, Battini M, Bava L, Decimo M, Mattiello S, Povolo M, Brasca M. 2016. Multi-dimensional assessment and scoring system for dairy farms. Ital J Anim Sci. 15:492–503.