
Abstract
This study investigated the influence of different loading levels, cutting and mixing times on total mixed ration (TMR) homogeneity delivered along the feeding alley of dairy cows. The TMR homogeneity along the alley was investigated according to three mixing wagon loads (40, 70 and 100% of the nominal capacity), three cutting times (4, 5 and 6 min) and three mixing times (4, 5 and 6 min). The diet (70:30 forage/concentrate ratio) was supplied by a two-screws vertical mixing wagon (maximum nominal capacity, 21 m3). A preliminary variance analysis of chemical parameters was performed on samples collected in the mixing wagon: samples of released TMR were taken at the beginning, in the middle and at the end of the feeding alley (50 m long). The chemical parameters of the diet revealed no significant effects on the homogeneity of the samples for cutting time (p>.05). Mixing wagon loading affected crude protein (CP) (p < .05) and neutral detergent fibre (NDF) content (p < .01), while mixing time influenced dry matter (DM) of the diet (p < .05). The loading level of the mixing wagon affected the difference of the collected samples from the formulated diet for ash content. The 70% of the nominal capacity load of the mixing wagon showed the lower difference values between expected and chemically determined NDF (p < .01), CP (p < .05) and ether extract (EE) (p < .05) content in the diet. The DM and NDF differences along the alley, affected by mixing times (p < .05), showed a poor uniformity of ingredients during distribution, although samples uniformity at wagon level.
The efficiency of a two-screw vertical mixing wagon on total mixed ratio uniformity was evaluated on diet samples delivered along the feeding alley.
Three loading levels, three cutting and three mixing times were considered for the mixing wagon.
Mixing wagon loading affected CP and NDF content; mixing time influenced DM and NDF content at the delivery points.
Highlights
Introduction
The total mixed ration (TMR) system for dairy cows nutrition was introduced to provide a consistent supply of nutrients to rumen microbes, to optimise rumen function and improve the efficiency of nutrient utilisation, although in some circumstances it may not accurately reflect the formulated diet, slightly varying day by day (Sova et al. Citation2014). Together with the balance between the components of the diet to allow suitable rumen condition, the feed particle size distribution and the physical effectiveness of the diet lead to adequate rumination stimuli and intensity of rumen fermentation (Zebeli et al. Citation2011). In this view, TMR homogeneity and feed particle size distribution are of primary importance in dairy cow nutrition, but these elements are often subdued to the efficiency of the mixing wagon that actually can be limited by the loading level and cutting and mixing times among others factors (Buckmaster Citation2009a, Citation2009b).
TMR making is formulated to obtain a homogeneous and balanced ration for all the components in a single solution (Baumgard et al. Citation2017). This type of diet formulation forecasts the carrying out of an array of operating machines with the mixing wagon as most important machinery. The modern cutting-mixer wagons derive from the evolution of the first mixer wagons, from which they differ for the equipment for trimming long stemmed products (i.e. hay and straw), and mixing them with the other foodstuffs of the ration.
The simultaneous administration of all nutrients allows for greater stability of ruminal pH, hence increasing productive performance and health of dairy cattle, avoiding rumen acidosis (DeVries et al. Citation2005; Mäntysaari et al. Citation2006).
The basic assumption for obtaining the benefits associated with TMR rationing is the homogeneous mixing of foods. Non-uniform diets, from the nutritional and physical points of view, can affect the amount of feed assumption in the animals giving them the possibility to select foods with negative effects on their performance (Kmicikewycz et al. Citation2015). The characteristics of the cutting-mixing wagon and its rational use are the basis for a correct preparation of the ration.
The available literature reports studies about the efficiency of mixing wagons (Vegricht et al. Citation2007; Šístkova et al. Citation2015), mainly describing the procedure of loading, cutting and mixing adopted in the farm.
Nowadays, information about an ‘ideal combination’ of loading level, cutting and mixing times are still missing.
For the above described reasons, the aim of this trial was to determine the influence of different combinations of loading levels, cutting and mixing times on homogeneity of dairy cows TMR along the feeding alley.
Material and methods
Experimental design
The present trial was run in a dairy Friesian Holstein cow’s farm, 400 animals, with 180 lactating cows and 220 dry cows, heifers and calves.
The dairy farm is located in Lodi area (Northern Italy), an area strongly addressed to intensive animal production. The trial as been conducted in an ethical and responsible manner, in full compliance with all relevant codes of experimentation and legislation.
The study was carried out using a two-augers vertical type TMR mixing wagon (Grizzly 8100 model 8122/2, Sgariboldi, Codogno, Italy), with a nominal maximum capacity of 21 m3. The technical characteristics of the mixing wagon were the following: driveline reduction ratio 1:16, clockwise augers rotation and auger speed of 24 rpm (cutting) and 38 rpm (mixing).
The mixing wagon distributed TMR on the feeding trough at a uniform speed of 1.5 km/h. The experimental design was set up to account for the loading level of the mixing wagon (40, 70 or 100% of maximum nominal capacity), the cutting time of roughage after the load of long stemmed hay (4, 5 or 6 min.) and the mixing time of TMR after the load of the last ingredient (4, 5 or 6 min). Factors were combined during the 15-day trial, as reported in Table .
Table 1. Experimental design.
The feed loading sequence was the following: long-stem hay (cutting), corn meal, concentrate, silage and molasses. During the trial ingredients were drawn from the same bulks, silage humidity varied in a not significant way (CV less than 3%).
The TMR was formulated for 60 late lactating (more than 200 d in milk) Friesian Holstein cows, see Table .
Table 2. The TMR formulated by the nutritionist (TMR sampled in the mixing wagon).
Every day of the trial, the weight of every feed introduced was checked by positioning the mixing wagon on the weighbridge scale of the farm (±0.02 to 0.04% precision) to make a double check with wagon weigh precision.
Five TMR samples (200 g each) were collected for each day of the trial in five different points of the wagon hopper at the end of the cutting-mixing procedure, according to CE rule N. 152/2009, modified by Commission Regulation (Citation2013) rule.
Five TMR samples (200 g each) were collected from the beginning (0 m), in the middle (25 m) and at the end (50 m) of the feeding trough, as released diet and for every combination.
For each of the 15 d of the experimental study, 20 TMR samples (5 in the wagon and 15 in the 3 points along the alley) were collected, for a total of 300 samples to be analysed.
The chemical composition of each TMR samples was analysed to determine dry matter (DM) (method 930.15), crude protein (CP) (method 984.13), ether extract (EE) (method 920.39A), ash (method 942.05) and content following the relative Association of Analytical Communities official methods of analysis (AOAC, Citation2005). Neutral detergent fibre (NDF) was measured through Van Soest method.
The research was performed in full compliance with all relevant codes of experimentation and legislation.
Statistical analysis
A preliminary analysis of variance, a general linear model (GLM) procedure, of SAS statistical package version. 9.2, 2016 (SAS Institute, Cary, NC), was performed on the samples collected in the mixing wagon, to highlight potential de-mixing occurring in the wagon, after cutting and mixing, before feed release, for each day of the study. The sample was the experimental unit, for each sampling day. The obtained mean value was considered the reference for the TMR samples collected along the feeding alley, for the variance analysis described as follows.
The uniformity of the diet released along the alley was evaluated through variance analysis, GLM procedure, of SAS statistical package.
The following items i) loading level of the mixing wagon (100, 70 and 40% of maximum nominal capacity); ii) cutting time of roughage (4, 5 or 6 min.) and iii) mixing time of TMR (4, 5 or 6 min) were considered independent variables in the model, affecting TMR uniformity, or DM, CP, EE, NDF and ashes values differences of the samples collected at the feeding trough (5 samples at the beginning 0 m; 5 samples in middle 25 m; 5 samples at the end, 50 m) from respective chemical parameters of the formulated diet collected in the wagon.
The interaction loading level*cutting time*mixing time*sample point was considered in the model to evaluate the ‘ideal combination’ of the three parameters.
Level of significance was adopted for p < .05.
Results and discussion
TMR samples collected in five different points of the wagon hopper at the end of the cutting-mixing procedure did not show significant differences for chemical parameters content, per each sampling day.
In Table , the least square mean values and the standard error of the means (SEM), calculated through variance analysis of chemical parameters of samples diet released to cows, according to the loading level of the mixing wagon (100, 70 and 40%), cutting and mixing times are reported.
Table 3. Chemical values (LS means ± SEM) of samples collected on the alley according to loading level, cutting and mixing time (n = 225).
Figure shows the mean values (and SEM) of the difference of the diet sampled in the wagon chemical parameters vs. the collected samples content, according to the different combinations in diet preparation.
Figure 1. Chemical parameters difference of the formulated ratio vs. the collected samples (on the x axis, from the bottom, loading level, cutting and mixing times combinations, as reported in the experimental design.
CP: crude protein; EE: ether extract; NDF: neutral detergent fibre (NDF); DM: dry matter
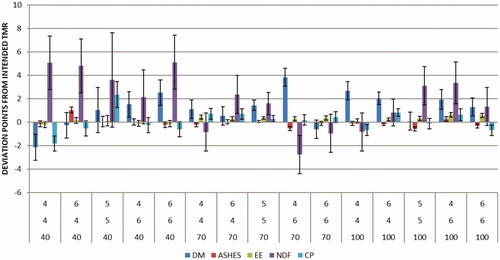
Table reports the statistical significance of data analysis related to the difference of chemical characteristics of each collected sample compared to the chemical characteristics of the formulated diet, kept as reference.
Table 4. Statistical significance of data analysis related to the difference of chemical characteristics of each collected sample compared to the chemical characteristics of the diet sampled in the mixer.
Mixing wagon loading affected CP content (p < .05), ash (p < .05), EE (p < .05) and NDF content (p < .01), while mixing time influenced DM content of the diet (p < .05), see Table .
The results related to chemical parameters of the diet did not show significant effects on the homogeneity of the collected samples for cutting time (p>.05).
The main effects on difference of analysed samples were mixing time for DM content, with a minimum difference of 0.19 points when the wagon is loaded at 40% of nominal capacity and 1.57 with a 100% loading level (p < .05). The loading level of the mixing wagon affected the difference of the diet sampled in the wagon vs. the collected samples for ash content (−0.05 for 70%; +0.13 vs. −0.23, respectively, for 40 and 100%; p < .05).
The loading of mixing wagon for 70% of the nominal capacity gave the lower difference values between NDF (p < .01), CP (p < .05) and EE (p < .05) of the formulated and the TMR distributed along the alley.
The choice of the ideal combination
Table reports the summation of differences (Σ) of each considered chemical parameter. It confirms the previous exposed results, that 70% of loading for the mixing wagon, together with 6 min of cutting time and 6 min of mixing gives the lowest summation, 2.78 units.
Table 5. List of the most efficient combination for loading, cutting and mixing times expressed by sums of the deviations of each chemical parameter collected from along the alley to formulated TMR.
The loading of 40% gives the greatest difference of the distributed TMR, if compared to the intended formulated ratio. Considering a cut-off level of 5% (Buckmaster et al. Citation2014), 70% of loading level seems to guarantee a lower deviation of nutrients in the TMR distributed to cows along the alley. The loading of 100% could be acceptable, when cutting is done for 4 min and mixing for 6 min (Σ = 4.08).
Uniformity of samples along the alley
Variance analysis evidenced significant differences in the three distribution points for the considered chemical parameters for DM and NDF content, as shown in Figure , for all combinations of loading, mixing and cutting times.
Figure 2. DM and NDF content variation of the diet samples collected along the alley.
DM: dry matter; NDF: neutral detergent fibre.
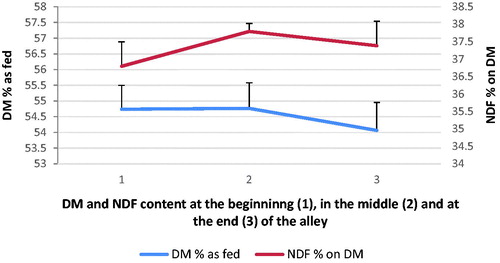
DM was different at point 1 and 2 from point 3 of the alley (p < .01); NDF differed at points 1 and 2 (p < .01) and at points 1 and 3 for (p < .05).
The less amount of DM, released at the end of the alley, together with the NDF trend at the different sampling points suggests that a stratification of the material in the mixing wagon may occur during the last time of distribution. This aspect seems to highlight the need to adjust the distribution time along the alley.
Although this trial revealed that this mixing wagon can perform a good TMR preparation at a 70% of loading level for 6 min of cutting and for 6 min of mixing time, a difference in DM and NDF content was measured along the feeding alley: the difference of chemical contents of collected samples along the alley, in a particular way for DM and NDF, together with to the behaviour habits of dairy cow to choose the same position at the feeding trough, highlight the different TMR composition for the various cows at the distribution.
Many reasons can affect the homogeneity of the delivered ration, that may be different than the intended ration (Buckmaster Citation2009a, Citation2009b; Baumgard et al. Citation2017), given that the ration is formulated properly from the start, with the right order of loaded ingredients, from forages to concentrates.
In this study, DM and NDF differ in the samples collected along the alley, highlighting a non-uniform TMR distribution. Mostly, NDF content and its digestibility are the main factors affecting feed intake and the TMR digestibility (Mertens Citation2009).
Although Yoder et al. (Citation2013) found that extreme daily fluctuations in FNDF had no cumulative negative effect on milk production over a 21-d period, a continuous variation in time of NDF, during lactation, can affect TMR intake, since when TMR has high fibre content and low energy, cows limit feed assumption in dependence of the ruminal filling.
Undoubtedly, the homogeneity and uniformity of NDF in TMR is closely related to its particle size, that is the result of mixer type, makeup of the ration and mixing protocol (Heinrichs Citation2013), and NDF concentration is linked to particle size distribution (Yang and Beauchemin Citation2007; Dahlke and Strohbehn Citation2009; Buckmaster Citation2009a, Citation2009b).
Conclusions
The DM and NDF differences along the feeding alley revealed a different TMR composition for the various cows at the distribution, although sampling after the cutting–mixing procedure showed a good uniformity at wagon level.
These preliminary results on the efficiency of a mixing wagon for dairy cows TMR put in evidence the necessity of further studies addressed to a potential de-mixing of ingredients during TMR release.
Disclosure statement
No potential conflict of interest was reported by the authors.
Related Research Data
References
- AOAC. 2005. Official methods of analysis. 18th ed. Gaithersburg (MD): Association of Official Analytical Chemists, International.
- Baumgard LH, Collier RJ, Bauman DE. 2017. A 100-Year review: eegulation of nutrient partitioning to support lactation. J Dairy Sci. 100:10353–10366.
- Buckmaster DR. 2009a. Optimizing performance of TMR mixers. Proceedings Tri-State Dairy Nutrition Conference. p. 105–117.
- Buckmaster DR. 2009b. Optimizing performance of TMR mixers. Tri-state Dairy Nutrition Conference, April 20–21. Fort Wayne (IN): Grand Wayne Centre.
- Buckmaster DR, Wang D, Wang H. 2014. Assessing uniformity of total mixed rations. Appl Eng Agric. 30:1–6.
- Commission Regulation. 2013. (EU) No 691/2013 of 19 July 2013 amending Regulation (EC) No 152/2009 as regards methods of sampling and analysis. 20.7. Official Journal of the European Union.
- Dahlke G, Strohbehn D. 2009. Feed particleseparation due to feed delivery and time in feedbunk and effects on cattle performance. Iowa StateUniversity Animal Industry Report. Ames (IA): Iowa State University; p. 4. AS LeafletR2242.
- DeVries TJ, von Keyserlingk MAG, Beauchemin KA. 2005. Frequency of feed delivery affects the behavior of lactating dairy cows. J Dairy Sci. 88:3553–3562.
- Heinrichs J. 2013. The Penn State Particle Separator. Penn State Extension. DSE 2013-186:1–8.
- Kmicikewycz D, Harvatine KJ, Heinrichs AJ. 2015. Effects of corn silage particle size, supplemental hay, and forage-to-concentrate ratio on rumen pH, feed preference, and milk fat profile of dairy cattle. J Dairy Sci. 98:4850–4868.
- Mäntysaari P, Khalili H, Sariola J. 2006. Effect of feeding frequency of a total mixed ration on the performance of high-yielding dairy cows. J Dairy Sci. 89:4312–4320.
- Mertens DR. 2009. Maximizing forage use by dairy cows. Western Canadian Dairy Seminar. Adv Dairy Technol. 21:303–319.
- Šístkova M, Pšenka M, Kaplan V, Potěšil J, Černín J. 2015. The effect of individual components of total mixed ration (TMR) on precision dosing to mixer feeder wagons. J Microbiol Biotechnol Food Sci. 05:60–63.
- Sova AD, LeBlanc SJ, McBride BW, DeVries TJ. 2014. Accuracy and precision of total mixed rations fed on commercial dairy farms. J Dairy Sci. 97:562–571.
- Vegricht J, Miláček P, Ambrož P, Machálek A. 2007. Parametric analysis of the properties of selected mixing feeding wagons. Res Agr Eng. 53:85–93.
- Yang WZ, Beauchemin KA. 2007. Altering physically effective fiber intake through forage proportion and particle length: chewing and ruminal pH. J Dairy Sci. 90:2826–2838.
- Yoder PS, St-Pierre NR, Daniels KM, O’Diam KM, Weiss WP. 2013. Effects of short-term variation in forage quality and forage to concentrate ratio on lactating dairy cows. J Dairy Sci. 96:6596–6609.
- Zebeli Q, Dunn SM, Ametaj BN. 2011. Perturbations of plasma metabolites correlated with the rise of rumen endotoxin in dairy cows fed diets rich in easily degradable carbohydrates. J Dairy Sci. 94:2374–2382.