
 ?Mathematical formulae have been encoded as MathML and are displayed in this HTML version using MathJax in order to improve their display. Uncheck the box to turn MathJax off. This feature requires Javascript. Click on a formula to zoom.
Abstract
RNA-Seq technology was used to investigate differences in the gene expression of pectoralis muscle tissue between two chicken breeds [Ross as commercial (rapidly growing) and Isfahani as Iranian local breed (slow-growing)]. Total RNA was isolated from breast muscle samples at end of 4 weeks of age and sequenced by an Illumina Hiseq 2000 sequencer. Hierarchical Indexing for Spliced Alignment of Transcripts (HISAT2) was applied to align clean reads to chicken reference genome. Then, Cufflinks package was used to assemble transcripts and identify significantly differentially expressed genes (DEGs). Between two groups, the 606 significantly DEGs were identified (p-adjusted ≤.05). The confirmation of RNA-seq data was performed by Quantitative real-time PCR (qRT-PCR), consistent expression results were found for 10 selected genes. This study identified DEGs that regulate peroxisome proliferator-activated receptors (PPAR) signalling and Phosphatidylinositol-3 kinase Akt (PI3K/Akt) pathways in the Commercial breed, which might contribute to its higher metabolism of energy and growth characteristics compared to the Native breed. Our results suggested that the different expression patterns of some interesting genes including the PIK3IP1, SGK1, FOXO3, FBXO32, FBXO30, CUL3 and ASB1 in Native chicken might represent a cause for the poor growth performance for this breed than the Commercial breed.
Expression patterns of PIK3IP1, FoxO3 and FBXO32 and some other genes might represent a cause for the poor growth performance in Native chickens.
DEGs that regulate PPAR signalling and PI3K/Akt pathways, which might contribute to the higher metabolism of energy and growth characteristics in Commercial chickens.
Some important candidate genes related to skeletal muscle growth is obtained.
Research highlights
Introduction
Chickens are one of the most effective and important domestic animals used for meat production in the world. Native chicken breeds are considered as an important genetic resource developed over thousands of years. Native chickens are well adapted to the local environmental conditions, with relatively low maintenance requirements and better resistance to diseases compared to Commercial breeds (Hall and Bradley Citation1995). However, the lower growth rate and feed efficiency of Native chicken breeds breaks the continuity between the supply and demand for their meat. Therefore, the genetic improvement of Native chicken breeds is of great interest, so as to increase growth rate efficiency. The propagation and extension of Iranian Native chickens, in the framework of a national scheme, started in 1984 in the six breeding stations located in different regions of Iran (Mazandaran, Fars, Isfahani, West Azerbaijan, Yazd, and Khorasan). One of these stations is the Native chicken breeding centre of Isfahani, which was established with two main objectives, namely extension and genetic improvement. Isfahani's Native chicken is a dual purpose breed, capable of providing both eggs and meat (Yousefi Zonuz et al. Citation2013). This breed is slow-growing with a relatively small body size, and is known for its strong resistance to general diseases and suboptimal environmental conditions.
Conversely, Ross 708 is among the rapidly growing Commercial broiler chickens, which is now widely used for Commercial production in the world. They are capable of growing from about 40 g at day 1 post-hatch to more than 4 kg in 8 weeks. Hence, these birds are slaughtered for meat within 8 weeks. Increasing muscle mass, mainly breast meat, is crucial for body growth as well as the economics of meat production and the profitability of the broiler industry (Salarpour et al. Citation2015). Therefore, the identification of mechanisms of molecular genetics and candidate genes of muscle development in chicken could be useful for the quick genetic improvement of Isfahani’s Native breed. Previous studies have reported some of the important genes and pathways involved in the muscle development of chickens. For instance, Guernec et al. (Citation2003) investigated the gene expression of IGF-1 and MSTN in broilers having a high breast meat yield and their controls, so as to relate their expression with muscle fibre development. Their results showed that the relative expression of these genes could be involved in regulating muscle growth rate along with development, while other factors are necessary to know the differences between genotypes. The gene expression assessment of Legacy and modern broiler chickens regarding their post-hatch breast muscle, revealed the enrichment of many myogenic growth regulators, including positive and negative myogenic growth regulators (Davis et al. Citation2015). A microarray was used by Cui et al. (Citation2012) to investigate the gene expression profiles of breast muscle sampled at different developmental stages of Beijing-you (slow-growing Chinese breed) and Arbour Acres (a Commercial fast-growing broiler line) chickens. They reported 19 distinctively expressed key genes related to muscles. Yin et al. (Citation2014) compared the expression profiles of muscle genes in the postnatal skeletal muscle of broilers chosen for high and low body weight. They reported that long-term selection for growth altered the pattern of muscle gene expression. However, according to the authors' best knowledge, no study has been conducted to compare the transcriptome structure of muscle in Commercial vs. Iranian indigenous chicken breeds.
Here, we hypothesised that the differential gene expression affecting muscle growth and differentiation would be distinctively controlled between the breast muscle of Ross 708 and Isfahani’s Native breed. For hypothesis testing, RNA-Seq technology was employed to investigate the related molecular mechanisms and gene expression profiles of these breeds at the 28-day post-hatch period which is the most significant BW increment period for broilers (Zheng et al. Citation2009).
Material and methods
Animals and collection of muscle tissue samples
All experimental procedures in this project were approved by the Animal Use and Care Administrative Advisory Committee at Ferdowsi University of Mashhad, based on the national guidelines from Ministry of Health and Medical Education of Iran, adopted from the 86/609/EEC Directives of European Community. Male chickens (Gallus Gallus) from Ross 708 and Isfahani's Native chickens (n = 200 for each breed) were raised in cages on the Safiabad agriculture and education centre farm in Iran. All the birds were reared under the same management, environmental and nutritional conditions. The diet was the same throughout the whole experiment and formulated to contain 20% CP (Crude Protein) and 3000 kcal ME/kg. The birds received feed and water freely (ad libitum). On day 28 post-hatch, six birds were randomly selected from each breed, weighed and sacrificed. From each bird, 1–2 g of tissue was excised from the posterior region of the left pectoralis major muscle. Collected samples were flash frozen in cryogenic tubes in liquid nitrogen and kept at −80 °C until required (RNA sequencing).
Extraction and sequencing of RNA
The extraction of total RNA from each muscle sample was performed using Trizol reagent (Invitrogen, USA), following the manufacturers protocol. The purity and concentration of RNA were detected by NanoDrop (Thermo Scientific™ NanoDrop 2000) and gel electrophoresis, respectively. The 28S/18S ratio for RNA samples ranged from 1.8 to 2. cDNA libraries were constructed using the TruSeq® RNA Sample Preparation Kit v2 (Illumina®, USA) and deep sequenced by the BGI Company (China, Shenzhen). Three RNA samples from the same breed were pooled (by mixing together equal quantities of RNA) to generate a total of four pooled RNA samples (two samples in each breed). An Illumina® HiSeq™ 2000 sequencer was used to sequence the libraries, according to the manufacturer’s instructions, so as to generate paired-end reads of 150 base pair. The raw RNA sequencing data were deposited to the Gene Expression Omnibus (GEO) database of NCBI under accession number: PRJNA543626, and are also available at https://www.ncbi.nlm.nih.gov/sra/PRJNA543626.
Processing of raw reads
Quality cheques were performed on a raw sequence data using FastQC (version 0.11.5). To remove the low quality paired-end reads as well as reads containing adapter sequences, Trimmomatic (current version 0.36, http://www.usadellab.org/cms/?page=trimmomatic) was run on each sample, using its adaptive trimming algorithm MAXINFO with a target length of 50 and strictness of 0.9. The clean reads were then reanalysed with FastQC to confirm the quality improvements.
Gene expression analysis
The Galgal5 reference genome and the annotation GTF file for chicken (release 89) were obtained by downloading from the Ensemble (http://asia.ensembl.org/info/data/ftp/index.html). Paired-end reads from each sample that passed the quality filters were aligned to the reference Galgal5 genome using Hierarchical Indexing for Spliced Alignment of Transcripts (HISAT2, v2.0.4.) (Kim et al. Citation2015). Aligned reads were then assembled into transcripts using Cufflinks version 2.2.1, guided by Ensembl annotation, to construct and identify both known and novel transcripts (Trapnell et al. Citation2012). Here, abundances of transcripts were upper-quartile normalised to account for differences in library sizes and also, the genome reference sequence was applied for sequence bias correction in order to improve expression estimates. The expression level of each transcript was estimated as Fragments Per Kilo base per Million mapped reads (FPKM, Trapnell et al., Citation2012). This analysis resulted in four different assemblies (GTF files) corresponding to four samples in the muscle tissue. In the next step, to generate a set of unique and non-overlapping transcripts, all the transcript GTF files were merged into final transcripts using Cuffmerge tool. Finally, Cuffdiff was utilised to detect the DEGs between Commercial and Native chicken breeds with FPKM upper-quartile normalisation (in order to improve the strength of differential expression calls for less abundant transcripts). Transcripts with a false discovery rate (FDR)≤.05 were considered as DEGs.
Principal components analysis (PCA)
PCA analysis was performed using R statistical software package with the normalised counts to investigate if samples from the same breed cluster together.
Functional annotation and pathway analysis of DEGs
DEGs (up-regulated and down-regulated genes) were subjected to the gene ontology (GO) functional analysis (BP, biological process) and the Kyoto encyclopaedia of genes and genomes (KEGG) pathway analysis using Database for Annotation, Visualisation and Integrated Discovery (DAVID) v6.8 (Huang da et al. Citation2009). The calculated p values were corrected through Benjamini-Hochberg correction (Benjamini and Hochberg Citation1995) and enriched terms were considered statistically significant when the adjusted p values was ≤.05.
Validation of DEGs by quantitative RT-PCR
Quantitative RT-PCR was employed to technically validate the repeatability and accuracy of DEGs detected by RNA-Seq. Quantitative RT-PCR was conducted on 10 functionally important genes from the identified DEGs (Table ) using an Applied Biosystems, Step-One Real Time PCR system. PCR primers specific to these genes were designed using the Prime3 programme (http://primer3.ut.ee/).
Table 1. Primer sequences for qRT-PCR.
Glyceraldehyde-3-phosphate dehydrogenase (GAPDH; GenBank No. NM_204305) were used as a housekeeping gene. GAPDH has proven to be a better internal control than actin (Dieffenbach et al. Citation1989). Its level in tissue culture cells is independent of the degree of confluency of the culture and is constant in the presence of a variety of different treatments (Dveksler et al. Citation1992).
The cDNA synthesis of total RNA for each sample was performed using the first strand cDNA synthesis kit (Thermo Fisher, Co., USA) as outlined by the manufacturer with oligo-dT primers and by applying about 1 μg of the total RNA as template. Using the Roche SYBR Green PCR Kit, the qRT-PCRs were carried out in a final volume of 20 μL PCR total reaction mixture, according to the manufacturer’s instructions. At 95 °C, the qRT-PCR programme started with a 5-min denaturation step. This was followed by 40 cycles of denaturation at 95 °C for 10 s, was annealing for 20 s at 50–60 °C, and 20 s of elongation at 72 °C. Six non-pooled samples were applied per each breed. We used extra samples in qRT-PCR to be sure about repeatability of the results in some animals that were not applied in RNA-Seq. All qRT-PCRs were run with six replicates (n = 6) and the 2−ΔΔCT method (Schmittgen and Livak Citation2008) was used to quantify the expression levels relative to the control. Correlation analyses between RNA-seq and RT-qPCR log2 fold change were performed using Pearson’s correlation. The non-parametric Mann-Whitney U-test was used for comparisons between two groups; differences were considered to be significant if p ≤ .05.
Statistical analysis
At each stage of weighing, 35 male chickens from each breed were randomly selected. Data were collected from day one by weighing each chick and recording body weights. Thereafter, body weights were taken on individual birds fortnightly for the duration of the experiment. All data of body weights were statistically analysed by Students t test. Statistical analyses were conducted using the R statistical package (R version 3.4.0, Ihaka and Gentleman Citation1996). Statistical significance for differences among experimental means was inferred if p values ≤.05.
Results
Relative differences for phenotypic data between the breeds
Table presents the BW measurements of two breeds. BW was significantly higher in the Commercial than Native chicken at the first day post-hatch. This trend remained at this level during the entire experimental period. Therefore, as expected, the results indicated that the growth rate and BW of the Native breed was much lower than that of the Commercial breed.
Table 2. Statistics of the measurements of the BW (in grams, presented as mean ± SD) from Commercial and Native breeds.
Identification of expressed genes in the chicken muscle transcriptome
The RNA-Seq of four samples yielded 131,590,636 of raw 150 bp paired end reads, of which 94,483,431 (21,502,238 and 72,980,361 reads for each of the two pooled samples) and 37,107,205 (19,101,872 and 18,004,990 reads for each of the two pooled samples) reads were for Native and Commercial breeds, respectively. After quality filtering, high-quality reads of each sample were mapped to the reference genome and utilised for gene expression analysis. The average number of cleaned reads across all four samples amounted to 51,477,143 reads. Following quality check reports after trimming the raw data, the averaged quality score of sequence reads was 38, with the average GC content ranging from 52% to 54%. The findings indicated good read quality and the data were appropriate for further analysis.
Using Hisat2 aligner, more than 72% of clean reads (in average) were mapped back to the Galgal5 reference genome. In addition, about 90% of reads were aligned concordantly. Table presents the detailed information of cleaned reads and mapping statistics. Most of the mapped reads (58.3–68.4%) fell into annotated exons, 21.7–29.1% were located in the introns and only 9.9–12.8% were located in the intergenic territory (Figure ).
Figure 1. The percentage of reads mapped to exonic, intronic and intergenic regions.
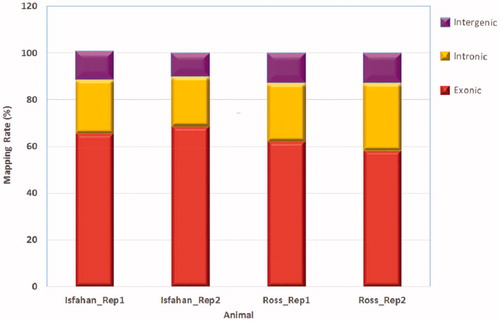
Table 3. Summary statistics for sequence quality and alignment information of four breast muscle samples in two breeds.
Differential expression profiling
In both Commercial and Native birds, a total of 18,973 genes were considered for their expression levels in the breast muscle tissue. After assembling the mapped reads, 15,143 genes were identified from the two groups including 13,181 known and 1965 novel genes, the latter of which, 12,829 genes were found in the Native group and 12,720 genes were found in the Commercial group and 12,368 of these genes were commonly expressed between the two groups. 1955, 1896 and 1886 of the novel genes were found in the Native, Commercial and both groups, respectively.
In the next step, Cuffdiff, was used to identify differentially expressed genes. In total, 606 genes were detected as significant genes with different expression levels between Native and Commercial breeds (p-adjusted ≤.05). 249 (including 210 known and 39 novel) and 357 (including 321 known and 26 novel) genes were detected as up and down-regulated genes in Native compared to the Commercial (Figure ). Among the DEGs, 488 genes had an absolute value fold change >2. The top 10 up-regulated and down-regulated genes are listed in Table . The detailed information of known and novel genes and their differential expression analysis was reported in Supplementary Table S1 and also available at https://www.ncbi.nlm.nih.gov/geo/query/acc.cgi?acc=GSE132299.
Figure 2. Differential expressed genes in two line of chickens.
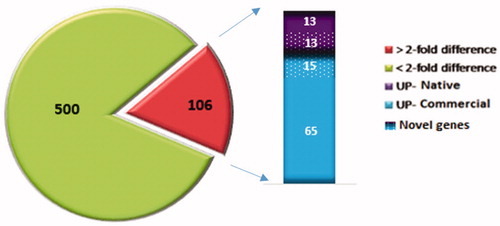
Table 4. Top 10 up-regulated and down-regulated known genes in Ross chicken.
Principal components analysis
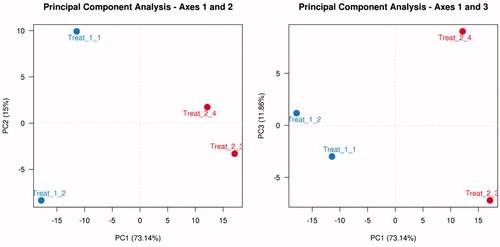
This analysis was performed to investigate if samples from the same breed cluster together. As a result, the first two principal components (PCs) explained more than 88% of the variability among the samples and both of the breeds were grouped in distinct clusters (Figure ). This analysis indicated a clear difference between the transcriptome profiles of the two breeds. Therefore, the differences in gene expression profiles would enable us to identify candidate genes explaining the known differences in the muscle shape that exist between these two breeds.
Figure 3. First two components of a Principal Component Analysis, with percentages of variance associated with each axis. Biological replications in native chickens are shown with Treat_1_1 and Treat_1_2 and in commercial chickens are shown with Treat_2_1 and Treat_2_2.
Quantitative RT-PCR confirmation of the gene expression data from RNA-Seq
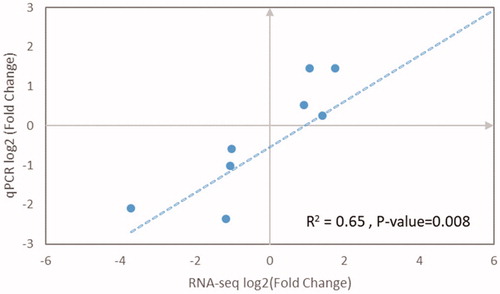
To validate the differentially expressed genes of pectoralis muscle between Native and Commercial groups obtained by transcriptome, 10 functionally important genes from the identified DEGs and their expression levels were quantified using qRT-PCR (Figure ). The RNA-Seq results indicated that the expression of PHGDH, SGK1, TNNI1, ITGA4 and CRH were down-regulated in Native chicken by one to six-fold, the expression of TDH, ACE, FOXO3, PIK3IP1 and FBXO32 were up-regulated in Native chicken by one to four-fold. qPCR results also found the similar down-regulated or up-regulated trend in the expression of these genes. Therefore, a good agreement was found between the RNASeq and real-time PCR results (Figure ).
Figure 4. Validation of the 10 DEGs from RNA-Seq analysis by qRT-PCR. The direction and magnitude of the fold changes obtained using the quantitative RT-PCR technique were similar to those of the RNA-Seq.
Note: TDH: L-threonine 3-dehydrogenase; ACE: Angiotensin I-converting enzyme; FOXO3: Forkhead box O3; PIK3IP1: Phosphoinositide-3-Kinase Interacting Protein 1; FBXO32: F-Box Protein 32; PHGDH: D-3-phosphoglycerate dehydrogenase; SGK1: Serine/threonine-protein kinase; TNNI1: Troponin I1, Slow Skeletal Type; ITGA4: Integrin Subunit Alpha 4; CRH: Corticotropin Releasing Hormone.
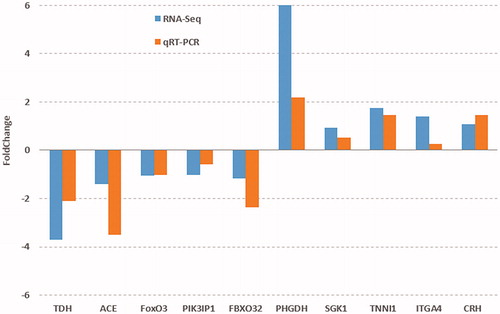
Figure 5. Quantitative real-time PCR (qRT-PCR) validation and linear regression analysis of RNA sequencing of selected DEGs.
Functional annotation of DEGs
Here, to identify the functions and pathways that might be altered by the DEGs, GO and KEGG pathway enrichment analyses were conducted by DAVID tool. We identified 15 significant enriched GO terms in significant up-regulated genes in the Native breed such as the protein modification process, cellular metabolic process and protein metabolic process. In addition, 479 significant GO terms were identified in significant up-regulated genes in the Commercial breed, which were mainly involved in developmental and differential processes. The results of the KEGG pathways are presented in Supplementary Table S2 and also available at https://www.ncbi.nlm.nih.gov/geo/query/acc.cgi?acc=GSE132299.
Moreover, the genes with higher expression in the Commercial breed were significantly enriched in 12 pathways, such as the PI3K/Akt signalling pathway (Figure ). In addition, no one pathway remained statistically significant after the Benjamin correction of up-regulated genes in the Native breed. A summary of the functional analysis, including GO terms and KEGG pathways are shown in Table .
Figure 6. PI3K/AKT signalling map. Coloured genes are differentially expressed genes (DEGs). Node colour reflects gene’s log2FC variation: Red stands for up-regulation and green stands for down-regulated genes in Commercial broiler.
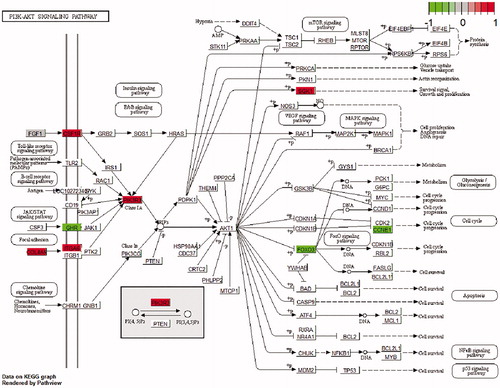
Table 5. A summary of GO and KEGG pathway of DEGs in two breeds.
Discussion
The Encyclopaedia of DNA Elements (ENCODE) consortium recommends 30 million pair‐end reads of length >30 nucleotides, in which 20–25 million reads are mappable to the genome for evaluating transcriptional profiles (Huang et al. Citation2016). While some authors will argue that as few as five million mapped reads are sufficient to accurately quantify medium to highly expressed genes in most eukaryotic transcriptomes, It has been reported that 20–30 million mapped reads are sufficient to detect virtually all active transcripts in a cell line (Hart et al. Citation2013). Hence, the RNA-Seq datasets obtained in this study provides deep enough coverage to undertake analysis of differential expression of genes and transcripts.
We hypothesised that genes and pathways affecting muscle growth and differentiation would be differentially regulated between the breast muscle of the Ross 708 and Native lines. To test this hypothesis, high throughput RNA sequencing was applied to compare the transcriptomic profile of the chicken breast muscle development in two breeds with different growth rates, Ross 708 and Isfahani breed. Through this study, 531 known genes were identified as DEGs, of which 321 genes were up-regulated while 210 genes were down-regulated in the Commercial breed compared with the Native breed.
The discrepancy between the numbers of genes that underwent up-regulation and down-regulation was in line with previous studies (Davis et al. Citation2015; Zhou et al. Citation2015; Zhang et al. Citation2017). The hypothesis was that muscle development and inflammatory responses require activator genes of higher levels. Hence, these activator genes may positively regulate gene expression in the breast muscle tissue of the Commercial breed.
TDH is the most prominent up-regulated gene in Native chicken and is regarded as the primary enzyme that starts l-threonine catabolism. It has been demonstrated that threonine dehydrogenase catalyses the transformation of 2-amino-3-oxobutyrate to acetyl CoA and glycine. A previous study showed that TDH activity is influenced by the protein level of the diet in chickens, as the expression of this gene was significantly greater in chicks fed a high protein diet compared with chicks fed a basal diet (Davis and Austic Citation1997). In our experiment, chicks of both breeds received the same diet. Therefore, it may be concluded that excess protein intake through diet, which is formulated based on the nutrient requirements of the modern breed of broiler, increases the expression of this gene in the Native breed.
In the present study, ACE and RSAD2 were significantly up-regulated in the Native breed. The ACE gene plays a vital role in the renin angiotensin system, which affects fat accumulation, body energy homeostasis and glucose tolerance (Savary et al. Citation2005). This gene converts the decapeptide angiotensin I into the bioactive octapeptide angiotensin II. Angiotensin II can reduce protein synthesis and muscle hypertrophy by decreasing IGF-1 levels. In agreement with our study, the previous study reported that the ACE gene had higher expression in the muscle tissue of Legacy relative to modern broiler chickens (Herd and Arthur Citation2009). It has also been shown that the expression of RSAD2 is always high in tissues with lower fat content (Dogan et al. Citation2013). Moreover, the previous study reported that the higher expression of RSAD2 in chicken with low residual feed intake (duodenal epithelial tissue) could result to reduced feed intake (Yi et al. Citation2015). Therefore, the higher expression of both genes may contribute to differences in the body weight and growth rate in the Native breed compared with the Commercial breed.
PHGDH is most prominently expressed in the Commercial breed. PHGDH encodes 3-phosphoglycerate dehydrogenase, a key metabolic enzyme in the serine biosynthesis pathway. This enzyme oxidises the glycolytic intermediate 3-phosphoglycerate into phospho-hydroxyl pyruvate, and subsequently converts into serine via transamination reaction. Serine is a key metabolite for biosynthetic reactions and is essential for the synthesis of protein and other amino acids such as cysteine and glycine and other biological molecules required for cell proliferation, including nucleotides, phosphatidyl-serine and sphingosine. Therefore, the high expression of this gene in the Commercial breed seems to be associated with higher muscle content.
The functional enrichment results revealed the major biological processes that could be directly regulated during growth and muscle development, supporting the increased breast muscle weight in the Commercial breed. Muscle development is a complicated physiological process involving cell differentiation, proliferation, migration and so on. As expected, the results of the functional analysis of the up-regulated genes in the Commercial breed showed that most of these genes were related to the development of muscle structure, muscle tissue development, cell differentiation, muscle cell differentiation, epithelial cell differentiation, cell proliferation, epithelial cell proliferation, muscle cell proliferation, regulation of smooth muscle cell proliferation, endothelial cell proliferation, cell migration, tissue migration, epithelial and endothelial cell migration and regulation of endothelial cell migration (). For example, THBS1, CTGF, CYR61, SOX9, BMP5 and some members of transforming growth Factor-B family (TGFβ2 and TGFβ3) were up-regulated in the Commercial breed. The primary functions of this family include enhancing the formation of the extracellular matrix, angiogenesis and regulation of cellular differentiation and regulation of proliferation (Benckert et al. Citation2003). TGF-β signalling can be activated by THBS1 (Leask and Abraham Citation2004). In normal adult fibroblasts, TGF-β induces the expression of CTGF and CYR61. These two proteins are heparin-binding, cysteine-rich peptides that induce proliferation and collagen synthesis (Moussad and Brigstock Citation2000). BMP5 is expressed in the developing limb and shows chondrogenic abilities (Zuzarte-Luıs et al. Citation2004). SOX9 is expressed in association with chondrogenic aggregates and a variety of studies revealed that SOX9 is a master regulator of chondrogenesis (Kawakami et al. Citation2006). The expression of SOX9 during chondrogenesis might be under the direct control of the TGFβ/BMP activity (Yoon and Lyons Citation2004). This finding supports the presence of more BW and breast muscle mass in the Commercial breed compared to the Native breed. Also, the expression of genes related to fast-type and slow-type fibres was also observed in this study. Previous studies reported that selection for rapid growth increases the number and size of muscle fibres without changing their fibre type composition in chickens (Remignon et al. Citation1995).
Based on our data, we found that the expression ratio of fast to slow-type muscle fibres is different in Pectoralis major muscle cells between Commercial and Native. The expression levels of several slow-type muscle protein encoding genes, troponin I type I (TNNI1), ATPase Sarcoplasmic/Endoplasmic Reticulum Ca2+ Transporting 2 (ATP2A2), and Tropomyosin isoform II (TPM2), were significantly higher in Commercial than in Native, which indicate that fast-slow twitch of muscle fibres might occur in Commercial at posthatch 4 weeks. TNNI1 expression is limited to expression in only slow skeletal fibres (Mullen and Barton Citation2000). The TNNI subfamily has further been found to play a role in the mediation of skeletal muscle relaxation and contraction. ATP2A2 gene encodes for sarco-plasmic reticulum Ca2+-ATPase isoform 2a (SERCA2a). SERCA2a shows high levels of expression in slow-twitch skeletal (Periasamy et al. Citation1999). SERCA2 is a critical component of the endoplasmic reticulum and sarcoplasmic reticulum and acts as a pump to sequester (Periasamy et al. Citation1999) and translocate Ca2+ (Prasad et al. Citation2005). SERCA pumps also have a role in contraction and relaxation of myofibrils (Prasad et al. Citation2005). TPM2 gene encodes beta-tropomyosin, a member of the actin filament binding protein family, mainly expressed in slow, type 1 muscle fibres (Palmieri et al. Citation2016). Tropomyosin is a component of the muscle sarcomeric thin filament and plays a crucial role in the calcium-dependent regulation of muscle contraction.
The expression levels of several contracting genes and those regulating muscle contracting, such as TNNT2, MYL9, MYH1D, MYH1A, MYH13, MYL12, MYOM3, ACTA2, ACTC1, ACTN1, were significantly higher in Commercial than in Native chicken (). Actins are highly conserved proteins that are involved in various types of cell motility. For example, ACTC1 is found in muscle tissues and is a major constituent of the contractile apparatus. MYOM3 can be detected mainly in intermediate speed fibres of skeletal muscle (Schoenauer et al. Citation2008). Such differences in the expression of genes associated with skeletal muscle structure suggest that these genes are likely to have contributed to the phenotypic difference in the skeletal muscle of these two breeds.
Based on the functional enrichment analysis, 21 of the up-regulated genes in the Commercial breed were involved in inflammatory response (), which is in good agreement with previous studies (Zhou et al. Citation2015). The inflammatory response is one of the components of non-specific immunity in birds. In the previous study, 136 genes including chemokine (C-X-C motif) and CRH (an important factor to stress response pathways) were up-regulated in chicken with higher body weight. In the current study, CRH was expressed only in the Commercial broiler. Nerve terminals and epithelial cells synthesise CRH at inflammation sites and has a local pro-inflammatory effect on resident immune cells (Webster et al. Citation1998). Moreover, previous studies have reported the function of CRH in directly mediating thermogenesis in the muscle and providing protection against skeletal muscle lipotoxicity and insulin resistance, controlling food intake, energy balance and weight regulation (Richard et al. Citation2002). Hence, it is possible that the increased transcription of CRH functions to boost the immune response and act as a weight regulating factor in the skeletal muscle of the Commercial broiler.
We also found several significant pathways in the up-regulated genes of the Commercial breed, which were associated with growth rate and muscle development. The 24 genes in our study enriched this pathway and some of these genes included ITGA4, ACTN1 and eight other genes encoding collagen (). Integrins are a family of cell adhesion molecules that mediate cell-cell and cell-extracellular matrix interactions. Integrins such as ITGA4 maintain dual roles in cell adhesion and signal transduction and are considered as a link between two networks across the plasma membrane including the extracellular matrix and the intracellular actin filamentous system. In vertebrate striated muscle, actin regulatory proteins such as ACTN1 are linked with sarcomeric actin filaments and control the dynamics, organisation and function of thin filaments.
It is well known that the maintenance of muscle mass (hypertrophy or atrophy) is mediated by a balance between protein anabolism and catabolism. Skeletal muscle atrophy is marked by an increase in proteolysis, especially through the ATP-dependent ubiquitin-proteasome pathway. The PI3K/Akt signalling pathway controls the synthesis of protein and is vital to muscle hypertrophy. It has been reported that the reduced PI3K/Akt signalling pathway, enhances protein breakdown in the muscle. After activation of the PI3K/Akt pathway, the FOXO3 transcription factor is phosphorylated and cannot enter the nucleus to promote the expression of genes related to atrophy (such as Atrogin-1). This terminates the process of protein degradation. Therefore, Forkhead factors are vital to the development of muscle atrophy (Bassel-Duby and Olson Citation2006). The PIK3IP1 gene encodes a protein that can negatively regulate the PI3K pathway and act as a positive mediator of FOXO3 activation (Schmidt-Strassburger et al. Citation2012). The lack of expression of PIK3IP1 leads to the activation of PI3K/Akt, thereby increasing protein synthesis and muscle cell size. Also, increasing the expression of IGFBP3 by inhibiting IGF-1 (Ricort and Binoux Citation2001) would weaken the signal pathway of IGF1/PI3K/Akt and enhance atrophy in the Native chickens. Up-regulating the PIK3IP1 and IGFBP3 genes suggests that these two proteins, by decreasing the levels of IGF-1 and PI3K, respectively, deactivated the IGF1-PI3K-Akt pathway and thus, these two genes were major activators of FOXO3. The SGK1 gene is a PI3K-dependent kinase and is homologous to the Akt. SGK1 can inhibit muscle atrophy with FOXO3 phosphorylation (Brunet et al. Citation2001). This gene is up-regulated in Commercial chickens. Thus, in these two breeds, PIK3IP1 and SGK1 genes had opposite effects on the expression and activity of the FOXO3 gene.
On the other hand, FBXO32, is vital to regulating the initiation and development of muscle mass (Sandri et al. Citation2004). Skeletal muscle atrophy has many models which present high expression of FBXO32, the onset of muscle weight loss is preceded by this increase (Bodine et al. Citation2001). Moreover, there was a decrease in the muscle atrophy rate, in animals lacking FBXO32 (Bodine et al. Citation2001). In brief, the PI3K/Akt pathway inhibits the expression of FOXO3 and FBXO32 and increases muscle hypertrophy. Interestingly, in this study, the PI3K/Akt signalling pathway was significant in up-regulated genes in the Commercial breed. Moreover, FOXO3, FBXO32, FBXO30, CUL3 (Lange et al. Citation2012) and ASB1 (Kohroki et al. Citation2005) were significantly up-regulated in the Native breed, supporting the muscle mass differences between the two breeds by increasing protein breakdown and decreasing protein synthesis in the Native breed. Furthermore, it has been reported that FOXO3 plays an important role in activating the transcription of MYOD1, a muscle-specific transcription factor, affecting muscle growth (Hu et al. Citation2008). It has recently been reported that MYOD could control and facilitate the assembly of muscle enhancers and is required to preserve the differentiated phenotype of adult fast skeletal muscle fibres The previous study showed that MYOD can be targeted with FBXO32 for degradation in multiple models of skeletal muscle atrophy (Lagirand-Cantaloube et al. Citation2009). The down-regulation of MYOD is critical for muscle loss and depending on the atrophic signalling pathway, it can occur both at the RNA and protein levels. In the current study, MYOD was also up-regulated in the Native breed. Based on the aforementioned facts, it can be concluded that inhibition of MYOD functions may occur after transcription and translation stages in the Native breed. Therefore, FBXO32-dependent proteolysis of MYOD could hinder muscle homeostasis. The over-expression of MYOD in Native chickens with slower growth rate is in agreement with similar previously published studies (Davis et al. Citation2015).
The other significant pathway for the up-regulated gene in the Commercial breed is the PPAR signalling pathway, which plays a key role in the metabolism of lipids. Notably, in this study, eight genes were found to be expressed through this pathway (). PPARs are a group of nuclear receptor proteins that function as trans-regulatory elements (transcription factors) (Michalik et al. Citation2006). PPARs are vital to the regulation of cellular differentiation, development, and metabolism (carbohydrate, lipid, protein) (Dunning et al. Citation2014). It is well known that the growth of broiler chicken is accompanied by an increased percentage of body fat. The deposition of fat is faster and earlier in fast-growing broilers compared to slow-growing chickens (Li et al. Citation2008). Therefore, the activation of this pathway in the Commercial breed seems to be essential for faster muscle development.
Conclusions
This study analysed the gene expression of breast muscle tissue between the Native and Commercial chicken breeds. As earlier discussed, the results of this study showed that there are several evidences suggesting that DEGs were possibly associated with differentiation, proliferation, development, energy homeostasis and the other biological processes related to breast muscle development and growth rate. Our results suggested that different expression patterns of some genes including SGK1, PIK3IP1, FOXO3, FBXO32, FBXO30, CUL3 and ASB1 in Native breed might represent a cause for the poor growth performance for this breed than Commercial breed. Hence, evaluation of Native chicken based on these candidate genes would accelerate the efficient Native chicken breed in near future.
Supplemental Material
Download MS Word (32.3 KB)Supplemental Material
Download MS Word (94.1 KB)Disclosure statement
No potential conflict of interest was reported by the authors.
Additional information
Funding
Related Research Data
References
- Bassel-Duby R, Olson EN. 2006. Signaling pathways in skeletal muscle remodeling. Annu Rev Biochem. 75:19–37.
- Benckert C, Jonas S, Cramer T, Von Marschall Z, Schäfer G, Peters M, Wagner K, Radke C, Wiedenmann B, Neuhaus P, et al. 2003. Transforming growth factor β1 stimulates vascular endothelial growth factor gene transcription in human cholangiocellular carcinoma cells. Cancer Res. 63:1083–1092.
- Benjamini Y, Hochberg Y. 1995. Controlling the false discovery rate: a practical and powerful approach to multiple testing. J R Stat Soc Ser B. 57:289–300.
- Bodine SC, Latres E, Baumhueter S, Lai VK, Nunez L, Clarke BA, Poueymirou WT, Panaro FJ, Na E, Dharmarajan K, et al. 2001. Identification of ubiquitin ligases required for skeletal muscle atrophy. Science. 294:1704–1708.
- Brunet A, Park J, Tran H, Hu LS, Hemmings BA, Greenberg ME. 2001. Protein kinase SGK mediates survival signals by phosphorylating the forkhead transcription factor FKHRL1 (FOXO3a). Mol Cell Biol. 21:952–965.
- Cui H-X, Liu R-R, Zhao G-P, Zheng M-Q, Chen J-L, Wen J. 2012. Identification of differentially expressed genes and pathways for intramuscular fat deposition in pectoralis major tissues of fast-and slow-growing chickens. BMC Genom. 13:213.
- Davis AJ, Austic RE. 1997. Dietary protein and amino acid levels alter threonine dehydrogenase activity in hepatic mitochondria of Gallus domesticus. J Nutr. 127:738–744.
- Davis RV, Lamont SJ, Rothschild MF, Persia ME, Ashwell CM, Schmidt CJ. 2015. Transcriptome analysis of post-hatch breast muscle in legacy and modern broiler chickens reveals enrichment of several regulators of myogenic growth. PLoS One. 10:e0122525.
- Dieffenbach C, SenGupta DN, Krause D, Sawzak D, Silverman RH. 1989. Cloning of murine gelsolin and its regulation during differentiation of embryonal carcinoma cells. J Biol Chem. 264:13281–13288.
- Dogan A, Lasch P, Neuschl C, Millrose MK, Alberts R, Schughart K, Naumann D, Brockmann GA. 2013. ATR-FTIR spectroscopy reveals genomic loci regulating the tissue response in high fat diet fed BXD recombinant inbred mouse strains. BMC Genom. 14:386.
- Dunning KR, Anastasi MR, Zhang VJ, Russell DL, Robker RL. 2014. Regulation of fatty acid oxidation in mouse cumulus-oocyte complexes during maturation and modulation by PPAR agonists. PLoS One. 9:e87327.
- Dveksler G, Basile A, Dieffenbach C. 1992. Analysis of gene expression: use of oligonucleotide primers for glyceraldehyde-3-phosphate dehydrogenase. Genome Res. 1:283–285.
- Guernec A, Berri C, Chevalier B, Wacrenier-Cere N, Le Bihan-Duval E, Duclos M. 2003. Muscle development, insulin-like growth factor-I and myostatin mRNA levels in chickens selected for increased breast muscle yield. Growth Horm. IGF Res. 13:8–18.
- Hall SJG, Bradley DG. 1995. Conserving livestock breed biodiversity. Trends Ecol Evol. 10:267–270.
- Hart T, Komori HK, LaMere S, Podshivalova K, Salomon DR. 2013. Finding the active genes in deep RNA-seq gene expression studies. BMC Genom. 14:778.
- Herd R, Arthur P. 2009. Physiological basis for residual feed intake. J Anim Sci. 87:E64–E71.
- Hu P, Geles KG, Paik J-H, DePinho RA, Tjian R. 2008. Codependent activators direct myoblast-specific MyoD transcription. Dev Cell. 15:534–546.
- Huang da W, Sherman BT, Lempicki RA. 2009. Systematic and integrative analysis of large gene lists using DAVID bioinformatics resources. Nat Protoc. 4:44–57.
- Huang Y, Chain FJJ, Panchal M, Eizaguirre C, Kalbe M, Lenz TL, Samonte IE, Stoll M, Bornberg‐Bauer E, Reusch TB, et al. 2016. Transcriptome profiling of immune tissues reveals habitat‐specific gene expression between lake and river sticklebacks. Mol Ecol. 25:943–958.
- Ihaka R, Gentleman R. 1996. R: a language for data analysis and graphics. J Comput Graph Stat. 5:299–314.
- Kawakami Y, Rodriguez-León J, Belmonte J. 2006. The role of TGFbetas and Sox9 during limb chondrogenesis. Curr Opin Cell Biol. 18:723–729.
- Kim D, Langmead B, Salzberg SL. 2015. HISAT: a fast spliced aligner with low memory requirements. Nat Methods. 12:357–360.
- Kohroki J, Nishiyama T, Nakamura T, Masuho Y. 2005. ASB proteins interact with Cullin5 and Rbx2 to form E3 ubiquitin ligase complexes. FEBS Lett. 579:6796–6802.
- Lagirand-Cantaloube J, Cornille K, Csibi A, Batonnet-Pichon S, Leibovitch MP, Leibovitch SA. 2009. Inhibition of atrogin-1/MAFbx mediated MyoD proteolysis prevents skeletal muscle atrophy in vivo. PloS One. 4:e4973.
- Lange S, Perera S, Teh P, Chen J. 2012. Obscurin and KCTD6 regulate cullin-dependent small ankyrin-1 (sAnk1.5) protein turnover. Mol Biol Cell. 23:2490–2504.
- Leask A, Abraham DJ. 2004. TGF-beta signaling and the fibrotic response . FASEB J. 18:816–827.
- Li ZB, Kollias HD, Wagner KR. 2008. Myostatin directly regulates skeletal muscle fibrosis. J Biol Chem. 283:19371–19378.
- Michalik L, Auwerx J, Berger JP, Chatterjee VK, Glass CK, Gonzalez FJ, Grimaldi PA, Kadowaki T, Lazar MA, O'Rahilly S, et al. 2006. International Union of Pharmacology. LXI. Peroxisome proliferator-activated receptors. Pharmacol Rev. 58:726–741.
- Moussad EE-D, Brigstock DR. 2000. Connective tissue growth factor: what's in a name? Mol Genet Metab. 71:276–292.
- Mullen AJ, Barton PJ. 2000. Structural characterization of the human fast skeletal muscle troponin I gene (TNNI2). Gene. 242:313–320.
- Palmieri O, Mazza T, Merla A, Fusilli C, Cuttitta A, Martino G, Latiano T, Corritore G, Bossa F, Palumbo O, et al. 2016. Gene expression of muscular and neuronal pathways is cooperatively dysregulated in patients with idiopathic achalasia. Sci Rep. 6:31549.
- Periasamy M, Reed TD, Liu LH, Ji Y, Loukianov E, Paul RJ, Nieman ML, Riddle T, Duffy JJ, Doetschman T, et al. 1999. Impaired cardiac performance in heterozygous mice with a null mutation in the sarco(endo)plasmic reticulum Ca2+-ATPase isoform 2 (SERCA2) gene . J Biol Chem. 274:2556–2562.
- Prasad V, Boivin GP, Miller ML, Liu LH, Erwin CR, Warner BW, Shull GE. 2005. Haploinsufficiency of Atp2a2, encoding the sarco (endo) plasmic reticulum Ca2+-ATPase isoform 2 Ca2+ pump, predisposes mice to squamous cell tumors via a novel mode of cancer susceptibility. Cancer Res. 65:8655–8661.
- Remignon H, Gardahaut M, Marche G, Ricard F. 1995. Selection for rapid growth increases the number and the size of muscle fibres without changing their typing in chickens. J Muscle Res Cell Motil. 16:95–102.
- Richard D, Lin Q, Timofeeva E. 2002. The corticotropin-releasing factor family of peptides and CRF receptors: their roles in the regulation of energy balance. Eur J Pharmacol. 440:189–197.
- Ricort JM, Binoux M. 2001. Insulin-like growth factor (IGF) binding protein-3 inhibits type 1 IGF receptor activation independently of its IGF binding affinity. Endocrinology. 142:108–113.
- Salarpour A, Rahmatnejad E, Khotanlou H. 2015. Modelling broilers' abdominal fat in response to dietary treatments. J Anim Physiol Anim Nutr. 99:237–243.
- Sandri M, Sandri C, Gilbert A, Skurk C, Calabria E, Picard A, Walsh K, Schiaffino S, Lecker SH, Goldberg AL. 2004. Foxo transcription factors induce the atrophy-related ubiquitin ligase atrogin-1 and cause skeletal muscle atrophy. Cell. 117:399–412.
- Savary K, Michaud A, Favier J, Larger E, Corvol P, Gasc J-M. 2005. Role of the renin-angiotensin system in primitive erythropoiesis in the chick embryo. Blood. 105:103–110.
- Schmidt-Strassburger U, Schips TG, Maier HJ, Kloiber K, Mannella F, Braunstein KE, Holzmann K, Ushmorov A, Liebau S, Boeckers TM, et al. 2012. Expression of constitutively active FoxO3 in murine forebrain leads to a loss of neural progenitors. FASEB J. 26:4990–5001.
- Schmittgen TD, Livak KJ. 2008. Analyzing real-time PCR data by the comparative C(T) method. Nat Protoc. 3:1101.
- Schoenauer R, Lange S, Hirschy A, Ehler E, Perriard J-C, Agarkova I. 2008. Myomesin 3, a novel structural component of the M-band in striated muscle. J Mol Biol. 376:338–351.
- Trapnell C, Roberts A, Goff L, Pertea G, Kim D, Kelley DR, Pimentel H, Salzberg SL, Rinn JL, Pachter L. 2012. Differential gene and transcript expression analysis of RNA-seq experiments with TopHat and Cufflinks. Nat Protoc. 7:562–578.
- Webster EL, Torpy DJ, Elenkov IJ, Chrousos GP. 1998. Corticotropin-releasing hormone and inflammation . Ann NY Acad Sci. 840:21–32.
- Yi G, Yuan J, Bi H, Yan W, Yang N, Qu L. 2015. In-depth duodenal transcriptome survey in chickens with divergent feed efficiency using RNA-Seq. PloS One. 10:e0136765.
- Yin H, Zhang S, Gilbert E, Siegel P, Zhu Q, Wong E. 2014. Expression profiles of muscle genes in postnatal skeletal muscle in lines of chickens divergently selected for high and low body weight. Poult Sci. 93:147–154.
- Yoon BS, Lyons KM. 2004. Multiple functions of BMPs in chondrogenesis. J Cell Biochem. 93:93–103.
- Yousefi Zonuz A, Alijani S, Mohammadi H, Rafat A, Daghigh Kia H. 2013. Estimation of genetic parameters for productive and reproductive traits in Esfahan native chickens. J Livestock Sci Technol. 1:34–38.
- Zhang Y, Li D, Han R, Wang Y, Li G, Liu X, Tian Y, Kang X, Li Z. 2017. Transcriptome analysis of the pectoral muscles of local chickens and commercial broilers using Ribo-Zero ribonucleic acid sequencing. PloS One. 12:e0184115.
- Zheng Q, Zhang Y, Chen Y, Yang N, Wang X-J, Zhu D. 2009. Systematic identification of genes involved in divergent skeletal muscle growth rates of broiler and layer chickens. BMC Genom. 10:87.
- Zhou N, Lee WR, Abasht B. 2015. Messenger RNA sequencing and pathway analysis provide novel insights into the biological basis of chickens' feed efficiency. BMC Genom. 16:195.
- Zuzarte-Luıs V, Montero J, Rodriguez-Leon J, Merino R, Rodrıguez-Rey J, Hurle J. 2004. A new role for BMP5 during limb development acting through the synergic activation of Smad and MAPK pathways. Dev Biol. 272:39–52.