
Abstract
The aim of the study was to determine the effect of Bacillus cereus var. toyoi (200 mg/kg) and mannan oligosaccharide (MOS, 2 g/kg) in T-2 toxin exposed rabbits. Weaned rabbits (35 days of age) were assigned into four experimental groups (n = 20 in each): control (C), B. cereus (B), MOS (M) and B. cereus+MOS (BM) group. At 49 days of age, rabbits were divided into two groups (n = 10 in each), and half of the C, B, M and BM rabbits were fed with the same diet as before, but contaminated with 2 mg/kg feed T-2 toxin (groups CT, BT, MT and BMT). On day 50 and 60, rabbits were injected with ovalbumin. At 70 days of age, all animals were sacrificed. Daily weight gain was smaller in toxin challenged animals (17.6–19.5 g) compared to controls (29.7 g). Serum total protein concentration was less in toxin treated animals, among them in CT group (49.7 g/L) it decreased underneath the reference range. T-2 increased the glutathione peroxidase activity in the kidney. C and B treatments resulted in the highest IgG production. Phagocytic activity was the lowest in CT animals (76.4%), while the highest in C and BM groups (82%). Cytokine expression in the intestinal mucosa was lower in T-2 exposed animals as compared to their relevant controls. None of the feed additives had any effect on the T-2 induced changes in the oxidative stress and immune response. T-2 had slight genotoxic effect on lymphocytes, which was alleviated by MOS and B. cereus.
The suspected protective effect of Bacillus cereus var. toyoi and mannan oligosaccharide was investigated in T-2 toxin exposed rabbits.
T-2 impaired immune response and was slightly genotoxic on lymphocytes.
MOS and B. cereus alleviated the genotoxicity of T-2.
Highlights
Introduction
T-2 toxin is produced mainly by Fusarium nivale, F. oxysporum, F. poae, F. sporotrichioides and F. solani (Schuhmacher-Wolz et al. Citation2010). It is the most toxic member of the group of type A trichothecenes present worldwide. The main biochemical modes of action of T-2 toxin are inhibition of protein, RNA and DNA synthesis, furthermore induction of lipid peroxidation (Rocha et al. Citation2005; Battilani et al. Citation2009). The Scientific Panel on Contaminants in the Food Chain (CONTAM panel) of the European Food Safety Authority (EFSA) established a tolerable daily intake (TDI) of 100 ng/kg bw for the sum of T-2 and HT-2 toxins. The Commission’s recommendation (2013/165/EU) on the presence of T-2 and HT-2 toxin is 500 µg/kg for cereal products and compound feed. According to the most recent survey of BIOMIN GmBH, 46% of the feed samples tested in Central Europe contained T-2. In Europe, the average contamination of the samples was low (65 µg/kg, n = 2053) and only 8% of the samples were contaminated above the risk threshold (BIOMIN Citation2018).
T-2 frequently occurs in rabbit feeds as well (Greco et al. Citation2012). T-2 was thoroughly studied in rabbits by Fekete et al. (Citation1989), who described emaciation, gastritis and necrosis in the lymphoid organs (intestinal mucosa, spleen and lymph nodes). Changes in haematological parameters, hepatocellular necrosis and tubulonephrosis have also been observed (Glávits et al. Citation1989). Sublethal T-2 intake caused reproductive disorders both in female (Fekete and Huszenicza Citation1993) and male rabbits (Kovács et al. Citation2013).
Feed contaminants are directly exposed to gut microbiota. Feed additives influencing the composition and activity of the gut microbiota may affect the fate of mycotoxins in the gut and their detrimental effects as a consequence. Such widely used feed additives are pro- and prebiotics. Studies showed that probiotic bacteria can remove mycotoxins by physical binding (El-Nezami et al. Citation2000). The most frequently used lactic acid bacteria (LAB) have been studied for their potential to either degrade mycotoxins or reduce their bioavailability (El-Nezami et al. Citation2002). The addition eubacteria to the DON contaminated feed of the broilers effectively alleviated the alterations caused by DON in the small intestinal morphology and electrophysiological parameters of the gut (Awad et al. Citation2006). Bacillus cereus var. toyoi has been reported to contribute to higher weight gain, improved feed conversion ratio and lower mortality rate in livestock (Taras et al. Citation2005; Trocino et al. Citation2005) and it has positive effects on productivity of intensive rabbit production (Pinheiro et al. Citation2007). It may be immunogenic, as consuming probiotic containing diet enhanced vaccine efficacy in mice, swine, poultry and sheep (Coppola et al. Citation2005; Schierack et al. Citation2007; Roos et al. Citation2010, Citation2012).
Mannan oligosaccharides (MOSs) are widely used in animal feeds to improve gastrointestinal health and performance (Spring et al. Citation2015). They can be obtained from the cell wall of the yeast Saccharomyces cerevisiae. MOS is able to bind to the mannose receptors on the type 1 fimbriae of some pathogen bacteria (such as Escherichia coli and Salmonella enteritidis) in order to prevent their attachment to intestinal mucosa (Firon et al. Citation1983; Spring et al. Citation2000). Due to their interaction with microbes, MOS could have an effect on intestinal microbiota. The immunomodulatory effect of MOS has also been thoroughly studied in laboratory animals and livestock (Halas and Nochta Citation2012). Increased gut mucosal secretory IgA and blood IgG level, altered cytokine production, more pronounced responsiveness of lymphocytes on non-specific mitogens (e.g. ConA and PHA) were experienced (Halas and Nochta Citation2012). However, the direct or indirect effect has not been clarified yet.
According to our hypothesis immunosuppression, oxidatives stress and genotoxicity as a consequence caused by T-2 toxin exposure can be mitigated by certain feed additives used for growth promoting, such as probiotics or MOS having shown immunomodulatory effects. The aim of our study was therefore to determine the possible protective effect of B. cereus var. toyoi and/or MOS in T-2 exposed rabbits on immune response, antioxidant status and the rate of DNA damage.
Materials and methods
Animal treatment schedule
Weaned (35 days of age, 1524 ± 90 g live weight) Pannon white rabbits were randomly assigned into four experimental groups (n = 20 in each): control (C), B. cereus (B), MOS (M) and B. cereus+MOS (BM) group. The groups were organised to be homogenous for initial body weight (bw). In group B, M and BM, the feed was completed with B. cereus var. toyoi (Toyocerin®, Asahi Vet. S.A., Barcelona, Spain, 200 mg/kg, containing 2 × 10⁵/g Bacillus cereus var. toyoi spore), 2 g/kg MOS (Bio-Mos®, Alltech Hungary, Budapest, Hungary) or both combined. Doses were chosen according to our preliminary results (Bónai et al. Citation2008), and data available in the literature (Mourão et al. Citation2006; Guedes et al. Citation2009).
After 14 days, at 49 days of age each group was divided into two sub-groups. Half of the animals fed with C, B, M or BM diet received thereafter the same diet but contaminated with 2 mg/kg feed T-2 toxin for 21 days (Table ). The basal diet of all groups contained 16.6% crude protein, 3.2% crude fat, 8% ash, 18.8% crude fibre and 10% starch. Neutral detergent fibre (NDF), acid detergent fibre (ADF) and acid detergent lignin (ADL) content were 37.5, 22.6 and 4.8, respectively. Diets were non-medicated and did not include coccidiostatic compound.
Table 1. Experimental groups and diets.
T-2 toxin was produced experimentally on corn grits by Fusarium sporotrichioides strain NRRL 3299, as described by Fodor et al. (Citation2006). The fungal culture was mixed into the basal feed of the experimental animals, so as to provide contaminated feed with 2 mg/kg feed T-2 toxin. The final mycotoxin concentration of the control and the experimental feeds was determined with LC–MS (Shimadzu, Kyoto, Japan). The limit of detection (LOD) for T-2 was 10 µg/kg. The diet fed to the control group did not contain detectable amounts of T-2 and none of the diets contained detectable amounts of fumonisin B1, deoxynivalenol and zearalenone.
Growing rabbits were housed in two-level wire mesh cages (2 kits/cage throughout the experiment) in a closed building. Average temperature ranged from 21 to 29 °C, the light was on between 05:00 a.m. and 09:00 p.m., and the farm had overpressure ventilation.
Body weight was measured individually while feed intake based on the cage unit, weekly.
At 50 days of age, all rabbits (except 10 animals from the control group, which were kept as not vaccinated controls) were injected intraperitoneally with 100 µg/animal ovalbumin (OVA, Sigma-Aldrich, Budapest, Hungary), dissolved in 400 µL phosphate-buffered saline (PBS, Sigma-Aldrich, Budapest, Hungary) and 400 µL incomplete Freund’s adjuvant (Sigma-Aldrich, Budapest, Hungary). Vaccination was repeated after 10 days.
At the end of the experiment (at 70 days of age), animals were sacrificed by bleeding after sedation. Weight of the liver, kidneys, spleen and appendix were registered. Blood samples were taken for blood biochemistry, immune response, antioxidant status and comet assay. Mucosa sample from the proximal part of the duodenum (approx. 5 cm from the pylorus) was taken for cytokine detection.
Chemical analysis of the diets
Chemical composition of the diet was analysed following the recommendations of the Association of Official Analytical Chemists (AOAC 2000): dry matter (930.15), crude protein (Kjeldahl method, 976.05), crude fat (920.39), ash (942.05), crude fibre (978.10) and total starch (996.11). Neutral detergent fibre, ADF and ADL content were determined according to ISO 16472:2006 and ISO 13906:2008.
Blood biochemistry
The concentration of total protein (TP), albumin (ALB), glucose (G), total cholesterol (CHOL), urea, creatinine (CREA) and the activity of alanine aminotransferase (ALT), aspartate aminotransferase (AST), gamma-glutamyl transferase (GGT) and alkaline phosphatase (ALKP) were determined (Vet-Med Laboratory, Budapest, Hungary), using Roche Hitachi 912 Chemistry Analyser (Hitachi, Tokyo, Japan) and commercial diagnostic reagent kits (Diagnosticum Ltd., Budapest, Hungary).
Antioxidant parameters
Antioxidant parameters were measured in the liver and kidney. Lipid peroxidation was determined by the quantification of malondialdehyde (MDA) levels with 2-thiobarbituric acid method (Placer et al. Citation1966) in the 10-fold volume of tissue homogenate in physiological saline. In the liver, conjugated dienes (CD) and trienes (CT) were also measured according to the AOAC (Citation1984) method. The amount of reduced glutathione (GSH) and glutathione peroxidase (GPx) activity was measured in the 10,000 g supernatant fraction of tissue homogenate. The amount of GSH was measured by the method of Sedlak and Lindsay (Citation1968) and the activity of GPx according to Lawrence and Burk (Citation1978). GSH concentration and GPx activity were calculated to protein content of the 10,000 g supernatant which was measured by the Folin-phenol reagent (Lowry et al. Citation1951).
Immune parameters
For the determination of number of phagocytic cells and phagocytic activity (PA), white blood cells were separated from heparinised blood, resuspended in Dulbecco's minimum essential medium (DMEM, Sigma-Aldrich, Budapest, Hungary) then placed into tissue culture flasks and incubated at 37 °C for 12 hours. Non-adherent cells were removed by rinsing three times with PBS. Adherent cells were incubated further for 12 hours in DMEM and harvested using ice cold PBS. The number of cells was counted by haemocytometer. Phagocytic cells were then seeded to six-well tissue culture plates and incubated in a humidified atmosphere of 5% CO2 for 12 hours at 37 °C to allow attachment, as described by Simpson et al. (Citation1979). PA was determined with Congo-red stained yeast cells by incubating overnight at 37 °C and expressed as percentage of phagocytic cells quantified from 100 cells observed under a microscope.
OVA-specific immunoglobulin G (IgG) was determined from the blood plasma using microtiter plates (Sigma-Aldrich, Budapest, Hungary) coated with 100 µL of ovalbumin solution (10 µg/mL ovalbumin in PBS) per each well, incubated overnight at 4 °C in a humidified environment. Excess protein was removed by washing with 3 × 150 µL PBS-Tween 20 (Sigma-Aldrich, Budapest, Hungary). Plasma samples were twofold serially diluted in the washing solution, starting with 1:50, in a separate plate. Aliquots of 100 µL of each dilution (1:50 and 1:100) were transferred to the microtiter plate and incubated for one hour at room temperature. Wells were washed again three times with PBS-Tween and anti-swine IgG-HRPO conjugate (Sigma-Aldrich, Budapest, Hungary, 1:25,000) was added to each well, followed by incubation at RT for one hour. The wash step was then repeated and the substrate (3,3′,5,5′-tetramethylbenzidine, Sigma-Aldrich, Budapest, Hungary) added. Optical density was measured in an ELISA reader at 450 nm.
Interferon-γ (IFN-γ) and interleukin-2 (IL-2) were measured from the blood and the gut mucosa by real-time quantitative PCR, detecting mRNA of IL-2 and IFN-γ. For total RNA isolation, the Analytik Jena innuPREP Blood RNA Kit (Biometra, Analytik Jena AG, Jena, Germany) was used, following the instructions of the manufacturer. RNA templates were transcribed into cDNA by the Maxima First Strand cDNA Synthesis Kit for RT-qPCR (Fermentas, Vilnius, Lithuania) according to the protocol of the manufacturer. Amplification using cytokine specific primers was performed in an Eppendorf Realpex2 Mastercycler. Primers for IL-2 were designed using the Primer3 Programme (Rozen and Skaletsky Citation2000) and available GenBank sequences. For IFN-γ, published primers (Godornes et al. Citation2007) were used. The PCR reactions were as follows: preheating at 95 °C for 5 min, 40 cycles of 54 °C for 30 s and 72 °C for 45 s, followed by a final extension step of 72 °C for 7 min.
Cloned cytokine DNA was used as control, and diluted tenfold from 10−1 to 10−8. The relative amounts were determined by comparing Ct (cycle threshold, the number of cycles required for the fluorescent signal to cross the threshold) values to the standard curve of the amplified control DNA (Ct levels are inversely proportional to the amount of target nucleic acid in the sample, i.e. the lower the Ct level the greater the amount of target nucleic acid in the sample).
Comet assay
Fifty microlitres heparinised blood was added to 1 mL 1% low melting agarose gel in Eppendorf tubes on 37 °C. The suspension was mixed gently and two drops (140 µL) were transferred to slides previously coated with 1% normal melting point agarose. Cell membrane was lysed with lysis buffer solution (1% Triton X-100, 2.5 M NaCl, 10 mM Tris, 0.1 M EDTA, pH 10) for one hour at 4 °C. Following the lysis, the slides were placed in alkaline electrophoresis buffer (pH 13) in an electrophoresis tank (Cleaver Scientific Ltd., Warwickshire, UK) for 40 min at 4 °C, followed by electrophoresis at 25 V (300 mA) for 30 minutes at 4 °C. The slides were then placed in neutralising buffer (pH 7.5) and washed three times for five minutes, followed by a final wash in double distilled water for a further five minutes. The slides were then left to dry overnight and stained with ethidium bromide (30 µL) and covered with cover slips. For visualisation, Alpha-Optika B-600 TiFL fluorescent microscope (Elektro-Optika, Budapest, Hungary) was used where 200 cells per sample were scored.
Manual scoring was done by the following methods of Singh et al. (Citation1988) and Collins et al. (Citation1997) in which comets are classified into ‘0’, ‘1’, ‘2’, ‘3’ and ‘4’ according to the relative intensity of DNA fluorescence in the tail. Fully disintegrated cells obtained the score of ‘5’. Two hundred cells per samples were scored according to the move or shape of the comet that was formed (Hartmann et al. Citation2003).
Statistical analysis
Statistical analyses were carried out using SPSS 19 software (SPSS Inc., Chicago, IL, USA). Differences among groups were investigated using one-way ANOVA followed by post hoc Tukey’s test for group-wise comparisons. Differences were considered as significant if p < .05. Data obtained from the comet assay were not normally distributed; therefore, the non-parametric chi-squared test was used to compare the different groups.
Results
Production parameters
Final bw (on 70 days of age), just like feed intake and weight gain between 49 and 70 days of age was smaller in toxin treated animals (CT, BT, MT, BMT) compared to controls (C) (Table ). The worst feed conversion was recorded also in the toxin treated groups, especially in those supplemented with MOS and probiotic + MOS (MT and BMT groups). MOS by itself and in combination with B. cereus affected positively bw and weight gain, and though it increased feed consumption as well, resulted in better feed conversion compared to control animals (group C). B. cereus by itself did not have any significant effect on production traits.
Table 2. Production parameters of rabbits measured between 49 and 70 days of age (means, SE).
Organ weights
Relative organ weights (organ weight/bw × 100) were calculated to detect difference in the growth of organs, and to compare the effect of treatments independently from their effect on bw (data not shown). Treatment effect could be demonstrated only in case of the kidney; however, the level of significance was only 0.06. The relative weight of the kidneys was greater (0.78 and 0.79%, respectively) in MOS and MOS+B. cereus treated animals receiving T-2 (MT and BMT animals) than in the other groups (0.69–0.72%).
Blood biochemistry
Among the blood clinical biochemical parameters significant treatment effect was found in case of TP, ALB and ALKP (Table ). T-2 treatment resulted in less TP and ALB when toxin treated groups compared to their relevant controls (i.e. CT to C, BT to B, MT to M and BMT to BM, p < .001). B. cereus along and together with MOS resulted in more plasma TP compared to control (C) animals. ALKP activity was also lower due to T-2 challenge, but the difference was significant only when comparing BM to BMT and MT to C (p < .001).
Table 3. Blood clinical biochemical parameters affected by treatments, examined at the end of the experiment (70 days of age) (means, SE).
Antioxidant parameters
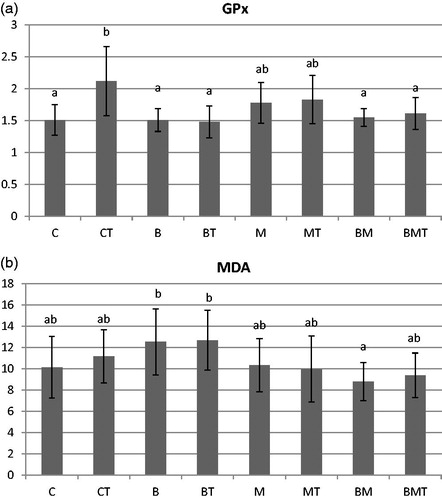
Among parameters measured for the antioxidant capacity and lipid peroxidation in the liver (GSH, GPx, MDA, CD and CT) and kidney (GSH, GPx and MDA), only GPx and MDA showed significant treatment effect in the kidney (Figure ). Only T-2 (CT) increased significantly the activity of GPx compared to control, all other treatments resulted in similar values, without significant differences. B and BT groups provided the highest MDA concentrations, but the difference was significant only when compared to BM, the latter resulting in the lowest MDA production.
Figure 1. (a) Glutathione-peroxidase activity (GPx, U/g 10,000 g supernatant protein) and (b) malondialdehyde concentration (MDA, µmol/g wet weight) in the kidney examined at the end of the experiment (70 days of age). C: control; CT: control + T-2; B: B. cereus; BT: B. cereus+T-2; M: MOS; MT: MOS + T-2; BM: B. cereus+MOS; BMT: B. cereus+MOS + T-2. n = 6/group; MOS: mannan oligosaccharide; T-2: T-2 toxin. a,bSignificant (p < .05) differences between treatments.
Immune response
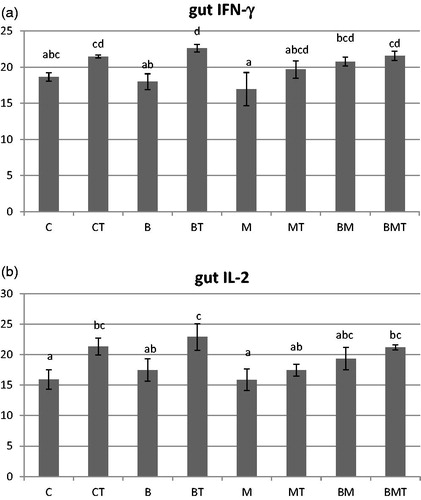
In control (C) and B. cereus (B) treated animals significantly more specific IgG was produced than in the T-2 treated ones (CT) (Figure ). Other treatments did not induce significant difference. Phagocytic activity was also the lowest in CT animals, while the highest in C and BM groups. Treatments influenced the two measured cytokines’ production in the gut in a similar way (Figure ). Toxin contamination (CT, BT, BMT) resulted in less IFN-γ level compared to B. cereus (B) and MOS (M) supplementation. In all animals, T-2 downregulated IFN-γ production compared to their relevant control groups, but the difference was not consistently significant. Values between the toxin treated animals (CT, BT, MT and BMT) did not differ significantly. Similarly, T-2 decreased IL-2 production in the gut; differences were significant between C and CT, B and BT, C and BT, BMT. Significant difference between contaminated animals occurred in case of BT and MT.
Figure 2. (a) OVA-specific IgG concentration (mg/mL) of the blood plasma and (b) phagocytic activity (%) of the macrophage cells isolated from the blood at the end of the experiment (70 days of age). C: control; CT: control + T-2; B: B. cereus; BT: B. cereus+T-2; M: MOS; MT: MOS + T-2; BM: B. cereus+MOS; BMT: B. cereus+MOS + T-2. n = 6/group; MOS: mannan oligosaccharide; T-2: T-2 toxin. a,bSignificant (p<.05) differences between treatments.
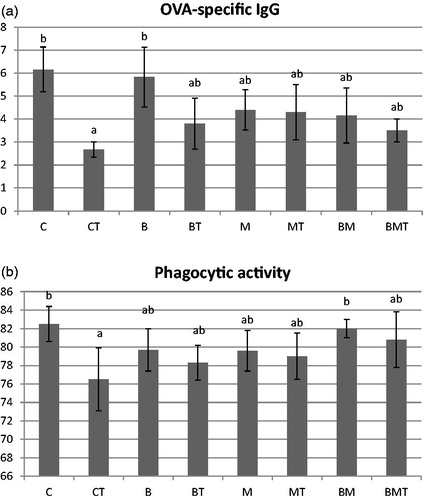
Figure 3. (a) Interferon-γ and (b) interleukin-2 measured from the gut mucosa at the end of the experiment (70 days of age). Results are given as Ct (cycle threshold) values. C: control; CT: control + T-2; B: B. cereus; BT: B. cereus+T-2; M: MOS; MT: MOS + T-2; BM: B. cereus+MOS; BMT: B. cereus+MOS + T-2. n = 6/group; MOS: mannan oligosaccharide; T-2: T-2 toxin. a,b,c,dSignificant (p<.05) differences between treatments.
DNA damage
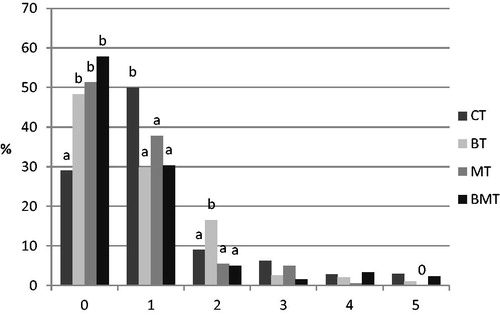
All samples from not intoxicated animals (C, B, M, BM) were negative in the test, i.e. above 90% of the cells were scored as ‘0’; therefore, only toxin effect is shown in Figure . Significant difference between groups was detected in the frequency of the intact and slightly or moderately damaged cells (scored as 0, 1 and 2). In CT animals, only 29% of the cells provided zero score value (i.e. not affected by the toxin), while MOS alone and in combination with B. cereus resulted in higher intact (51.3 and 57.8%) cell proportion. B. cereus caused stronger DNA damage in toxin contaminated animals (BT), as shown by the significantly higher frequency of cells scored as 2 compared to the other three groups (CT, MT, BMT).
Figure 4. Results of the comet assay performed with lymphocytes isolated from the toxin treated animals at the end of the experiment (70 days of age). Results are expressed as frequency (%) of the comets classified into 0–5 scores according to the severity of DNA damage. CT: control + T-2; BT: B. cereus+T-2; MT: MOS + T-2; BMT: B. cereus+MOS + T-2. n = 100 cell/animal, n = 6 animal/group. a,bSignificant (p<.05) differences between treatments. 0: no cell classified to that category.
Discussion
Taking bw and feed intake data into consideration, 2 mg/kg feed represented 124 μg/kg bw daily T-2 exposure at the beginning of the toxin administration, which thereafter decreased to approximately 100 μg/kg bw toxin intake by the end of the experiment, because of the feed refusal effect of T-2.
The lowest bw and gain due to T-2 exposure compared to control animals was the result of the decreased feed intake (Wang et al. Citation1993; Wu et al. Citation2015). According to the results of our previous study, the No Observed Adverse Effect Level (NOAEL) of T-2 for adult rabbit males was found to be 20 μg/kg bw/day, which did not cause depression in production parameters (Kovács et al. Citation2013).
While the probiotic (B) was ineffective, MOS alone and in combination with the probiotic improved production traits. Results of efficacy of feed additives in rabbits are quite controversial (Bersényi and Gippert Citation1995; Mourão et al. Citation2006; Ayyat et al. Citation2018). MOS supplementation in the diet, especially at 1.0 g/kg dose level, improved immunity, health indicators in the blood, live and carcass weight of rabbits (Abdel-Hamid and Farahat Citation2016).
Blood biochemistry
It should be noted, that all values were within the physiological reference ranges, which are 54–75 g/L for TP and 27–50 g/L for ALB (Harcourt-Brown Citation2002), except TP (49.7 g/L) in CT animals. For ALKP, the cited authors defined 10–70 U/L, which is much below the values obtained in present study; however, there is a wide variation between laboratory reference ranges for ALKP values in rabbits (e.g. 4.1–16.2 according to Collins Citation1988; and 112–350 as described by Harkness and Wagner Citation1995).
Similarly to our observation, significant increase in serum TP was recorded in growing rabbits fed diets supplemented with 3 g/kg MOS (Ayyat et al. Citation2018), in Japanese quail (Iqbal et al. Citation2018) and broiler chicken (Hussein and Selim Citation2018). According to Paryad and Mahmoudi (Citation2008), serum TP and ALB are directly responsive to protein intake and quality.
Hypo-albuminaemia can be feature of advanced liver diseases in all species. In our case, level of ALB remained within the physiological range and no other liver-specific parameters (ALT, AST, GGT, urea) supported any damage. Inadequate intake of amino acids available for protein synthesis as a result of T-2 induced feed refusal could depress the ability of liver to synthesise ALB. Hypo-proteinaemia and hypo-albuminaemia could also be due to the inactivation of biosynthetic enzymes and impairment of protein synthesis by T-2 (Bunner and Morris Citation1988).
A decrease in total serum ALKP activity due to T-2 exposure has already been reported in chickens following both per os (Chi et al. Citation1977) and intramuscular (Pearson Citation1978) administration, in per os dosed calves (Weaver et al. Citation1980), and in intravenous treated rabbits (Gentry and Cooper Citation1981). ALKP derives from the liver or the intestine. The observed decrease in its activity may reflect a reduction in enzyme/protein synthesis in the aforementioned organs.
Antioxidant and lipid peroxidation parameters
Oxidative stress is an important cytotoxic mechanism of trichothecenes (Doi and Uetsuka Citation2011). Pro-oxidant effects of T-2 toxin have been confirmed in several studies with measuring the amount of MDA as the end-product of lipid peroxidation, or analysing elements of the antioxidant defence system (e.g. GSH, GPx).
In the present study, T-2 activated the glutathione redox system (increased GPx activity) in the kidney, which could eliminate free radicals and thus protect lipids against peroxidation (no difference was found in MDA between C and CT animals). Interestingly, no alterations due to T-2 exposure in any of the measured parameters (GSH, GPx, MDA) was detected in the liver. In other studies similarly to our results, no oxidative response in the liver was observed even at high T-2 dose (10 and 13.5 mg/kg feed, respectively) in male broiler chickens (Frankic et al. Citation2006; Rezar et al. Citation2007), which might be due to the metabolising ability of T-2 toxin by the microsomal enzyme system in the liver.
Surprisingly, Bacillus cereus seemed to be pro-oxidant, which was prevented by MOS as it could be seen from the significantly more MDA production in B animals compared to BM, though probiotics are known to have natural antioxidant effect and may protect animals against oxidative damage (Abudabos et al. Citation2016).
Immune response
Both humoral and cellular immune response was compromised by 2 mg/kg T-2 in the diet, possibly because leukocytes are primary targets for trichothecene mycotoxins. It is known that T-2 induces apoptosis in various cell types with high proliferating activity, such as lymphoid cells (Doi et al. Citation2006). The synthesis of both DNA and RNA can also be inhibited by T-2 toxin as shown in several ex vivo and in vitro experiments (Schuhmacher-Wolz et al. Citation2010). Beside induction of apoptosis, inhibition of DNA and RNA synthesis, T-2 is cytotoxic to human monocytes, particularly monocytes in differentiation process (Schuhmacher-Wolz et al. Citation2010). These effects of T-2 explain the decreased IgG and cytokine production, and the lowered PA in our study. Compromised Ig production has been described in several studies, but not in rabbits. In a subacute toxicity study (Rafai et al. Citation1995), pigs were exposed to 0.5, 1, 2 or 3 mg/kg feed for 3 weeks. The synthesis of antibodies towards horse globulin decreased at all doses and at all sampling time points (7, 14 and 21 days). These results were later confirmed in a similar study of Meissonnier et al. (Citation2008). In pigs, a diet containing 3 mg/kg of T-2 toxin for 14 days also decreased significantly total serum IgG (Frankic et al. Citation2008).
In the present study, PA was also affected by T-2. Interestingly, when mice were pre-treated with high dose of T-2 (4 mg/kg bw) and thereafter vaccinated with sheep red blood cells (RBCs), PA increased. But when the toxin was administered after sensitisation, significantly suppressed phagocytosis of sheep RBC was observed (Wu et al. Citation2017).
Both cytokines (IFN-γ and IL-2) measured in this study revealed increased cytotoxic activity in toxin exposed animals. Evidence has shown that trichothecenes down regulate IFN-γ gene expression in pigs and rats, thereby reducing the host resistance to pathogens (Wu et al. Citation2018). For example, the exposure to T-2 toxin suppressed IFN-γ in Peyer’s patches of mice infected with reovirus (Li et al. Citation2006). The effect of T-2 proved to be dose dependent in vitro, at concentrations between 1 and 100 ng/mL it reduced the release of IL-2 and IFN-γ (p < .05, p < .001) in mouse peritoneal macrophages and T cells of the lymph node, while increase of IL-2 and IFN-γ was seen at concentrations below 1 ng/mL (Ahmadi and Riazipour Citation2008).
The impaired function of the lymphocytes (less IgG and cytokine production) could be partly attributable to the slight genotoxic effect of T-2 on blood peripheral lymphocytes (see below).
When B. cereus was tested in the search for increasing the efficiency of vaccines, B. toyoi probiotic supplementation increased IgG antibody levels. The activation of immune cells by the probiotic induced the production of cytokines (e.g. IFN-γ, IL-12 and IL-10) which might act as co-stimulatory factor for B cell proliferation and IgG production as a consequence (Roos et al. Citation2012). Probiotics are usually used continuously and in high dose (in feed or in drinking water). However in the study of Roos et al. (Citation2012), the most pronounced immunomodulatory effect of Toyocerin® was experienced already 30 days after its withdrawal and after the third vaccination. This led to the hypothesis that the pronounced effect was due to the response of central memory cells having been stimulated during the first and/or second vaccination.
In our case, MOS did not exert any effect on the immune parameters measured. The immunomodulatory effect of MOS has been thoroughly studied in pigs but no data related to rabbits are available. According to Guedes et al. (Citation2009) and Mourão et al. (Citation2006), 2 g/kg MOS was enough to influence growth and certain digestive parameters (production of volatile fatty acids and composition of the microbiota, length of the villi), but not to improve immune response.
DNA damage
Comet assay is widely used to evaluate DNA damage and repair, because the test is sensitive, simple and has relatively low cost. In vivo genotoxic effect of T-2 toxin on lymphocytes has been evinced by comet assay in broiler chickens (Frankic et al. Citation2006; Rezar et al. Citation2007; Sokolovic et al. Citation2007). In male crossbred pigs, 3 mg/kg T-2 toxin in the diet for 14 days increased the amount of DNA damage in peripheral blood lymphocytes by 27% (Frankic et al. Citation2008). In our study, rabbits were administered the toxin in lower concentration compared to the above cited studies. In this dose, T-2 proved to be slightly genotoxic, as DNA damage of the cells were only moderate shown by the low comet scores (score 1 and 2). Only less than 10% of the cells showed alteration classified as score 2, except in BT treatment. Since there was no significant change in the marker of oxidative stress (MDA) due to T-2, we assume that DNA damage was mostly induced by direct action and not through free radical formation and subsequent attack.
MOS single and in combination with B. cereus reduced, while B. cereus by itself increased the deteriorative effect of T-2. According to some data available, dietary fibre (such as glucomannans) has the property to bind mycotoxins (Meissonnier et al. Citation2009; Rabassa et al. Citation2010). On the other hand, due to the fibre fermentation in the hindgut mycotoxin concentration and bioaccessibility may increase in the colon (Meca et al. Citation2012).
Another possible way how MOS exerts protective effect against the genotoxic effect of T-2 may be its antioxidant property. Antioxidant and antimutagenic effects of yeast cell wall mannans were described by Križková et al. (Citation2001, Citation2006). This effect was not supported by our data, as no significant effect of MOS on GPx activity and MDA concentration was demonstrated.
It was strange to see that B. cereus potentiated the DNA damaging effect of T-2, but this was in accordance with the higher MDA level (B compared to C, not significant). However, MOS alleviated this effect (significantly less MDA in BM that B treatment), supposing antagonistic effect between the two feed additives.
Conclusions
It can be concluded that the applied dose of T-2 caused significant loss in production parameters, such as reduced bw gain and increased feed conversion ratio. While the probiotic was ineffective, MOS improved production parameters but could not mitigate the negative effect of T-2. According to the blood biochemistry parameters, the applied feed additives (alone or in combination) did not alter mycotoxin induced changes in TP, ALB and ALKP. In contrary, T-2 activated the glutathione redox system (increased GPx activity) in the kidney. Both humoral (IgG production) and cellular (PA, cytokine production) immune responses were compromised by T-2 in the diet. None of the feed additives had any effect on the T-2 induced changes in the oxidative stress and immune response. In 2 mg/kg in feed dose, T-2 proved to be slightly genotoxic. MOS alone and in combination with B. cereus reduced the DNA damaging effect of T-2.
Ethical statement
The research protocol was reviewed by the Animal Use and Care Administrative Advisory Committee and approved by the Agricultural Administrative Authority (Protocol No. SOI/31/254-3/2013).
Disclosure statement
No potential conflict of interest was reported by the authors.
Additional information
Funding
Related Research Data
References
- Abdel-Hamid TM, Farahat MH. 2016. Effect of dietary mannan-oligosaccharides on some blood biochemical, haematological parameters and carcass traits in purebred New Zealand White and crossbred rabbits. Anim Prod Sci. 56:2133–2139.
- Abudabos AM, Alyemni AH, Zakaria H. 2016. Effect of two strains of probiotics on the antioxidant capacity, oxidative stress, and immune responses of Salmonella-challenged broilers. Rev Bras Cienc Avic. 18:175–180.
- Ahmadi K, Riazipour M. 2008. Effects of T-2 toxin on cytokine production by mice peritoneal macrophages and lymph node T-cells. Iran J Immunol. 5:177–180.
- AOAC. 1984. Association of official analytical chemists: Arlington. 14th ed. Arlington (VA): AOAC.
- Awad WA, Böhm J, Razzazi-Fazeli E, Ghareeb K, Zentek J. 2006. Effect of addition of a probiotic microorganism to broiler diets contaminated with deoxynivalenol on performance and histological alterations of intestinal villi of broiler chickens. Poult Sci. 85:974–979.
- Ayyat MS, Sagheer AA, El-Latif KMA, Khalil BA. 2018. Organic selenium, probiotics, and prebiotics effects on growth, blood biochemistry, and carcass traits of growing rabbits during summer and winter seasons. Biol Trace Elem Res. 186:162.
- Battilani P, Costa LG, Dossena A, Gullino ML, Marchelli R, Galaverna G, Pietri A, Dall’Asta C, Giorni P, Spadaro D, et al. 2009. Scientific information on mycotoxins and natural plant toxicants. CFP/EFSA/CONTAM/2008/01. Scientific/Technical Report submitted to EFSA. http://www.efsa.europa.eu/de/scdocs/doc/24e.pdf
- Bersényi A, Gippert T. 1995. Effect of Bio-Mos supplementation upon the production traits of growing rabbits. First Egyptian Hungarian Poultry Conference; 17-19 September 1995, Alexandria, Egypt. p. 52–56.
- BIOMIN. 2018. World mycotoxin survey. The global threat. January to September 2018. https://info.biomin.net/acton/attachment/14109/f-0b34/1/-/-/l-0009/l-0009/REP_MTXsurvey_Quater_3_2018_EN_1018.pdf
- Bónai A, Szendrő Z, Matics Z, Fébel H, Pósa R, Tornyos G, Horn P, Kovács F, Kovács M. 2008. Effect of Bacillus cereus var. toyoi (Toyocerin®) on caecal microflora and fermentation in rabbits (in Hungarian). Hung Vet J. 130:87–95.
- Bunner DL, Morris ER. 1988. Alteration of multiple cell membrane functions in L-6 myoblasts by T-2 toxin: an important mechanism of action. Toxicol Appl Pharmacol. 92:113–121.
- Chi MS, Mirocha CJ, Kurtz HJ, Weaver G, Bates F, Shimoda W. 1977. Subacute toxicity of T-2 toxin in broiler chicks. Poult Sci. 56:306–313.
- Collins A, Dusinská M, Franklin M, Somorovská M, Petrovská H, Duthie S, Fillion L, Panayiotidis M, Raslová K, Vaughan N. 1997. Comet assay in human biomonitoring studies: reliability, validation, and applications. Environ Mol Mutagen. 30:139–146.
- Collins BR. 1988. Common diseases and medical management of rodents and lagomorphs. In: Jacobson ER, Kollias GV, editors. Contemporary issues in small animal practice: exotic animals. New York: Churchill Livingstone. p. 261–306.
- Coppola MM, Conceicăo FR, Gil-Turnes C. 2005. Effect of Saccharomyces boulardii and Bacillus cereus var. toyoi on the humoral and cellular response of mice to vaccines. Food Agric Immunol. 16:213–219.
- Doi K, Shinozuka J, Sehata S. 2006. T-2 toxin and apoptosis. J Toxicol Pathol. 19:15–27.
- Doi K, Uetsuka K. 2011. Mechanisms of mycotoxin-induced neurotoxicity through oxidative stress-associated pathways. Int J Mol Sci. 12:5213–5237.
- El-Nezami H, Chrevatidis A, Auriola S, Salminen S, Mykkänen H. 2002. Removal of common Fusarium toxins in vitro by strains of Lactobacillus and Propionibacterium. Food Addit Contam. 19:680–686.
- El-Nezami H, Mykkänen H, Kankaanpää P, Salminen S, Ahokas J. 2000. Ability of Lactobacillus and Propionibacterium strains to remove aflatoxin B1 from chicken duodenum. J Food Prot. 63:549–552.
- Fekete S, Huszenicza G. 1993. Effects of T-2 toxin on ovarian activity and some metabolic variables of rabbits. Lab Anim Sci. 43:646–649.
- Fekete S, Tamas J, Vanyi A, Glavits R, Bata A. 1989. Effect of T-2 toxin on feed intake, digestion and pathology of rabbits. Lab Anim Sci. 39:603–606.
- Firon N, Ofek I, Sharon N. 1983. Carbohydrate specificity of the surface lectins of Escherichia coli, Klebsiella pneumonia and Salmonella typhimurium. Carbohydr Res. 120:235–249.
- Fodor J, Németh M, Kametler L, Pósa R, Kovács M, Horn P. 2006. Novel methods of Fusarium toxins' production for toxicological experiments. Acta Agr Kaposv. 10:277–284.
- Frankic T, Pajk T, Rezar V, Levart A, Salobir J. 2006. The role of dietary nucleotides in reduction of DNA damage induced by T-2 toxin and deoxynivalenol in chicken leukocytes. Food Chem Toxicol. 44:1838–1844.
- Frankic T, Salobir J, Rezar V. 2008. The effect of vitamin E supplementation on reduction of lymphocyte DNA damage induced by T-2 toxin and deoxynivalenol in weaned pigs. Anim Feed Sci Technol. 141:274–286.
- Gentry PA, Cooper ML. 1981. Effect of Fusarium T-2 toxin on hematological and biochemical parameters in the rabbit. Can J Comp Med. 45:400–405.
- Glávits R, Vanyi A, Fekete S, Tamas J. 1989. Acute toxicological experiment of T-2 toxin in rabbits. Acta Vet Hung. 37:75–79.
- Godornes C, Leader BT, Molini BJ, Centurion-Lara A, Lukehart SA. 2007. Quantitation of rabbit cytokine mRNA by real-time RT-PCR. Cytokine. 38:1–7.
- Greco MV, Pardo AG, Ludemann V, Martino PE, Pose GN. 2012. Mycoflora and natural incidence of selected mycotoxins in rabbit and chinchilla feeds. Sci World J. 2012:1.
- Guedes CM, Mourão JL, Silva SR, Gomes J, Rodrigues MAM, Pinheiro V. 2009. Effects of age and mannanoligosaccharides supplementation on production of volatile fatty acids in the caecum of rabbits. Anim Feed Sci Technol. 150:330–336.
- Halas V, Nochta I. 2012. Mannan oligosaccharides in nursery pig nutrition and their potential mode of action. Animals (Basel). 2:261–274.
- Harcourt-Brown F. 2002. Textbook of rabbit medicine. Oxford (UK): Elsevier.
- Harkness JE, Wagner JE. 1995. Biology and medicine of rabbits and rodents. 5th ed. Philadelphia: Williams & Wilkins; p. 372.
- Hartmann A, Plappert U, Poetter F, Suter W. 2003. Comparative study with the alkaline Comet assay and the chromosome aberration test. Mutat Res. 536:27–38.
- Hussein E, Selim S. 2018. Efficacy of yeast and multi-strain probiotic alone or in combination on growth performance, carcass traits, blood biochemical constituents, and meat quality of broiler chickens. Livest Sci. 216:153–159.
- Iqbal MA, Roohi N, Khan O. 2018. Dietary supplemented effects of mannan-oligosaccharides on biochemical parameters of 4 close-bred flocks of Japanese quail breeders. Poultry Sci. 97(10):3718–3727.
- Kovács M, Tornyos G, Matics Z, Mezes M, Balogh K, Rajli V, Bloch-Bodnarzs Rusvai M, Mandoki M, Cseh S. 2013. Effect of chronic T-2 toxin exposure in rabbit bucks, determination of the No Observed Adverse Effect Level (NOAEL). Anim Reprod Sci. 137:245–252.
- Križková L, Duracková Z, Sandula J, Sasinková V, Krajcovic J. 2001. Antioxidative and antimutagenic activity of yeast cell wall mannans in vitro. Mutat Res. 497:213–222.
- Križková L, Žitňanova I, Mislovičová D, Masárová J, Sasinková V, Ďuračková Z, Krajčovič J. 2006. Antioxidant and antimutagenic activity of mannanneoglycoconjugates: mannan-human serum albumine and mannan-penicillin G acylase. Mutat Res. 606:72–79.
- Lawrence RA, Burk RF. 1978. Species, tissue and subcellular distribution of non Se-dependent glutathione peroxidase activity. J Nutr. 108:211–215.
- Li M, Harkema JR, Islam Z, Cuff CF, Pestka JJ. 2006. T-2 toxin impairs murine immune response to respiratory reovirus and exacerbates viral bronchiolitis. Toxicol Appl Pharmacol. 217:76–85.
- Lowry OH, Rosebrough NJ, Farr AL, Randall RJ. 1951. Protein measurement with the Folin phenol reagent. J Biol Chem. 193:265–275.
- Meca G, Meneghelli G, Ritieni A, Manes J, Font G. 2012. Influence of different soluble dietary fibers on the bioaccessibility of the minor Fusarium mycotoxin beauvericin. Food Chem Toxicol. 50:1362–1368.
- Meissonnier GM, Raymond I, Laffitte J, Cossalter AM, Pinton P, Benoit E, Bertin G, Galtier P, Oswald IP. 2009. Dietary glucomannan improves the vaccinal response in pigs exposed to aflatoxin B1 or T-2 toxin. World Mycotoxin J. 2:161–172.
- Meissonnier GM, Laffitte J, Raymond I, Benoit E, Cossalter AM, Pinton P, Bertin G, Oswald IP, Galtier P. 2008. Subclinical doses of T-2 toxin impair acquired immune response and liver cytochrome P450 in pigs. Toxicology. 247:46–54.
- Mourão JL, Pinheiro V, Alves A, Guedes CM, Pinto L, Saavedra MJ, Spring P, Kocher A. 2006. Effect of mannan oligosaccharides on the performance, intestinal morphology and cecal fermentation of fattening rabbits. Anim Feed Sci Technol. 126:107–120.
- Paryad A, Mahmoudi M. 2008. Effect of different levels of supplemental yeast (Saccharomyces cerevisiae) on performance, blood constituents and carcass characteristics of broiler chicks. Afr J Agric Res. 3:835–842.
- Pearson AW. 1978. Biochemical changes produced by Fusarium T-2 toxin in the chicken. Res Vet Sci. 24:92–97.
- Pinheiro V, Mourao JL, Jimenez G. 2007. Influence of Toyocerin (Bacillus cereus var. toyoi) on breeding performance of primiparous rabbit does. World Rabbit Sci. 15:179–187.
- Placer ZA, Cushman LL, Johnson BC. 1966. Estimation of product of lipid peroxidation (malonyldialdehyde) in biochemical systems. Anal Biochem. 16:359–364.
- Rabassa VR, Schwegler E, Goulart MA, Lopes MS, Hoffmann DA, Lisboa FP, Vendramin L, Roll VFB, Diaz GJ, del Pino FAB, et al. 2010. Metabolic parameters of ewes receiving diets containing a flatoxin and zearalenone with addition of modified glucomannan. Braz J Vet Res Anim Sci. 47:67–73.
- Rafai P, Tuboly S, Bata Á, Tilly P, Ványi A, Papp Z, Jakab L, Túry E. 1995. Effect of various levels of T-2 toxin in the immune system of growing pigs. Vet Rec. 136:511–514.
- Rezar V, Frankic T, Narat M, Levart A, Salobir J. 2007. Dose-dependent effects of T-2 toxin on performance, lipid peroxidation, and genotoxicity in broiler chickens. Poult Sci. 86:1155–1160.
- Rocha O, Ansari K, Doohan FM. 2005. Effects of trichothecene mycotoxins on eukaryotic cells: a review. Food Addit Contam. 22:369–378.
- Roos TB, de Lara AP, Dummer LA, Fischer G, Leite F. 2012. The immune modulation of Bacillus cereus var. toyoi in mice immunized with experimental inactivated Bovine Herpesvirus Type 5 vaccine. Vaccine. 30:2173–2177.
- Roos TB, Tabeleão VC, Dümmer LA, Schwegler E, Goulart MA, Moura SV, Corrêa MN, Leite FPL, Gil-Turnes C. 2010. Effect of Bacillus cereus var. toyoi and Saccharomyces boulardii on the immune response of sheep to vaccines. Food Agric Immunol. 21:113–118.
- Rozen S, Skaletsky HJ. 2000. Primer3 on the WWW for general users and for biologist programmers. In: Krawetz S, Misener S, editors. Bioinformatics methods and protocols: methods in molecular biology. Totowa (NJ): Humana Press; p. 365–386.
- Schierack P, Wieler LH, Taras D, Herwig V, Tachu B, Hlinak A, Schmidt MF, Scharek L. 2007. Bacillus cereus var. toyoi enhanced systemic immune response in piglets. Vet Immunol Immunopathol. 118:1–11.
- Schuhmacher-Wolz U, Heine K, Schneider, K. 2010. Report on toxicity data on trichothecene mycotoxins HT-2 and T-2 toxins. CT/EFSA/CONTAM/2010/03, question no. EFSA-Q-2010-0143. http://www.efsa.europa.eu/en/scdocs/doc/65e.pdf
- Sedlak I, Lindsay RH. 1968. Estimation of total, protein bound and non protein sulfhydryl groups in tissues with Ellmann’s reagent. Anal Biochem. 25:192–205.
- Simpson DW, Roth R, Loose LD. 1979. A rapid, inexpensive and easily quantified assay for phagocytosis and microbicidal activity of macrophages and neutrophils. J Immunol Methods. 29:221–226.
- Singh NP, McCoy MT, Tice RR, Schneider EL. 1988. A simple technique for quantitation of low levels of DNA damage in individual cells. Exp Cell Res. 175:184–191.
- Sokolovic M, Garaj-Vrhovac V, Ramic S, Simpraga B. 2007. Chicken nucleated blood cells as a cellular model for genotoxicity testing using the comet assay. Food Chem Toxicol. 45:2165–2170.
- Spring P, Wenk C, Connolly A, Kiers A. 2015. A review of 733 published trials on Bio-Mos®, a mannan oligosaccharide, and Actigen®, a second generation mannose rich fraction, on farm and companion animals. J Appl Anim Nutr. 3:1–11.
- Spring P, Wenk C, Dawson KA, Newman KE. 2000. The effects of dietary mannan-oligosaccharides on caecal parameters and the concentrations of enteric bacteria in the ceca of salmonella-challenged broiler chicks. Poultry Sci. 79:205–211.
- Taras D, Vahjen W, Macha M, Simon O. 2005. Response of performance characteristics and fecal consistency to long-lasting dietary supplementation with the probiotic strain Bacillus cereus var. toyoi to sows and piglets. Arch Anim Nutr. 59:405–417.
- Trocino A, Xiccato G, Carraro L, Jimenez G. 2005. Effect of diet supplementation with Toyocerin (Bacillus cereus var. toyoi) on performance and health of growing rabbits. World Rabbit Sci. 13:17–28.
- Wang J, Fitzpatrick D, Wilson J. 1993. Effect of dietary T-2 toxin on biogenic monoamines in discrete areas of the rat brain. Food Chem Toxicol. 31:191–197.
- Weaver GA, Kurtz HJ, Mirocha CJ, Bates FY, Behrens JC, Robison TS, Swanson SP. 1980. The failure of purified T-2 mycotoxin to produce hemorrhaging in dairy cattle. Can Vet J. 21:210–213.
- Wu Q, Wang X, Nepovimova E, Miron A, Liu Q, Wang Y, Su D, Yang H, Li L, Kuca K. 2017. Trichothecenes: immunomodulatory effects, mechanisms, and anticancer potential. Arch Toxicol. 91:3737–3785.
- Wu Q, Wu W, Franca TCC, Jacevic V, Wang X, Kuca K. 2018. Immune evasion, a potential mechanism of trichothecenes: new insights into negative immune regulations. Int J Mol Sci. 19:3307.
- Wu W, Zhou HR, Pan X, Pestka JJ. 2015. Comparison of anorectic potencies of the trichothecenes T-2 toxin, HT-2 toxin and satratoxin G to the Ipecac alkaloid emetine. Toxicol Rep. 2:238–251.