
Abstract
The increased resistance to disease observed after monensin treatment could reflect a reduction of inflammation and oxidative stress. We hypothesised that if monensin supplementation was given before calving, it would help in controlling inflammation, reduce the susceptibility to disease and increase the performance. Fourteen pregnant heifers (PR) and 24 multiparous cows (ML) were randomly assigned to a treated group (Mon) or a control group (Ctr). The Mon group received 32.4 g of monensin in a controlled-release capsule 21 days before calving (expected release rate, 335 mg/d for 95 days). Their health status, rumination activity, and plasma parameters were monitored from –28 to 56 days from calving. The milk yield (MY), milk composition, and cheese-making properties were also monitored. Rumen samples were collected at 30 days from calving to assess the volatile fatty acids composition and investigate immunological parameters. After calving, the Mon group had fewer clinical diseases, an increased rumination time, and a higher MY. Monensin reduced the infiltration of both T and B cells in rumen fluid. In ML, the Mon group had lower levels of β-hydroxybutyrate in the early postpartum period and a lower level of total reactive oxygen species. Of PR, the Mon group had a tendency for lower levels of nonesterified fatty acids, higher levels of ceruloplasmin after the first month of lactation, a tendency for lower levels of paraoxonase, higher levels of γ-glutamyl transferase and higher levels of total reactive oxygen species. Monensin treatment decreased the cheese-making properties in the milk of PR.
Monensin improved the performance of all the animals and decreased the disease incidence in all of them.
Monensin heightened the inflammatory and oxidative stress status and reduced the cheese-making properties in pregnant heifers.
Although different effects were seen in cows with different parity, dairy cows generally beneficed of monensin administration.
Highlights
Introduction
The transition period (TP) is the most critical phase in the productive life of a dairy cow. Inflammatory events in the TP contribute to the reduction of feed intake and time dedicated to rumination and can impair the liver function (Calamari et al. Citation2014). These effects exacerbate the negative energy balance (NEB) at the beginning of lactation, decreasing the cow’s performance and increasing the oxidative stress and incidence of diseases (Trevisi et al. Citation2014b).
Multiparous cows are known to have more health problems than heifers that are undergoing a first calving. The problems are related to the greater NEB and ketone bodies production that characterise animals that have gone through multiple lactations in comparison with primiparous animals (Wathes et al. Citation2007). Differences can also arise as a result of a different rumen environment, however. An active role of the rumen milieu has been recognised in the inflammatory and oxidative stress responses around calving, because stress related to calving can modify the rumen microbiota and fermentation patterns (Minuti et al. Citation2015).
Monensin is an ionophore well known for inhibiting hydrogen-producing bacteria in the rumen without affecting succinate-forming bacteria and Selenomonas ruminantium, which decarboxylate succinate to propionate (Schelling Citation1984). This leads to a higher availability of gluconeogenic precursors owing to the reduction of acetic acid and the increase of propionic acid (Richardson et al. Citation1976). Moreover, the production of methane (McGuffey et al. Citation2001) and lactic acid decreases (Dennis et al. Citation1981). These ruminal modifications attenuate the risk of ketosis and acidosis (Sauer et al. Citation1989). Thus, monensin controlled-release capsules have recently been allowed in the European Union to prevent the development of a severe NEB and ketosis during the TP in dairy cows. The increased resistance of dairy animals to disease with monensin treatment (Duffield et al. Citation2008a) could reflect a reduction of inflammation and oxidative stress, although the effects on oxidative stress and inflammatory indicators are poorly investigated. Furthermore, the different rumen environments of primiparous and multiparous dairy cows (Wathes et al. Citation2007) could lead to a different metabolic response to monensin on oxidative stress and inflammatory indicators.
Monensin is known to be effective in increasing the milk yield (MY) and can affect the milk components (Duffield et al. Citation2008a, Citation2008b; McCarthy et al. Citation2015). Nevertheless, its effect on the casein content, titratable acidity, and clotting features of milk has been poorly investigated, and these are the focal points in cheese-making systems. In multiparous and primiparous dairy cows receiving 300 mg d−1 of monensin as a topdress on their daily rations from 60 to 120 days from calving (DFC), a decreased rennet clotting time and curd-firming rate were seen, together with an increased curd firmness (Piccioli-Capelli et al. Citation1996). These findings suggest that there is a positive effect of monensin on the cheese-making features of the milk (Stocco et al. Citation2015). Considering that monensin improved the development of Streptococcus thermophilus and Lactobacillus spp. in milk, in particular Lactobacillus bulgaricus (Piccioli-Capelli et al. Citation1996), and that the quality of the milk and whey starter were not affected (Mammi et al. Citation2015), one can surmise that administering monensin as a topdress should be compatible with the dairy processing of milk. However, there are no data on the effect of monensin controlled-release capsules on the cheese-making properties of the milk.
In the present experiment, a controlled-release capsule of monensin was administered at the beginning of the TP to pregnant heifers (PR) and multiparous dairy cows (ML) to assess its effect on metabolic, inflammatory, and oxidative stress conditions. Rumen samples were collected in early lactation, and both the rumen fluid composition and immunological parameters were monitored. Finally, the effect of monensin on the cheese-making properties of milk was assessed to see whether it was compatible with the cheese-making process. The hypotheses of the study are (1) that monensin improves the metabolism and reduces the inflammatory and oxidative stress in the early postpartum period in both PR and ML cows and has beneficial effects on their performance; (2) that such an amelioration affects the infiltration of white blood cells into the rumen fluid in early lactation; and (3) that monensin administration positively affects cheese-making properties (rennet clotting time, curd-firming rate, and curd firmness at 30 minutes).
Materials and methods
This study complied with Italian laws on animal experimentation (DL n. 116, 27/01/1992) and ethics (authorization N. 44,021, 05/08/2013). Cows were enrolled in the experiment from October 2013 to October 2014. The trial was carried out on the experimental dairy farm of Università Cattolica del Sacro Cuore, located in the countryside of Piacenza city, northern Italy.
Experimental design
Thirty-eight Italian Holstein dairy cows were randomly allocated to two homogeneous groups, categorised by parity (12 ML and 7 PR in each group), expected date of calving, MY, length of previous lactation and body condition score (BCS). One group (Mon) received a monensin capsule with a theoretical release of 335 mg/d for 95 days (Kexxtone®, Elanco Italia Animal Health, Sesto Fiorentino, Florence, Italy) 3 weeks before expected calving, and the other group did not receive any treatment (Ctr). Between –35 and 56 DFC, periodical checks were performed and blood samples were collected regularly, according to the time schedule shown in and described in the following sections.
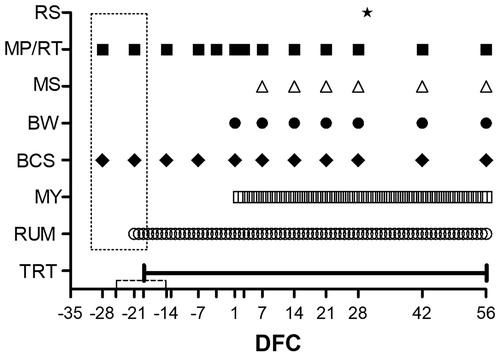
Figure 1. Scheduled time points, expressed as days from calving (DFC), for the administration of a monensin controlled-release capsule and its expected release (TRT; the solid line indicates an average administration time, and the dotted line indicates the standard deviation in comparison with the real calving time), rumination time measurement (RUM), milk yield measurement (MY), body condition score determination (BCS), body weight measurement (BW), milk sample collection for analysis of composition and rheological parameters (MS), blood sample collection for metabolic profile determination and rectal temperature measurement (MP/RT) and rumen sample collection for composition and immunological assays (RS). The dotted rectangle indicates the samples used to determine the baseline for blood samples and rumination time; empty ticks indicate –25, –19, –13, –3, and 3 DFC, respectively.
All the cows were housed in a free stall pen and milked twice a day at a 12-hour interval. Animals were fed the same total mixed ration formulated in accordance with National Research Council (NRC Citation2001) requirements and distributed once a day, in the morning, ad libitum. The grouping system adopted during this experiment made it impossible to detect the dry matter intake for the Mon and Ctr groups. During the experiment, samples of corn silage were collected monthly, and hays and concentrates were sampled and analysed at every change of batch (). The dry matter was measured after oven drying at 65 °C until a constant weight was obtained. After grinding, samples were analysed for crude protein (992.23, AOAC, 2005), ash (942.05, AOAC, 2005), and starch (996.11, AOAC, 2005) using a K-TSTA assay kit (Megazyme International, Bray, Ireland). The neutral detergent fibre and nonfibrous carbohydrates were determined according to Van Soest et al. (Citation1991).
Table 1. Composition and characteristics of the experimental diets fed to cows in dry and lactation periods.
Health status
The health conditions of the cows were monitored daily, and all veterinary interventions that occurred from –35 to 56 DFC were recorded. The rectal temperature was measured in the morning at –28, –21, –14, –7, –3, 1, 3, 7, 14, 21, 28, 42 and 56 DFC (), and the β-hydroxybutyrate (BHB) level in the milk was measured with a commercial kit (Keto-Test, Elanco Animal Health, Greenfield, Indiana, United States) at 3 DFC and thereafter on suspicion of disease. Ketosis was diagnosed when a BHB level higher than 200 μmol L−1 was detected. Mastitis was diagnosed by visual evaluation of abnormal milk from each quarter and somatic cell count analysis in suspicious cases. A retained placenta was diagnosed when the foetal membranes were not expelled within 24 hours after calving; endometritis and metritis were diagnosed according to prior guidelines (Sheldon et al. Citation2006) and foot diseases were diagnosed based on a report by a professional hoof trimmer.
Rumination time, body condition score, and body weight
The rumination time was registered daily between –21 and 56 DFC () using the Ruminact system (SCR Europe, Podenzano, PC, Italy) and expressed as minutes dedicated to rumination in a period of 24 hours. The body condition score (BCS) was evaluated by the same operator at –28, –21, –14, –7, 1, 7, 14, 21, and 28 DFC according to the Agricultural Development and Advisory Service (Citation1986), and the body weight (BW) was recorded with an automated walk-over weighing system at milking parlour exit at 1, 7, 14, 21, and 28 DFC ().
Blood collection and analyses
Before the morning feeding, blood was collected from the jugular vein at –28, –21, –14, –7, –3, 1, 3, 7, 14, 21, 28, 42, and 56 DFC () with 10-mL evacuated heparinised tubes (BD Vacutainer, BD Diagnostics, Franklin Lakes, NJ, USA), and samples were processed and analysed in accordance with Calamari et al. (Citation2016).
The packed cell volume (PCV) was measured directly on fresh blood after centrifugation. A clinical autoanalyzer (ILAB-650, Instrumentation Laboratory, Lexington, MA, USA) was used to measure the concentration of glucose, nonesterified fatty acids (NEFA), BHB, urea, creatinine, Ca, P, Mg, Na, K, Cl, Zn, haptoglobin, ceruloplasmin, total protein, albumin, globulin, cholesterol, total bilirubin, aspartate aminotransferase (AST-GOT), γ-glutamyl transferase (GGT) and alkaline phosphatase (ALP) according to Calamari et al. (Citation2016). Furthermore, paraoxonase (PON), myeloperoxidase, and ferric reducing antioxidant power (FRAP) were determined as previously described (Minuti et al. Citation2015), thiol groups (SHp) according to Minuti et al. (Citation2014) and total reactive oxygen metabolites (ROMt) according to Trevisi et al. (Citation2015). Retinol, tocopherol, and β-carotene were analysed by reverse-phase high-performance liquid chromatography (LC-4000, Jasco Europe, Carpi, MO, Italy) as previously described (Trevisi et al. Citation2015).
The liver functionality index (LFI) was calculated for plasma concentrations of albumin, total cholesterol and bilirubin, as previously described (Bertoni and Trevisi, Citation2013). The LFI turns positive or negative to reflect the good or poor ability, respectively, of cows to overcome the inflammatory and metabolic challenges of the TP.
Milk yield measurement and milk analysis
The MY was measured at each milking (0200 h and 1400 h) between 2 and 56 DFC and expressed on a daily basis. Milk samples were collected from the morning milking at 7, 14, 21 and 28 DFC (). The milk composition (fat, protein, lactose, casein contents, and titratable acidity) and cheese-making properties (rennet clotting time [r], curd-firming rate [k20], and curd firmness at 30 minutes [a30]) were measured by using infra-red instrumentation (MilkoScan FT 120, Foss Analytics, Hillerød, Denmark) as previously reported (Chessa et al. Citation2014). Fat and protein outputs were also calculated. Urea was determined on skimmed milk by a spectrometric assay, using the urea nitrogen kit and the clinical autoanalyzer ILAB-650 (Instrumentation Laboratory, Lexington, MA, USA). The somatic cell count was determined using an optofluorometric method with an automated cell counter (Fossomatic 180, Foss Analytics, Hillerød, Denmark) and expressed as a linear score (LS).
Rumen fluid collection
Rumen samples were collected with a stomach tube (Ruminator, Proofs Products, Guelph, Canada) at 30 DFC, 6 hours after the morning feed administration (). To reduce the buffer effect of saliva, the first half litre of rumen juice was discarded. The pH was measured immediately (GLP 21, Crison Instruments, SA, Alella, Barcelona, Spain). A 2-mL aliquot of rumen fluid was transferred into tubes with 1 mL of 0.12 M oxalic acid and immediately frozen at –20 °C for the analysis of rumen fluid composition. An additional aliquot was supplemented with 10% dimethyl sulfoxide (DMSO) and 40% (final) foetal calf serum (FCS) and deep-frozen at –80 °C for immunological assays.
Rumen fluid composition
The total VFA concentration and molar proportion of acetic (C2), propionic (C3), butyric (C4), isobutyric, valeric, isovaleric, caproic, isocaproic and enanthic acids were analysed in accordance with Minuti et al. (Citation2014). The acetic acid to propionic acid ratio (C2/C3) and the ratio between the sum of acetic acid and propionic acid to butyric acid [(C2 + C3)/C4] were also calculated. The ammonia concentration was measured with a spectrophotometric clinical autoanalyzer (ILAB-650, Instrumentation Laboratory, Lexington, MA, USA) and the kit for urea nitrogen (Instrumentation Laboratory).
Rumen fluid immunology
The total immunoglobulins (Ig) and immunoglobulin M (IgM) in the rumen fluid were measured by means of two distinct sandwich ELISA reactions (Trevisi et al. Citation2018). The rumen fluid samples with DMSO and FCS were rapidly thawed at 38 °C, and the mononuclear leukocytes were isolated by centrifugation with the Histopaque®-1083 (Millipore Sigma, St. Louis, MI, USA) as previously described (Trevisi et al. Citation2014a, Citation2014b).
Flow cytometry
An aliquot of isolated leukocytes was resuspended in PBS with 2% FCS and 0.1% sodium azide and reacted in aliquots with either mock antibody or monoclonal antibodies to bovine surface IgM (IL-A30), CD-3 (MM1A) and a myeloid cell-specific marker (IL-A24). These were used to stain B cells, T cells, and total myeloid cells, respectively. After a 30-minute incubation at 4 °C, cells were washed and reacted with a fluorescein isothiocyanate-conjugated goat F(Ab)2 antimouse IgG (ThermoFisher Scientific, code A24513, heavy + light chains) and analysed in a GUAVA easyCyte HT flow cytometer (Merck Millipore, Darmstadt, Germany) using Incyte software. After setting a gate including viable leukocyte cells in a forward-scatter/side-scatter cytogram, the prevalence of the different leukocyte populations in 10,000 events (including a large majority of protozoa and detached rumen wall cells) was established, as defined by the threshold corresponding to the negative control (Mock Ab).
Statistical analysis
Data are presented as least squares means and a standard error (SE). To account for the standard deviation of controlled-release capsule administration relative to the real calving day (–19 ± 6 DFC), samples collected at –21 DFC or before were used as the baseline for blood parameters and rumination time (). In order to account for and correct for the differences between groups at baseline, data for each sample were corrected arithmetically to obtain the same average between the Ctr and Mon groups and between the PR and ML cows at baseline, in accordance with Rosa et al. (Citation2017). This was performed by subtracting from each sample the difference between the average of the Ctr group and the average of the Mon group at baseline (i.e., all data were corrected by the Ctr group at baseline), and between the average of the ML group and the average of the PR group at baseline (i.e., all data were corrected by the ML group at baseline). This approach was chosen instead of the classic covariate model at baseline in order to obtain the average corrected least squares means data with the SE at baseline for each group. The corrected dataset was used for the statistical analysis. Prior to the statistical analysis, data were checked for outliers using the PROC REG of SAS 9.4 (SAS Institute, Inc., Cary, NC, USA).
The prevalence of health problems recorded during the study was evaluated by χ2 analysis (Freq procedure, SAS Institute, Inc., Cary, NC, USA).
Data on the BW, BCS, rumination time, plasma and milk parameters and MY were submitted to ANOVA using a mixed model for repeated measures (GLIMMIX procedure, SAS Institute, Inc., Cary, NC, USA). The fixed effects of treatment (T; Ctr, Mon), parity (P; PR and ML) and time (t) and the interaction effects of treatment × time (T × t), treatment × parity (T × P) and treatment × parity × time (T × P × t) were considered in the model. The cow was considered as the random effect, and the t effect within the cow was considered as a repeated measure. t had 12 levels for plasma (–21, –14, –7, –3, 1, 3, 7, 14, 21, 28, 42, 56 DFC) and 6 levels for milk parameters (7, 14, 21, 28, 42, 56 DFC). For the rumination time and MY, data were aggregated in phases of 2 weeks. The week before and the week after calving were considered as two distinct phases, because of the huge variations that characterise this period. Seven phases were considered for the rumination time and 4 for the MY. The analysis was carried out using 16 covariance structures, which were ranked according to their Akaike information criterion, with the one having the lowest Akaike information criterion being eventually chosen. The autoregressive covariance structure best fitted most of the parameters and was thus chosen in the analysis. The pair-wise comparison was done using the least significant difference test.
The LFI was calculated for the corrected dataset. Both the LFI and rumen fluid parameters were analysed by a one-way ANOVA (GLM procedure, SAS Institute, Inc., Cary, NC, USA), considering the fixed effect of the T, P, and T × P interaction. Among rumen fluid parameters, the amounts of T and B cells were log-transformed before analysis and back-transformed so they could be plotted in tables. The statistical significance and tendencies were declared at p ≤ .05 and p ≤ .10, respectively.
Results
Body condition score, body weight, rumination time, and milk yield
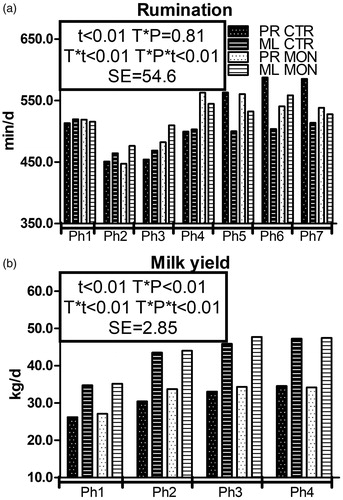
Monensin did not affect the BCS and BW (Supplementary Table S1). The daily rumination time () was numerically higher in the Mon than the Ctr group after calving and differences were more marked in ML cows, but an opposite trend appeared for PR cows between 36 and 56 DFC (T × P × t < .01). The average MY in the whole duration of the experiment was 39.35 ± 8.8 kg and 38.83 ± 9.3 kg in the Mon and Ctr groups, respectively (). It was higher in PR cows receiving monensin than the Ctr cows between 15 and 41 DFC (T × P and T × P × t < .01).
Figure 2. Pattern of rumination time (a) and milk yield (b) in multiparous (ML) and primiparous (PR) cows that received a controlled-release capsule of monensin at –21 days from calving (DFC; Mon) or not (Ctr). t is the time effect; T × P, is the treatment × parity interaction effect; T × t, the treatment × time interaction effect; T × P × t, the treatment × parity × time interaction effect; Ph, the phase (phase durations for the rumination time are Ph1 = from –21 to –6 DFC; Ph2 = from –7 to 0 DFC; Ph3 = from 1 to 7 DFC; Ph4 = from 8 to 21 DFC; Ph5 = from 22 to 35 DFC; Ph6 = from 36 to 49 DFC; and Ph7 = from 50 to 56 DFC. Phase durations for milk yield are Ph1 = from 2 to 13 DFC; Ph2 = from 14 to 27 DFC; Ph3 = from 28 to 41 DFC; and Ph4 = from 42 to 56 DFC); SE is the standard error of the model.
Health status
The incidence of the main diseases observed during the experiment is summarised in . No clinical problems were observed prior to calving in any animal. The total incidence of postcalving diseases was tendentially lower in the Mon group than the Ctr group (15 vs. 26 cases; p = .06).
Table 2. Incidence of diseases observed between 1 and 56 days from calving (DFC) in multiparous (ML) and primiparous (PR) cows that received a controlled release capsule of Monensin at –21 DFC (Mon) or not (Ctr).
Blood parameters
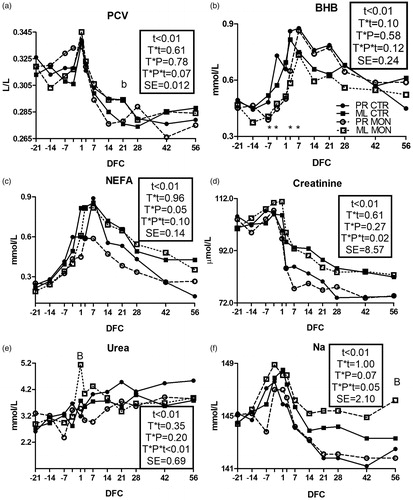
All parameters not affected by treatment or parity or their interactions are reported in Supplementary Figures S1 and S2. The PCV () was higher in the Mon group than the Ctr group in ML cows at 21 DFC (p < .1).
Figure 3. Pattern of packed cell volume (PCV; a), β-hydroxybutyrate (BHB; b), nonesterified fatty acids (NEFA; c), creatinine (d), urea (e), and sodium (Na; f) in multiparous (ML) and primiparous (PR) cows that received a controlled-release capsule of monensin at –21 days from calving (DFC; Mon) or not (Ctr). Comparisons at each time point were indicated with different symbols for the treatment × time interaction (T × t; *p < .05) and letters for the treatment × parity × time interaction (T × P × t; “a” is p < .1, and “A” is p < .05 for PR cows; “b” is p < .1, and “B” is p < .05 for ML cows); t is the time effect and SE is the standard error of the model.
Energy, protein, and mineral metabolism
Among energy metabolism biomarkers, monensin treatment did not affect the level of glucose (Supplementary Figure S1(a)). The BHB concentration () had a tendency for a T × t interaction, resulting in lower concentrations in the Mon group than the Ctr group between –7 and 3 DFC (p < .05 at each time point). The NEFA concentration () was numerically lower in the PR cows receiving Mon vs. Ctr cows between calving and 28 DFC (T × P × t = .1). Among protein metabolism biomarkers, PR cows had a more marked reduction of the creatinine concentration in the Mon group than the Ctr group after calving (; T × P × t = .02) and a lower urea level in the Mon group than the Ctr group during the whole experimental period (; T × P × t < .01). In ML cows, the Mon group had a higher peak of urea at calving compared with the Ctr group (p < .05). For the mineral metabolism, ML cows receiving monensin had an overall higher Na concentration compared with the Ctr cows after calving (), with a significant difference at 56 DFC (p < .05). Other biomarkers of the mineral metabolism were not affected by the treatment (Supplementary Figure S1(b–g)).
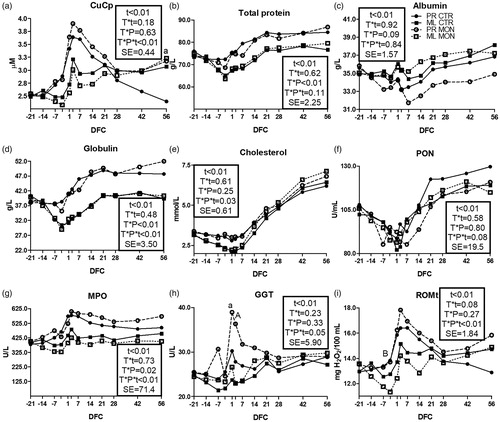
Figure 4. Pattern of ceruloplasmin (CuCp; a), total protein (b), albumin (c), globulin (d), cholesterol (e), paraoxonase (PON; f), myeloperoxidase (MPO; g); gamma glutamyl transferase (GGT; h) and total reactive oxygen metabolites (ROMt; i) in multiparous (ML) and primiparous (PR) cows that received a controlled-release capsule of monensin at –21 days from calving (DFC; Mon) or not (Ctr). Comparisons at each time point were indicated with different letters for the treatment × parity × time interaction (T × P × t; “a” is p < .1, and “A” is p < .05 for PR cows; “b” is p < .1, and “B” is p < .05 for ML cows); t is the time effect and SE is the standard error of the model.
Inflammatory biomarkers
Haptoglobin was not affected by monensin (Supplementary Figure S1(h)). In PR cows, ceruloplasmin levels were higher overall in the Mon group than the Ctr group after calving (), and the difference was marked at 56 DFC (p < .1). The total protein and albumin () had a T × P interaction (p < .01 and p = .09, respectively). In PR cows, the Mon group had numerically higher concentrations of globulin compared with the Ctr group at the end of the trial (; T × P × t < .01). Cholesterol () was affected by the full interaction (T × P × t = .03) due to a numerically larger increase over time in the Mon group versus the Ctr group after calving, especially for ML cows. In PR cows, the PON () was numerically lower in the Mon group than the Ctr group after calving (T × P × t = .08). In ML cows, myeloperoxidase () was overall lower in the Mon group than the Ctr group, whereas in PR cows there was an opposite trend, especially after calving (T × P × t < .01).
Liver function biomarkers
Monensin treatment did not affect the bilirubin, AST-GOT and ALP (Supplementary Figure S2(a–c)). In the PR cows, the GGT concentration () was higher in the Mon group than the Ctr group at 1 DFC (p < .1) and 3 DFC (p < .05). The average LFI was not affected by monensin (+0.20 vs. +1.08 points, respectively; SE = 0.66 and p = .88).
Oxidative stress indices
In PR cows, the ROMt () was numerically higher in the Mon group versus the Ctr group between –7 and 56 DFC, whereas in ML cows, the concentration was lower in the Mon group than the Ctr group at 3 DFC (p < .05). The FRAP, SHp, retinol, tocopherol, and β-carotene were not affected by the treatment (Supplementary Figure S2(d–h)).
Milk composition and cheese-making parameters
Among milk composition parameters (), the milk fat percentage and fat output had a tendency for T × t interaction. In PR cows, the Mon group had a lower milk fat output than the Ctr group, whereas the opposite happened in ML cows (T × P < .01). The milk protein output was increased by monensin but increased more in PR cows compared with ML cows (T × P × t < .01). No T × t effect appeared for rennet coagulation features, but some differences appeared considering the parity order. Only in PR cows did the treatment tend to increase the r and reduce the a30 (T × P = .02 and p = .04, respectively).
Table 3. Mean milk composition and rheological parameters in multiparous (ML) and primiparous (PR) cows that received a controlled release capsule of monensin at –21 days from calving (DFC; Mon) or not (Ctr).
Rumen fluid composition
Rumen fluid parameters are shown in . The rumen pH results were similar between groups and parity. The ruminal ammonia concentration was significantly lower in the Mon group than the Ctr group (p < .05). The total VFA concentrations did not differ between groups, but a significant T × P interaction was observed (p < .05). Moreover, the proportion of C3 tended to be higher (p = .1), and the proportions of valeric, caproic, and enanthic acids were lower (p ≤ .05) in the Mon group than the Ctr group. Furthermore, the C2/C3 and (C2 + C4)/C3 ratios tended to be lower in the Mon group in comparison with the Ctrl cows (p = .1).
Table 4. Ruminal pH, ammonia, VFA concentration, VFA molar proportion, and immunological parameters determined 30 days after calving, in multiparous and primiparous cows that received (Mon) or not (Ctrl) a controlled release capsule of monensin at –21 days from calving.
Rumen fluid immunology
Rumen immunological parameters are shown in . There was no effect of treatment on concentrations of total Ig and IgM in rumen fluids. The Mon group had a lower prevalence of B cells (p < .01) and a tendency for a lower prevalence of T cells (p = .08) in rumen fluid compared with the Ctrl group. Also there was no effect on the prevalence of myeloid cells.
Discussion
Effect of monensin on the metabolism and performance of cows in the transition period
Monensin reduces the daily contraction and turnover of the rumen content, and it could also impair the enzymatic degradation of fibre when no adaptation time is allowed for animals prior to its administration (Schelling Citation1984; Deswysen et al. Citation1987). Such effects could account for a lower passage rate and, thus, for a higher chewing time (Deswysen et al. Citation1987). In our data, the analysis of the rumination time using weekly phases did not find such an effect during the dry period. Nevertheless, cows treated with monensin had a faster recovery of rumen functions after the typical impairment related to parturition. This improved capacity to overcome stressful conditions could account for the higher MY during the first 56 days of lactation (+1.2 kg d−1), something that was widely reported in previous studies with monensin (Duffield et al. Citation2008a). Furthermore, rumen fluid samples collected at 30 DFC from treated cows had a decreased proportion of valeric acid and medium-chain acids (such as caproic and enanthic acids), consistent with previous results using the analogue ionophore Lasalocid (Thivend and Jouany Citation1983). These acids are mainly utilised by cellulolytic rumen organisms and are known to stimulate their growth (Cline et al. Citation1958). Thus, the decreased amounts of these acids found in cows treated with monensin suggest a greater development of such rumen bacteria, and this could account for a greater capacity to utilise fibrous feedstuff. This could partially account for the greater MY seen at the end of the experimental period, even though the sampling time for the rumen samples does not allow us to speculate on the relationship between the VFA variations induced by monensin and the increased MY detected immediately after calving.
Our results confirmed the lack of any effect of monensin on the blood Ca or Mg concentrations (Starnes et al. Citation1984), and they also provided further evidence that none of the electrolytes are affected by monensin. An ameliorated feeding behaviour could have reduced the NEB at the beginning of lactation, as suggested from the overall reduced ketogenesis in the Mon group around calving, in agreement with results by Duffield et al. (Citation2008b). The reduced ketogenesis was not coupled with any increase in the glucose concentrations in blood. Although not seen consistently (McCarthy et al. Citation2015), an increased glucose level was reported in some previous studies with monensin (Duffield et al. Citation2008b) and was also expected considering the numerical increase of C3 availability detected in the rumen fluid of our treated cows.
Monensin is known to affect the protein metabolism, increasing blood urea concentrations, especially around the time of calving (Duffield et al. Citation2008b). Nevertheless, the lower urea concentration found in rumen fluid at 30 DFC is consistent with the inhibition of rumen bacteria that deaminate proteins when monensin is given. Thus, the higher uraemia detected in blood suggests that monensin could have increased the contribution of amino acids from muscle tissues in supplying the energy deficit during a NEB, because the blood urea is partially derived from the deamination of muscle amino acids after using them as gluconeogenic sources.
One of the main aims of our study was to evaluate the effect of monensin on the inflammatory response occurring around calving. Such a condition typically affects the liver metabolism, resulting in severe losses in hepatic function and a shift of the anabolic priority of the organ (Bertoni et al. Citation2008). In particular, the liver produces more α-globulins, known as positive acute-phase proteins (APP), that is, haptoglobin and ceruloplasmin (Ceciliani et al. Citation2012). Conversely, it reduces the synthesis of albumin, retinol-binding protein, PON and lipoproteins, known as negative APP (Bertoni et al. Citation2008). In our experiment, a clear effect of monensin was not detected on the blood concentrations of such parameters, in agreement with a prior study (McCarthy et al. Citation2015). However, we detected a tendency for more ceruloplasmin and a lower PON in the PR cows, indicating a different effect of monensin due to parity. Furthermore, the lower prevalence of both T and B cells detected in the rumen fluid with monensin suggests that the treatment could be conducive to stabilisation of the rumen milieu, thus reducing the infiltration of leukocytes.
Effect of monensin on animals with different parity
The effect of monensin in increasing the rumination time was consistent in ML cows during the whole lactation period, whereas the same benefit was not as great in animals at first calving; the higher rumination time of the treated group in comparison with the Ctr group appeared between 8 and 22 DFC only, and an opposite trend was detected thereafter. This is consistent with the greater variability that characterises rumination recovery in PR animals after parturition and shows that more severe stress occurs in animals at first calving (Wathes et al. Citation2007). The greater stress is known to be reflected in a sudden increase in NEFA after calving (Wathes et al. Citation2007). Monensin treatment appears to have reduced such stress, considering that a tendency was seen for a lower NEFA concentration postpartum in the blood of PR cows. Despite the lower concentration of NEFA, the BHB was not affected in the PR cows; monensin treatment reduced the BHB concentrations in ML cows only, despite not affecting the level of NEFA. This could depend on the greater ketone body production in animals with multiple parturitions, likely because of challenges that occurred during previous lactations that might have impaired the liver’s capacity to oxidise the NEFA (Wathes et al. Citation2007; Bertoni et al. Citation2008) and also because of the more pronounced NEB arising from higher lactation requirements. The greater NEB could account for the higher urea level found in the Mon animals around calving, indicating a greater effect of treatment in mobilising muscle tissue and exposing amino acids to gluconeogenic processes to supply deficiencies.
In our study, the higher concentration of ceruloplasmin, the lower concentration of PON and the larger GGT in PR cows receiving monensin suggest a heightening of the inflammatory condition and a tendency to impair the liver function. GGT is a liver enzyme related to the utilisation of amino acids, and its increase in plasma is related to the impairment of liver function (Rodriguez-Jimenez et al. Citation2018). The greater level of inflammation seen in PR cows treated with monensin was also supported by a greater activation of neutrophils in these animals, as suggested from their higher concentrations of both myeloperoxidase and ROMt. Myeloperoxidase is involved in the generation of reactive oxygen species within the respiratory burst process during inflammation (Faith et al. Citation2008). The greater production of oxidant species could also account for an impairment of redox balance in Mon cows at first calving; ML animals seemed to have benefited from the treatment in this respect. Although the impairment of liver metabolism did not translate into a significantly lower liver functionality index and the trends in inflammatory parameters could be considered subclinical, the reason for the effect of monensin on inflammatory conditions of PR cows remains unclear. It could be hypothesised that such an effect is somehow related to the different rumen microbiota of cows with different parity (Lima et al. Citation2015), which could underline a different response to monensin.
Effect of monensin on milk composition and cheese-making properties
Monensin is known to decrease the milk fat percentage without affecting its total output, whereas no effects were reported on protein and casein contents (Duffield et al. Citation2008a). Our results are consistent with prior data for the protein percentage and casein content, but the fat output followed the expected trend in ML cows only, revealing a reduction in PR cows treated with monensin.
We did not observe an improvement in the renneting properties of milk in all of the animals, consistent with prior results using a controlled-release capsule of monensin (Mammi et al. Citation2015), but they were different than our prior observations using topdressed monensin (Piccioli-Capelli et al. Citation1996). Lack of such an effect in the present study could depend both on the different delivery method of monensin and on the different administration period (i.e., from 60 to 120 DFC in the previous study vs. the first 60 DFC in this study). Nevertheless, a different response to monensin appeared for animals with different parity, as supported by the significant effect of the interaction treatment x parity (p < .05). The PR cows had an opposite trend compared with our previous results (Piccioli-Capelli et al. Citation1996) and with ML cows for both r and a30 (e.g. increase of r and decrease of a30), suggesting an impairment of the cheese-making proprieties by monensin in the milk of PR cows. The lack of any effect on the cheese-making properties of the milk in ML cows by a slow-release capsule of monensin allows us to conclude that its use is compatible with cheese production; however, monensin could negatively affect the same properties in PR cows.
Conclusions
The administration of monensin in the peripartum phase has improved milk production (especially in primiparous heifers), probably as a combined effect of the faster recovery of rumen functions after calving and of the ameliorated VFA molar proportions in rumen (although differences that we observed in this respect were less marked than what was expected based on wide shifts in VFA proportions reported in the literature with monensin). Positive effects of monensin on rumination patterns continued up to the end of the experimental period in multiparous cows, whereas treatment for heifers undergoing their first calving seemed to have a less beneficial effect in this respect. Monensin does not affect the inflammatory parameters, liver function, or oxidative stress biomarkers in multiparous animals, but it preserves the integrity of the rumen wall during stressing events in the TP, as suggested from the lower amount of leukocyte infiltration into the rumen liquor. Monensin had less favourable effects on primiparous cows, considering the overall more extensive inflammatory conditions and oxidative stress they had compared with control animals. On the other hand, multiparous cows benefited from the treatment, as was suggested by the better inflammatory and oxidative stress conditions. Different responses to monensin could be a consequence of differences in the homeorhetic adaptation to early lactation of animals with different parity orders. Monensin did not modify the milk quality parameters or cheese-making properties, findings that indicate that this ionophore has no contraindications in dairy processing.
Ethical approval
This study complied with Italian laws on animal experimentation (DL n. 116, 27/01/1992) and ethics (authorization N. 44,021; 05/08/2013).
Supplemental Material
Download MS Word (908.9 KB)Acknowledgements
This article is dedicated to the memory of Luigi Calamari who prematurely passed away before the publication. Heartfelt thanks to Elanco Animal Health, which allowed this research providing the ruminal bolus of Kexxtone.
Disclosure statement
The authors declare that there is no conflict of interest associated with the article. The authors alone are responsible for the content and writing of this article.
Additional information
Funding
Related Research Data
References
- Agricultural Development and Advisory Service. 1986. Condition scoring of dairy cows. Publication 612. Ministry of Agriculture, Fisheries Food (PubI.). Lion House, Alnwick, Northumberland NE66 2PF, UK.
- Bertoni G, Trevisi E. 2013. Use of the liver activity index and other metabolic variables in the assessment of metabolic health in dairy herds. Vet Clin North Am Food Anim Pract. 29:413–431.
- Bertoni G, Trevisi E, Han X, Bionaz M. 2008. Effects of inflammatory conditions on liver activity in puerperium period and consequences for performance in dairy cows. J Dairy Sci. 91:3300–3310.
- Calamari L, Ferrari A, Minuti A, Trevisi E. 2016. Assessment of the main plasma parameters included in a metabolic profile of dairy cow based on Fourier Transform mid-infrared spectroscopy: preliminary results. BMC Vet Res. 12:4.
- Calamari L, Soriani N, Panella G, Petrera F, Minuti A, Trevisi E. 2014. Rumination time around calving: an early signal to detect cows at greater risk of disease. J Dairy Sci. 97:3635–3647.
- Ceciliani F, Ceron JJ, Eckersall PD, Sauerwein H. 2012. Acute phase proteins in ruminants. J Proteomics 75:4207–4231.
- Chessa S, Bulgari O, Rizzi R, Calamari L, Bani P, Biffani S, Caroli AM. 2014. Selection for milk coagulation properties predicted by Fourier transform infrared spectroscopy in the Italian Holstein-Friesian breed. J Dairy Sci. 97:4512–4521.
- Cline JH, Hershberger TV, Bentley OG. 1958. Utilization and/or synthesis of valeric acid during the digestion of glucose, starch and cellulose by rumen micro-organisms. J Anim Sci. 17:284.
- Dennis SM, Nagaraja TG, Bartley EE. 1981. Effects of lasalocid or monensin on lactate-producing or -using rumen bacteria. J Anim Sci. 52:418–426.
- Deswysen AG, Ellis WC, Pond KR, Jenkins WL, Connelly J. 1987. Effects of monensin on voluntary intake, eating and ruminating behavior and ruminal motility in heifers fed corn silage. J Anim Sci. 64:827–834.
- Duffield TF, Rabiee AR, Lean IJ. 2008a. A meta-analysis of the impact of monensin in lactating dairy cattle. Part 2. Production effects. J Dairy Sci. 91:1347–1360.
- Duffield TF, Rabiee AR, Lean IJ. 2008b. A meta-analysis of the impact of monensin in lactating dairy cattle. Part 1. Metabolic effects. J Dairy Sci. 91:1334–1346.
- Faith M, Sukumaran A, Pulimood AB, Jacob M. 2008. How reliable an indicator of inflammation is myeloperoxidase activity? Clin Chim Acta. 396:23–25.
- Lima FS, Oikonomou G, Lima SF, Bicalho MLS, Ganda EK, de Oliveira Filho JC, Lorenzo G, Trojacanec P, Bicalho RC. 2015. Prepartum and postpartum rumen fluid microbiomes: characterization and correlation with production traits in dairy cows. Appl Environ Microbiol. 81:1327–1337.
- Mammi L, Fustini M, Grazia L, Formigoni A. 2015. Influence of monensin continuous-release intraruminal device on milk and whey starter quality used for Parmigiano Reggiano cheese production. Ital J Anim Sci. 14:69.
- McCarthy MM, Yasui T, Ryan CM, Pelton SH, Mechor GD, Overton TR. 2015. Metabolism of early-lactation dairy cows as affected by dietary starch and monensin supplementation. J Dairy Sci. 98:3351–3365.
- McGuffey RK, Richardson LF, Wilkinson JID. 2001. Ionophores for dairy cattle: current status and future outlook. J Dairy Sci. 84:E194–E203.
- Minuti A, Ahmed S, Trevisi E, Piccioli-Cappelli F, Bertoni G, Jahan N, Bani P. 2014. Experimental acute rumen acidosis in sheep: consequences on clinical, rumen, and gastrointestinal permeability conditions and blood chemistry. J Anim Sci. 92:3966–3977.
- Minuti A, Palladino A, Khan MJ, Alqarni S, Agrawal A, Piccioli-Capelli F, Hidalgo F, Cardoso FC, Trevisi E, Loor JJ. 2015. Abundance of ruminal bacteria, epithelial gene expression, and systemic biomarkers of metabolism and inflammation are altered during the peripartal period in dairy cows. J Dairy Sci. 98:8940–8951.
- NRC. 2001. Nutrient requirement of dairy cattle. 7th ed. Washington, DC: National Academies Press.
- Piccioli-Capelli F, Maianti MG, Molinari A, Bertoni G. 1996. Effetti della supplementazione con Monensin sulle caratteristiche produttive e metaboliche delle bovine da latte. Atti Congresso S.I.S.Vet. 50:561–562.
- Richardson LF, Raun A, Potter E, Cooley C, Rathmacher R. 1976. Effect of monensin on rumen fermentation in vitro and in vivo. J Anim Sci. 43:657–664.
- Rodriguez-Jimenez S, Haerr KJ, Trevisi E, Loor JJ, Cardoso FC, Osorio JS. 2018. Prepartal standing behavior as a parameter for early detection of postpartal subclinical ketosis associated with inflammation and liver function biomarkers in peripartal dairy cows. J Dairy Sci. 101:8224–8235.
- Rosa F, Osorio JS, Trevisi E, Yanqui-Rivera F, Estill CT, Bionaz M. 2017. 2,4-Thiazolidinedione treatment improves the innate immune response in dairy goats with induced subclinical mastitis. PPAR Res. 2017:1.
- Sauer FD, Kramer JK, Cantwell WJ. 1989. Antiketogenic effects of monensin in early lactation. J Dairy Sci. 72:436–442.
- Schelling GT. 1984. Monensin mode of action in the rumen. J Anim Sci. 58:1518–1527.
- Sheldon IM, Lewis GS, LeBlanc S, Gilbert RO. 2006. Defining postpartum uterine disease in cattle. Theriogenology 65:1516–1530.
- Van Soest PJ, Robertson JB, Lewis BA. 1991. Methods for dietary fiber, neutral detergent fiber, and nonstarch polysaccharides in relation to animal nutrition. J Dairy Sci. 74:3583–3597.
- Starnes SR, Spears JW, Froetschel MA, Croom WJJ. 1984. Influence of monensin and lasalocid on mineral metabolism and ruminal urease activity in steers. J Nutr. 114:518–525.
- Stocco G, Cipolat-Gotet C, Cecchinato A, Calamari L, Bittante G. 2015. Milk skimming, heating, acidification, lysozyme, and rennet affect the pattern, repeatability, and predictability of milk coagulation properties and of curd-firming model parameters: a case study of Grana Padano. J Dairy Sci. 98:5052–5067.
- Thivend P, Jouany JP. 1983. Effect of lasalocid sodium on rumen fermentation and digestion in sheep. Reprod Nutr Dev. 23:817–828.
- Trevisi E, Amadori M, Riva F, Bertoni G, Bani P. 2014a. Evaluation of innate immune responses in bovine forestomachs. Res Vet Sci. 96:69–78.
- Trevisi E, Jahan N, Bertoni G, Ferrari A, Minuti A. 2015. Pro-inflammatory cytokine profile in dairy cows: consequences for new lactation. Ital J Anim Sci. 14:285–292.
- Trevisi E, Riva F, Filipe JFS, Massara M, Minuti A, Bani P, Amadori M. 2018. Innate immune responses to metabolic stress can be detected in rumen fluids. Res Vet Sci. 117:65–73.
- Trevisi E, Zecconi A, Cogrossi S, Razzuoli E, Grossi P, Amadori M. 2014b. Strategies for reduced antibiotic usage in dairy cattle farms. Res Vet Sci. 96:229–233.
- Wathes DC, Cheng Z, Bourne N, Taylor VJ, Coffey MP, Brotherstone S. 2007. Differences between primiparous and multiparous dairy cows in the inter-relationships between metabolic traits, milk yield and body condition score in the periparturient period. Domest Anim Endocrinol. 33:203–225.