
Abstract
Condensed tannin (CT) of varying molecular weights (MWs) may affect rumen microbial fermentation by shifting composition of fungal community. In this study the effects of unfractionated CTs (F0) and CT fractions of different MWs (F1 > F2 > F3 > F4 > F5) from Leucaena leucocephala hybrid-Rendang (LLR) on the fungal mass and composition of fungal community were determined using molecular approaches. The results showed that the total fungi biomass decreased (p < .05) with the addition of higher-MWs CT fractions F1, F2 and F3 with values 35.3 µg/mL, 34.6 µg/mL and 39.3µg/mL, respectively, when compared to that of the control sample (without CTs) at 52.1 µg/mL. Sequencing of the polymorphic internal transcribed spacer 1 (ITS-1) by high-throughput sequencer, recovered mean of 109,190 sequences per-sample which comprised of a number of operation taxonomy units (OTUs) ranging from 22 to 38 and were classified into 7 genera. Piromyces 4 was the dominant genus in the control representing ∼70% of the sequences. Relative abundance of the Piromyces 4 increased significantly (p < .05) with increasing MWs of the CT fractions, however the second dominant Neocallimastigaceae was significantly (p < .05) reduced. This study demonstrated that CT fractions of different MWs could decrease the population mass as well as alter the rumen fungal community structure and diversity, and the effect was more pronounced for higher-MWs CTs. Hence, the shift in fungal diversity, accompanied by changes in population mass would influence fibre digestibility in the rumen in the presence of high MW CTs.
Condensed tannins (CTs) of different molecular weights (MWs) alter the rumen fungi population and diversity.
Relative abundance of the Neocallimastigaceae decreased with increasing MWs of CTs, whereas the predominant Piromyces was significantly increased.
Higher MWs of CT fractions would influence fibre digestibility in the rumen.
HIGHLIGHTS
Introduction
Anaerobic fungi are primary colonisers of plant materials ingested by the host and facilitated fibre digestion which contributes significantly to the overall fermentation in the rumen (Fliegerová et al. Citation2010). The total rumen fungal population in cattle estimated to be lower (8–12% of the total microbial biomass of the rumen) than rumen protozoa or bacteria (Gordon and Phillips Citation1993). However, the rumen fungi possess a strong fibrolytic enzymes that used to degrade fibrous particles of dissimilar size. They also play a vital role in the physical and chemical digestion of plant via penetrate, colonies and degrade recalcitrant cell walls that are resistant to bacterial attack (Akin and Borneman Citation1990). Anaerobic fungi in cattle are belonging to the Neocallimastigomycota phylum and to date, six genera have been identified, namely, Neocallimastix, Piromyces, Caecomyces, Orpinomyces, Anaeromyces and Cyllamyces (Gruninger et al. Citation2014).
Condensed tannins (CTs), anti-nutritional factors in plants, are abundant in legume-dominated crop and can limit fibre degradation by ruminant. CTs appear to indirectly decrease methane (CH4) production by reducing fibre digestion via the reduction of cellulolytic rumen fungi and bacteria, hence decreases hydrogen (H2) availability for methanogenesis (McSweeney et al. Citation2001a). Likewise, CTs could exhibit inhibitory effects on the growth of rumen fungi, depending on the types and concentrations of CTs (Smith et al. Citation2005). McSweeney et al. (Citation2001a) have discovered that sheep fed with 18 g of CT/kg from Calliandra calothyrsus had reduced population of rumen fungi, but the inhibitory effect was less effective as compared to rumen bacteria. Later, Kok et al. (Citation2013) found that, L. leucocephala hybrid-Bahru (LLB) containing 18 g/kg CTs, when fed to goats, significantly decreased the population of anaerobic cellulolytic rumen fungi. The CTs have also been found to inhibit zoospore attachment to cellulose and cellulolytic enzymes activity of anaerobic rumen fungi (Barahona et al. Citation2006).
CTs are naturally present in plants, comprising polymers of flavonoids with molecular weights (MWs) in the range 500–20,000 Da (Aerts et al. Citation1999). They are formed from flavan-3-ols monomers, such as catechins and epicatechin that are linked by covalent bonds (C4–C6 or C4–C8 linkages) with different degrees of polymerisation (DP). Chemical structures and MW are important factors determining the effects of CT on CH4 production and rumen fermentation in ruminants (Osborne and McNeill Citation2001). Moreover, differences in functional and biochemical characteristics of CTs of differing MWs may influence the rumen microbial population and protein metabolism via interacting with extracellular enzymes, plant proteins and microbial cell walls. Mané et al. (Citation2007) suggested that studies on the effects of MWs of CTs on the total microbial diversity are necessary to obtain target responses on rumen fermentation without adverse impacts on rumen microbial populations and their functions.
Previously, our group fractionated pure CT (F0) from Leucaena leucocephala hybrid-Rendang (LLR) into five CT fractions (F1–F5) of differing MWs (F1, 1265.8Da; F2, 1028.6Da; F3, 652.2Da; F4, 562.2Da; F5, 469.6Da) using a size exclusion chromatography technique (Saminathan et al. Citation2014). Then, we found that addition of CT fractions (F1–F5) in rumen liquor decreased CH4 production without reduction in dry matter (DM) digestibility in vitro and the impact was more prominent for the CT fraction with a higher MW (Saminathan et al. Citation2015). These results indicated that the strategies used to mitigate rumen CH4 production are achieved in such a way that CTs dose not influence the fibre-degrading microbes, particularly rumen fungi that are actively involved in digestion of plant cell walls. However, their effects on the bovine rumen fungal community have not been confirm yet. Thus, the present study aimed to evaluate the effects of CT fractions of different MWs from LLR on the population density and diversity of rumen fungal community determined in vitro by using real-time polymerase chain reaction (PCR) and Illumina high-throughput sequencing methods.
Materials and methods
Extraction and fractionation of CTs
Crude CTs were extracted from young leaves of LLR and purified following the method described by Terrill et al. (Citation1992). The pure mixture of unfractionated CTs (F0) were fractionated into five CT fractions (F1–F5) of different MWs (F1, 1265.8Da; F2, 1028.6Da; F3, 652.2Da; F4, 562.2Da; F5, 469.6D) using the size-exclusion chromatography method as previously described by Saminathan et al. (Citation2014).
In vitro gas production
Two rumen fistulated mature male Kedah-Kelantan cattle (Bos indicus) were used as rumen fluid donors. The cattle were kept in individual cages in the animal house and fed twice daily with chopped guinea grass (Panicum maximum) and a commercial concentrate (3:2 ratio) at 2.5% of body weight. About 500 mL of rumen fluid were taken from each cattle before the morning feed. Procedures for animal use protocols approved by the Universiti Putra Malaysia’s Animal Care and Use Committee (UPM/FPV/PS/3.2.1.551/AUP-R32). The fluids were pooled, then strained through eight layers of sterile cheesecloth directly into a conical flask under a stream of CO2 gas to provide anaerobic condition. Two hundred and fifty mL of the strained rumen fluid were mixed with 750 mL of a mineral solution consisting of macro- and micro-elements and bicarbonate buffer pH 8.2 under stream of CO2 gas at 39 °C. The buffered rumen fluid was used for fermentation study according to the in vitro Hohenheim gas production procedure as described by Makkar et al. (Citation1995). Forty mL of the buffered rumen fluid was placed in 100 mL glass syringes (Häberle Labortechnik, Lonsee-Ettlenschieß, Germany) together with 500 mg of ground (1 mm) dry guinea grass and added with 15 mg of either F0 or CT fractions (F1, F2, F3, F4 or F5) and incubated at 39 °C for 24 h. The buffered rumen fluid without any CTs was used as the control. The in vitro rumen fermentation study was repeated thrice (runs), with three replicate samples examined per treatment.
Microbial genomic DNA isolation
After an incubation period, 300 µL of the treated rumen fluid-buffer mixture was obtained from the three runs of an in vitro gas production test for extraction of genomic DNA (n = 9). Extraction of the total microbial DNA was carried out using the QIAamp DNA Stool Mini kit (Qiagen Gmbh, Hilden, Germany) according to the manufacturer’s protocols with a minor modification, where samples to be vortexed were added with 0.4 g of 0.1 mm glass beads to break the cell walls of rumen fungi to yield maximum DNA. Genomic DNA was electrophoresed on agarose gel to determine the quality. The concentration of DNA was determined by using a NanoDrop® ND-1000 UV-Vis Spectrophotometer (NanoDrop Technologies, Wilmington, DE, USA). The DNA was kept at −20 °C for subsequent use.
Absolute quantification of rumen fungi using real-time PCR
A pair primer set was used for quantifying the total rumen fungal population and the PCR amplification conditions were the same as those described by Denman and McSweeney (Citation2006). The rumen fungal-specific primers used for real-time PCR assay were designed from multiple alignment of ITS-1 and 18S rRNA gene sequences, which are representatives of distantly related fungal species. The primer sequences were: forward primer 5′-GAGGAAGTAAAAGTCGTAACAAGGTTTC-3′ and the reverse primer 5′-CAAATTCACAAAGGGTAGGATGATT-3′, with an amplicon of the desired size of 120 bp.
An absolute quantification of the anaerobic rumen fungi was achieved based on the standard curve method. The standard curve was prepared by plotting the logarithm of Piromyces sp. PGL25 DNA (0–100 ng/mL) against the observed cycle threshold (Ct) values. This Piromyces sp. PGL25 was previously isolated from the rumen fluid of goat and was identified based on ITS-1 and 18S ribosomal gene sequences (Kok et al. Citation2013). The overall amplification efficiency (Es) was determined from the slope of standard-curves using the following equation: Es = 10^(−1∕slope) – 1 (Klein Citation2002). The fungal biomass was estimated from quantitative real-time PCR results using a conversion factor of 1 mg of total rumen fungal biomass per 13 μg fungal DNA (Denman and McSweeney Citation2006).
The real-time PCR assay was carried out by using a Bio-Rad CFX96 Real-Time System, C1000 Thermal Cycler (Bio-Rad Laboratories Inc., Hercules, CA, USA). The assay was performed in 20 µL reaction mixture consisting of a 10 µL SensiFASTTM SYBR® No-ROX One-Step Kit Master mix (Bioline, London, UK), 3 µL of DNA template, 1 µL of each forward and reverse primers (10 µM) and 5 µL of Milli-Q water. Thermal cycling conditions were the same as described by Kok et al. (Citation2013). The real time-PCR outputs were analysed by using real-time CFX Manager Software version 3.0 (Bio-Rad) to quantify the fungal population by comparing the Ct of the DNA template with that of the standard. The results (n = 9 per treatment) obtained were directly used for statistical analysis.
Amplification of the ITS-1 region and high-throughput sequencing
Amplification of the ITS-1 gene regions was carried out by using the modified rumen fungi MN100 forward primer (5′-TCCTACCCTTTGTGAATTTG-3′) attached to the universal forward Illumina adapter, and MNGM2 reverse primer (5′-CTGCGTTCTTCATCGTTGCG-3′) (Edwards et al. Citation2008; Nicholson et al. Citation2010), attached to one of the 6-base barcode sequences (Multiplex Unique Identifiers) and to the universal reverse Illumina adapter. The source barcode of our pipeline is available for download at https://support.illumina.com/downloads/illumina-customer-sequence-letter.html. These custom oligos Illumina primers were synthesised by 1st BASE Laboratories PTE LTD, Singapore (Table S1). The thermal PCR cycling conditions used were the same as described by Kittelmann et al. (Citation2013).
The PCR amplification cycle was performed as follows: initial denaturation at 95 °C for 3 min for activation of hotstart DNA polymerase; 30 cycles of denaturation (95 °C, 20 s), annealing (50 °C, 20 s) and extension (65 °C for 1 min); and a final 7 min extension at 72 °C. All PCR amplifications were performed for all fungal DNA samples (n = 9 per treatment). The PCR amplifications were performed in a 25 μL reaction mixture containing 0.75 µL of each Illumina primers (0.75 µM), 12.5 µL of 2× Kapa HiFi HotStart ReadyMix (contains 2.5 mmol/L Mg2+ at 1×), 3 µL of DNA template and 8 µL of Milli-Q water by using the SureCycler 8800 Thermal Cycler (Agilent Technologies Inc., Santa Clara, CA, USA).
After amplification, the correct sizes of PCR products of about 370 bp (ITS1 region ∼250 bp with Illumina primer adapters ∼121 bp) were verified by using 20 g/L agarose gel electrophoresis. The successfully amplified PCR products were obtained using a QIAquick gel extraction and purification kit (Qiagen, Valencia, CA), and quantified on a QuantusTM Fluorometer (Promega, Madison, WI). Seven libraries with unique tags were generated by pooling triplicate PCR products from each treatment group into equimolar concentrations. The pooled PCR products were loaded onto a flow cell for reversible terminator sequencing on Illumina MiSeq sequencer (2 × 250 bp paired-end reads). The raw sequence reads were quality-filtered by error estimation, base calling and image analysis using the Illumina Pipeline, version 2.6.
Analysis of high-throughput sequencing reads
The quality-filtered raw sequences were subjected to bioinformatic analysis using the MOTHUR package, version 1.39.0 (Schloss et al. Citation2009). Initially, the raw paired-end sequences were assigned to their representative treatment group based on the 6-base barcode sequences and assembled into contigs. Then, the Illumina sequence reads were quality trimmed using the flowgra/PyroNoise algorithm to remove sequencing noise. Only sequencing reads with >330 bp read length and having a quality score of ≥25 were considered for further analysis. Sequence reads with 2 mismatches to the primer sequence, >1 mismatch to the barcode and had a homopolymers longer than 9 bp were eliminated. Denoised sequence reads were subjected to sequence alignment in MOTHUR using fungal ITS-1 genes, version 2.1 [in-house database available from Kittelmann et al. (Citation2013) upon request]. Potential chimeric sequences were removed using UCHIME method with standard options as implemented in MOTHUR (Edgar et al. Citation2011). Distance matrices between aligned sequences were calculated, and then clustered into Operational Taxonomic Unit (OTU, cut-off 0.03 using a furthest neighbour clustering). Finally, OTUs were classified using the classify.seqs algorithm against the ITS-1 in-house reference database using a bootstrap cut-off of 80%. Good’s (Citation1953) analysis and rarefaction curve were obtained to measure the coverage and sampling effort, respectively. The α-diversity indices such as Chao1 (richness), Shannon-Weaver (diversity) and abundance-based coverage estimators (ACE) were calculated using the MOTHUR pipeline. For multiple community comparisons between treatments, a cladogram was created using the dissimilarity index (Bray–Curtis), and visualised using the FigTree (Graphical Viewer of Phylogenetic Trees, version 1.4.3). Principal coordinate analysis (PCoA) plots were generated using the package APE in R programming (http://www.r-project.org/) based on un-weighted distance matrices (UniFrac and Bray–Curtis).
Phylogenetic analysis
Phylogenetic analysis were conducted using their representative OTU (representing relevant fungal genera) sequences with publicly available near-complete ITS-1 fungal sequences to identify a putative genus or species cut-off for the ITS-1 sequenced fragment in rumen fungi. Sequences derived from rumen fungi pure cultures from GenBank (http://www.ncbi.nlm.nih.gov/BLAST/) were used to confirm phylogenetic affiliations or to assign uncultured clones to specific species and genera. Then, selected OTU as well as reference sequences were aligned and trimmed using MAFFT-linsi and TrimAl (-gappyout setting), respectively (Katoh and Standley Citation2013). Finally, a phylogenetic tree was built using Molecular Evolutionary Genetic Analysis version 7.0 software based on the neighbour-joining algorithm with the Hasegawa–Kishino–Yano (HKY) substitution model and a γ-shaped distribution of 2.0. Bootstrap values were based on 1000 replicates and are shown for branches with >50% bootstrap support. The tree was visualised and edited using TreeGraph2 (Stöver and Müller Citation2010).
Statistical analysis
Statistical analysis of the total fungal population data obtained from real-time PCR were analysed by PROC GLM general factorial ANOVA procedure in SAS version 9.2 (SAS Citation2005): Yij = µ + Ti + βj + εij, where Yij is the observed value for the jth replicate (run, n = 3, three repetitions within each run averaged) of the ith treatment; µ, is the overall mean; Ti, is the treatment effect for the ith treatment; βj is the replicate effect for the jth replicate; and εij, the residual effects. Differences of means between treatments were tested by Duncan’s new multiple-range test and statistical significance was considered at p < .05. Diversity indices and the relative abundance of the fungal communities between treatments from high-throughput sequences were analysed statistically using the Statistical Analysis of Metagenomic Profiles (STAMP) software package (Parks et al. Citation2014). Statistical settings in STAMP were set to Fisher’s exact test, two-sided, 95% confidence interval and CI method Newcombe–Wilson with Bonferroni correction.
Nucleotide sequence accession numbers
The MiSeq sequencing data of the rumen fungal ITS-1 genes in this study were deposited in the NCBI Sequence Read Archive (SRA) (http://www.ncbi.nlm.nih.gov/Traces/sra/) under accession no. SRP115708.
Results
Biomass of rumen fungi estimated using real-time PCR
The biomass of rumen fungi estimated by real-time PCR after the incubation period of 24 h in the control (without CTs), F0 and F1–F5 fractions are shown in . The total biomass of rumen fungi in control was 43.1 µg/mL. The total biomass of fungi were significantly (p < .05) lower in CT fractions F1 (35.3 µg/mL), F2 (34.6 µg/mL), and F3 (39.3 µg/mL), with F2 showing the lowest value, than the control. F0 and fractions F4 and F5 had no significant (p > .05) effects on the total biomass of fungi when compared to the control.
Table 1. Effects of unfractionated CTs F0 and CT fractions of different MWs on the biomass of rumen fungi at 24 h of incubation using in vitro gas production method, estimated using real-time PCR.
Analysis of high-throughput sequencing data
The NGS sequencing of the ITS-1 gene of the rumen fungi generated 764,336 high-quality sequence reads, with an average of 109,190 reads per-sample (), after culling ∼2.5% of the total sequencing reads as ambiguous bases and regions outside of the preferred region of the target gene. High-quality sequences were sub-sampled (n = 80,400) to confirm that an equal number of sequence reads from each sample were used for downstream comparative analyses. The rarefaction showed that the majority of the rumen fungal phylotypes were well-covered as the fungal OTUs, defined at 97% sequence similarity from the seven treatment samples reached the plateau phase ().
Figure 1. Rarefaction curves of rumen fungal communities based on the ITS-1 gene sequences from the different treatment groups. Control (without CTs), (F0 = unfractioned CTs, F1 = Fractrion 1, F2 = Fraction 2, F3 = Fraction 3, F4 = Fraction 4 and F5 = Fraction 5) examined at a 0.03 distance level. The operational taxonomic units (OTUs) were defined by the average neighbour algorithms with 3% dissimilarity using Mothur.
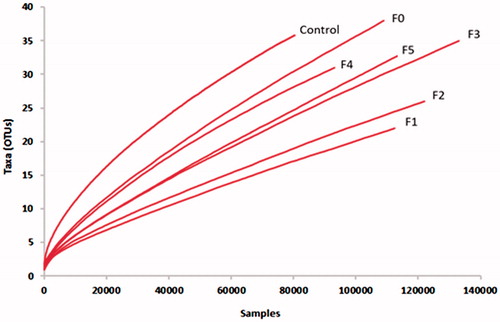
Table 2. Summary of the Illumina MiSeq sequences data and statistical analysis of rumen fungi diversity in bovine rumen fluid without (control) and with unfractionated CTs F0 and CT fractions of different MWs weights from LLR.
The observed OTUs, sequence coverage, and species diversity and richness as measured using the Shannon–Weiner indices, Chao1 and ACE are shown in . Numerically, the highest number of OTUs was observed in F0, followed by control, F3, F5, F4 and F2, while F1 had the lowest number OTUs. The α-diversity indices showed that Chao 1 fungal richness was significantly (p < .05) lower in fraction F1 and F2 when compared with that of the control and fractions F3–F5, but not significantly (p > .05) different from that of F0. Fractions F1 and F2 had a significantly (p < .05) lower Shannon diversity index than control, fractions F4 and F5, but not significantly (p > .05) different from that of F0 and fraction F3. However, ACE indices were not significantly different (p = .307) among all treatment groups.
Relative abundance of rumen fungal community
Seven defined fungal OTUs (≥0.01% of relative abundance) at similarity cut-off of 97% that were assigned to genus-level were observed in all the seven samples studied (). The results showed that the control, which represented the normal rumen fluids of cattle fed with guinea grass demonstrated that Piromyces 4 was the predominant genus, followed by unclassified Neocallimastigaceae, unclassified Neocallimastigales, Piromyces 2, Piromyces 5, Anaeromyces mucronatus YE505 and Anaeromyces 1 (; Figure S1). Each of the fungal genera proportion in F0 and CT fractions were measured for significant changes as compared to that of the control. There was a significant (p < .05) increase in the relative abundance of the dominant genus Piromyces 4 with fractions F2, F1, F3, F4, F5 and F0, with overall increase of 29.88%, 29.64%, 28.83%, 24.71%, 23.52 and 22.55%, respectively, than the control. In contrast, the relative abundance of the second dominant genus unclassified Neocallimastigaceae was significantly (p < .05) decreased by 29.04% in fraction F2 treatment, followed by fraction F1 (28.80%), F3 (28.05%), F4 (23.97%), F5 (22.76%) and F0 (21.92%) compared to the control. The relative abundance of the minor genus Neocallimastigales was significantly decreased (p < .05) with addition of F0 and CT fractions F1–F5 (with F1 showing the highest reduction) as compared to the control. The relative abundance of genus Piromyces 2 was significantly (p < .05) increased in F5 but not in other treatments, when compared to control. There were no significant (p > .05) changes in the relative abundance of the genera Piromyces 5, Anaeromyces mucronatus YE505 and Anaeromyces 1 among all treatment groups.
Table 3. Relative abundance (% of total sequences) of fungal genera in bovine rumen samples without (control) and with unfractionated CTs F0 and CT fractions of different MWs weights from LLR.
Clustering analysis of fungal communities among all treatments
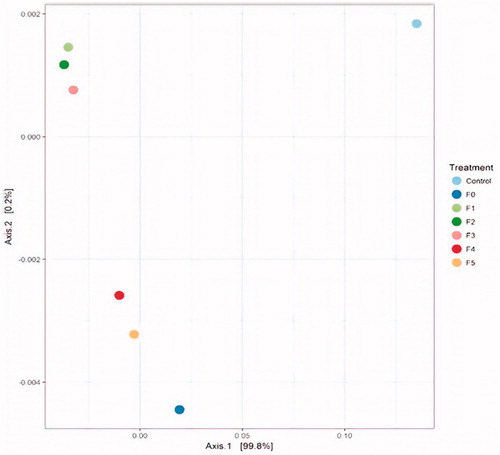
Clustering analysis was performed to determine the trend emerging of the rumen fungal community and diversity in control and treatment samples using the un-weighted UniFrac method. There were at least five distinct clusters identified among control, F0 and CT fractions F1–F5 based on a 95% fungal community relationship in hierarchical clustering of samples according to Jaccard analysis (). The composition of the fungal communities in the control fell into clades that were distinct from F0 and CT fractions (). Fungal communities in F0, F3, F4 and F5 fell into coherent clades that were distinct from one another, while those of the fractions F1 and F2 formed another cluster in the hierarchical tree. In addition, a PCoA plot of the rumen fungal community based on the un-weighted Uni-Frac metric was generated using distance matrices (). The fungal community structure, as shown in the hierarchical clustering for the control was significantly distinct (p < .05) from those of fractions F1–F5 and F0 by Axis 1 and Axis 2. The plot also showed that the fungal community structure in rumen fluids treated with CT fractions of higher-MW (fractions F1, F2, and F3), were well-distinguished from treatments treated with CT fractions of lower-MW (CT fractions F4 and F5) by Axis 2.
Figure 2. Hierarchical clustering of fungal communities using the Bray-Curtis similarity index based on the un-weighted UniFrac method. Control (without CTs), (F0 = unfractioned CTs, F1 = Fractrion 1, F2 = Fraction 2, F3 = Fraction 3, F4 = Fraction 4 and F5 = Fraction 5). The scale represents the un-weighted UniFrac distances.
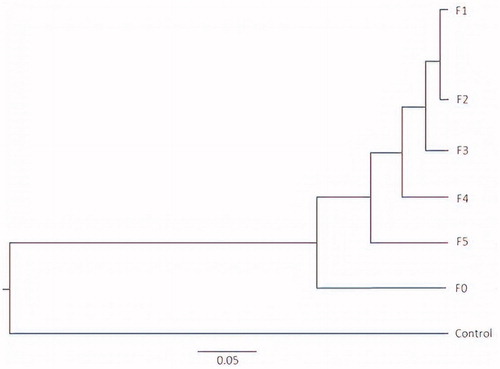
Figure 3. Principal component analysis (PCoA) of fungal ITS-1 gene sequence tags generated from an Illumina MiSeq sequencing run (F0 = unfractionated CT, F1= Fraction F1, F2= Fraction F2, F3= Fraction F3, F4= Fraction F4, and F5= Fraction F5). Percentage of the diversity distribution explained by each axis is indicated on the figure. CT: condensed tannin.
Phylogenetic placement of representative OTUs sequences
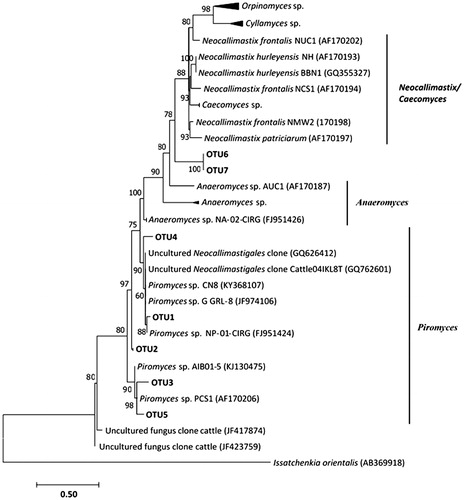
Phylogenetic analysis of the representative OTU sequences (OTUs relative abundance >1.0%) of fungal ITS-1 gene is shown in . The neighbour-joining algorithm tree inferred using the near-complete ITS-1 gene supports the monophyletic affiliation of the OTUs to six genera Neocallimastix, Caecomyces, Anaeromyces, Orpinomyces, Cyllamyces and Piromyces, all of which belong to the family Neocallimastigaceae. The highest average number of observed OTUs (78% of total sequences) determined in this study clustered in the Piromyces clade (n = 5), with three individual OTUs (OTU1, OTU2 and OTU4) forming sister relationships with distinct species of Piromyces and uncultured Neocallimastigales clone and two OTUs (OTU3 and OTU5) forming a monophyletic group that is a sister group to the Piromyces species (bp = 98%). In contrast, representatives of OTU6 and OTU7 clustered into the first clade of the phylogenetic lineage with distinct species of Neocallimastix and genera Orpinomyces and Cyllamyces.
Figure 4. Distance dendogram highlighting the phylogenetic affiliation of anaerobic rumen fungal sequences. Sequences used in the tree construction include available ITS-1 reference gene sequences from GenBank (http://www.ncbi.nlm.nih.gov/BLAST/) and representative OTUs affiliated with known anaerobic fungal genera encountered in this study. The tree was constructed using neighbour-joining algorithm with the Hasegawa–Kishino–Yano (HKY) substitution model and a γ-shaped distribution of 2.0. Bootstrap values are based on 1000 replicates and are shown for branches with >50% bootstrap support. The corresponding ITS-1 region of the ascomycetous yeast Issatchenikia orientalis was used as an outgroup.
Discussion
Several studies have shown that CTs-rich legumes that contain high crude protein used as feedstuffs for ruminants likely influenced rumen fungal community. The results were rather inconsistent as some studies reported inhibitory interactions between CTs and rumen fungi (Scalbert Citation1991; Jakhesara et al. Citation2010; Kok et al. Citation2013), while others demonstrated adaptive responses of fungi with CTs (Chesson et al. Citation1982; McSweeney et al. Citation2001a). The possible reason for the difference in response could be due to the various chemical structures and MWs of CTs (Patra and Saxena Citation2009). However, the alteration in the ruminal fungal diversity and community structure that may occur owing to the CTs of differing MWs are not clearly understood. CTs of different molecular MWs, may either stimulate or inhibit rumen fungal growth. As shown in the present study, the biomass of anaerobic rumen fungi estimated by real-time PCR was reduced by the higher-MW CT fractions (F1 and F2). Consequently, quantification of the total fungi biomass by real-time PCR assay also showed a reduction in the fungal populations linked with increasing MWs of CT fractions (). In an earlier study, Kok et al. (Citation2013) reported that, rumen contents of goat fed with L. leucocephala containing CTs showed significant reduction in the population of anaerobic cellulolytic fungi.
In the present study, high-throughput sequencing of the ITS-1 gene region (approximately 250 bp) could identify several fungal genera in the incubated rumen fluid of domestic cattle fed with guinea grass (Control; ), with the Piromyces 4 as the more predominant genus. Nevertheless, it is worth noting that a substantial number of OTUs were only identified as unclassified genera, thus underscoring the lack of a comprehensive rumen fungal ITS-1 database. Kittelmann et al. (Citation2012, Citation2013), who studied fungal diversity using DGGE and barcoded pyrosequencing of the ITS-1 region methods in ruminants (sheep, cow and deer) fed a variety of diets, found that majority of rumen fungi belonged to the predominant genera monocentric Neocallimastix (28%) and Piromyces (20%). Furthermore, the authors observed the predominance of genus Caecomyces in hay-fed beef cow was not observed in silage-fed dairy cow. However, Sirohi et al. (Citation2013) found that polycentric genus Orpinomyces (48%) was predominant in the rumen fluid of cattle fed high-fibre diet. Whereas, Liggenstoffer et al. (Citation2010), who constructed ITS-1 amplification libraries using NGS approach to study fungal diversity in domestic cattle found that Piromyces spp. was the most abundant genus in the rumen, which is in accordance with our results. Hence, these reports demonstrated that phylogenetic diversity and community structure of anaerobic rumen fungi varies depending on several factors including the host animals, feeds and production system.
Varies chemical properties of CTs such as differing MWs or molecular structure may exert growth-stimulatory or inhibitory effects on ruminal fungal species. In this study, NGS sequencing data revealed that the second predominant genus unclassified Neocallimastigaceae (with the majority of OTUs being closely related to Piromyces spp.) decreased (p < .05) with increasing MWs of CT fractions (; Figure S1). The mechanisms involved in the inhibitory effect of high-MWs CT fractions on the growth of species-specific Neocallimastigaceae, are not well-understood. However, a number of inhibitory mechanisms of CTs on rumen bacteria and methanogens have been proposed including bacteriostatic and/or bactericidal effects (Tavendale et al. Citation2005; Patra and Saxena Citation2009). Nevertheless, it has been suggested that high-MWs CT oligomers (which contain a large number of hydroxyl groups) could form stable complexes with lignocellulosic fibre and prevent fungal colonisation, thus reducing nutrient availability for fungal growth (McSweeney et al. Citation2001b). Although several in vitro and in vivo inhibitory effects of CTs as a whole from various plant recourse on rumen fungi have been reported previously (McAllister et al. Citation1994; McSweeney et al. Citation2001a; Barahona et al. Citation2006; Kok et al. Citation2013), studies on the effects of CTs of differing MWs on the rumen fungal population and diversity has been lacking for comparisons to be made. However, Scalbert (Citation1991) has studied tannin toxicity against rumen fungi, and compared to toxicity of related lower MWs phenolic compounds. It has been postulated that, removal of fungal species from the rumen content could decrease fibre degradation, subsequently reducing the total gas and CH4 production indirectly (Kamra Citation2005). However, our previous report showed that the five CT fractions (F1–F5) had no significant effect on DM digestibility, but reduced CH4 production (Saminathan et al. Citation2015), which suggested that the decrease in the second predominant Neocallimastigaceae spp may have least effects on DM digestibility and reduction of the CH4 production in the in vitro ruminal fermentation.
The fungal species diversity (Shannon) and richness (Chao 1) of bovine rumens (control, without CTs) were 0.245 and 152.2, respectively (): these value are lower than previous reports (Tuckwell et al. Citation2005; Lee et al. Citation2012; Zhang et al. Citation2017) and are likely a consequences of the breeds of animals and feed that affect fungal population dynamics as well as effects of samplings and analytical procedures. Quantitative methods of evaluating the α-diversity (richness and species diversity) of rumen fungi communities indicated that inclusion of different MWs CT fraction showed significant interactions between treatments: higher-MW CT fractions, such as fractions F1 and F2 exhibited lower Chao1 index and Shannon index compared with lower-MW CT fractions (fractions F3, F4 and F5). These results indicated that higher-MW CTs may affects the diversity and richness of species in the rumen liquor. The α-diversity results confirmed that there was a significant impact of CT fractions with different MWs on the rumen fungal communities. PCA () indicated that the fungal communities clearly differed between the treatments (control, unfractionated CTs F0 and CT fractions F1− F5), and it revealed that the higher-MW CT fractions were distinguishable from the lower-MW CT fractions.
The Naïve Bayes classification analysis of read mapping to the ITS-1 gene region as implemented in MOTHUR, showed that the most relative abundant fungal community in the rumen fluid (> 50%), regardless of the treatments, was classified as Piromyces 4. Significant (p < .05) enrichment of the ITS-1 of the genus Piromyces 4 was observed with inclusions of F0 and CT fractions, where the increase was more pronounced with the higher-MW fractions F1, F2 and F3 (Figure S1). This shows that the type, chemical structure and MW of CTs are important factors influencing their effects on the growth of rumen fungi. The increase in relative abundance of the predominant Piromyces 4 in the presence of unfractionated CTs (F0) and CT fractions of higher MWs (F1–F3), could be linked to the decrease in the growth of other major microbial groups (such as Methanobrevibacter spp, Entodinium spp and Prevotella spp, the most predominant group of rumen archaea, protozoa and bacteria, respectively) using the same CTs and CT fractions of higher MWs from LLR (Saminathan, Sieo, Gan, Abdullah, et al. Citation2016; Saminathan, Sieo, Gan, Ravi, et al. Citation2016b; Saminathan et al. Citation2017), resulting in an increase in substrate availability for the Piromyces 4, thus increasing its population. Moreover, reduction of other major rumen microbes may also allow the Piromyces 4 to occupy the vacated niche in the rumen microbial ecosystem. On the other hand, compared with other genera of fungi, Piromyces 4 seemed to be relatively resistant to tannins in the presence of CTs, particularly with higher MWs, indicating their possible ability to detoxify CTs. This group of fungal genus can be recognised as tannin-resistant.
The mechanisms of action in the ability to overcome the inhibitory effects of CTs on growth of some fungal species remained unknown (Patra and Saxena Citation2009). However, several rumen microbial adaptation mechanisms to CT have been suggested, including modification of the cell membrane and degradation/modification of tannin (Odenyo and Osuji Citation1998; Smith et al. Citation2005). It was reported that two monocentric (Piromyces MC-1, Neocallimastix MC-2) and three polycentric (Orpinomyces PC-2, Orpinomyces PC-3, and PC-1, an unnamed genus with uniflagellated zoospores) also produced p-coumaryl and p-feruloyl esterases that might enable them to degrade phenolic and tannin compounds (Hespell et al. Citation1997). Piromyces sp. produced extracellular cellulase/hemicellulase enzymes which play important role in the hydrolysis of cellulose to glucose (Dijkerman et al. Citation1997). This species appear to be better than other rumen fungi in lignocellulose degradation ability, possibly because filamentous rhizoids are more effective than bulbous rhizoids at penetrating plant cell walls and producing high levels of fibrolytic enzymes (Paul et al. Citation2010). Increases in relative abundance of monocentric Piromyces 4 with inclusion of higher-MW CT fractions, could maintain normal levels of fibrolytic activities, although there was a decrease in other rumen fungal genera. This proposition could support our previous findings (Saminathan et al. Citation2015) that the higher-MW CT fractions did not affect fermentation activity of rumen microbes in vitro.
Conclusions
The present in vitro study demonstrates the CT with different MW modulated ruminal fungal mass and composition of fungal community. The total fungi biomass was significantly decreased with inclusion of higher-MWs CT fractions. However, inclusion of higher-MWs CT fractions enhanced the growth of the predominant genus Piromyces 4, while the second predominant rumen Neocallimastigaceae exhibited decreasing growth. The differences in fungal community response indicated that the effects of CT fractions of different MWs were species-dependent. The higher-MW CT fractions (F1 and F2) demonstrated pronounced effects on altering the diversity of bovine rumen fungi than the lower-MW CT fractions (F3–F5). Thus, the results of the in vitro study could provide a basis for developing strategies in the utilisation of tropical legumes containing CTs of different MWs as a ruminant feed additive to mitigate CH4 production without affecting the rumen fungal community to digest fibre.
Ethical Approval
Procedures for animal use protocols approved by the Universiti Putra Malaysia's Animal Care and Use Committee (UPM/FPV/PS/3.2.1.551/AUPR32).
Acknowledgements
The authors would like to acknowledge the Universiti Putra Malaysia, Malaysia for financial support through the Research University Grant Scheme (RUGS). Financial support for MiSeq sequencing was partially provided by the Monash Tropical Medicine Biology Platform.
Disclosure statement
All authors have no conflict of interest to declare.
Additional information
Funding
Related Research Data
References
- Aerts RJ, Barry TN, McNabb WC. 1999. Polyphenols and agriculture: beneficial effects of proanthocyanidins in forages. Agric Ecosyst Environ. 75:1–12.
- Akin DE, Borneman WS. 1990. Role of rumen fungi in fiber degradation. J Dairy Sci. 73:3023–3032.
- Barahona R, Sanchez S, Lascano CE, Owen E, Morris P, Theodorou MK. 2006. Effect of condensed tannins from tropical legumes on the activity of fibrolytic enzymes from the rumen fungus Neocallimastyx hurleyensis. Enzyme Microb Technol. 39:281–288.
- Chesson A, Stewart CS, Wallace RJ. 1982. Influence of plant phenolic acids on growth and cellulolytic activity of rumen bacteria. Appl Environ Microbiol. 44:597–603.
- Denman SE, McSweeney CS. 2006. Development of a real‐time PCR assay for monitoring anaerobic fungal and cellulolytic bacterial populations within the rumen. FEMS Microbiol Ecol. 58:572–582.
- Dijkerman R, den Camp HJO, Van der Drift C, Vogels GD. 1997. The role of the cellulolytic high molecular mass (HMM) complex of the anaerobic fungus Piromyces sp. strain E2 in the hydrolysis of microcrystalline cellulose. Arch Microbiol. 167:137–142.
- Edgar RC, Haas BJ, Clemente JC, Quince C, Knight R. 2011. UCHIME improves sensitivity and speed of chimera detection. Bioinformatics. 27:2194–2200.
- Edwards JE, Kingston-Smith AH, Jimenez HR, Huws SA, Skøt KP, Griffith GW, McEwan NR, Theodorou MK. 2008. Dynamics of initial colonization of nonconserved perennial ryegrass by anaerobic fungi in the bovine rumen. FEMS Microbiol Ecol. 66:537–545.
- Fliegerová K, Mrázek J, Hoffmann K, Zábranská J, Voigt K. 2010. Diversity of anaerobic fungi within cow manure determined by ITS1 analysis. Folia Microbiol. 55:319–325.
- Good IJ. 1953. The population frequencies of species and the estimation of population parameters. Biometrika. 40:237–264.
- Gordon G, Phillips M. 1993. Removal of anaerobic fungi from the rumen of sheep by chemical treatment and the effect on feed consumption and in vivo fibre digestion. Lett Appl Microbiol. 17:220–223.
- Gruninger RJ, Puniya AK, Callaghan TM, Edwards JE, Youssef N, Dagar SS, Fliegerova K, Griffith GW, Forster R, Tsang A, et al. 2014. Anaerobic fungi (phylum Neocallimastigomycota): advances in understanding their taxonomy, life cycle, ecology, role and biotechnological potential. FEMS Microbiol Ecol. 90:1–17.
- Hespell R, Akin D, Dehority B, Mackie R, White B, Isaacson R. 1997. Bacteria, fungi, and protozoa of the rumen. In: Mackie RI, White BA, Isaacson RE, editors. Gastrointestinal microbiology. New York (NY): Chapman and Hall.
- Jakhesara S, Koringa P, Ramani U, Ahir V, Tripathi A, Soni P, Singh K, Bhatt V, Patel J, Patel M. 2010. Comparative study of tannin challenged rumen microbiome in goat using high throughput sequencing technology. Develop Microbiol Mol Biol. 1:95.
- Kamra D. 2005. Rumen microbial ecosystem. Current Science. 89:124–135.
- Katoh K, Standley DM. 2013. MAFFT multiple sequence alignment software version 7: improvements in performance and usability. Mol Biol Evol. 30:772–780.
- Kittelmann S, Naylor GE, Koolaard JP, Janssen PH. 2012. A proposed taxonomy of anaerobic fungi (class Neocallimastigomycetes) suitable for large-scale sequence-based community structure analysis. PLoS One. 7:e36866.
- Kittelmann S, Seedorf H, Walters WA, Clemente JC, Knight R, Gordon JI, Janssen PH. 2013. Simultaneous amplicon sequencing to explore co-occurrence patterns of bacterial, archaeal and eukaryotic microorganisms in rumen microbial communities. PLoS One. 8:e47879.
- Klein D. 2002. Quantification using real-time PCR technology: applications and limitations. Trends Mol Med. 8:257–260.
- Kok CM, Sieo CC, Tan HY, Saad WZ, Liang JB, Ho YW. 2013. Anaerobic cellulolytic rumen fungal populations in goats fed with and without Leucaena leucocephala hybrid, as determined by real-time PCR. J Microbiol. 51:700–703.
- Lee HJ, Jung JY, Oh YK, Lee SS, Madsen EL, Jeon CO. 2012. Comparative survey of rumen microbial communities and metabolites across one caprine and three bovine groups, using bar-coded pyrosequencing and 1H nuclear magnetic resonance spectroscopy. Appl Environ Microbiol. 78:5983–5993.
- Liggenstoffer AS, Youssef NH, Couger M, Elshahed MS. 2010. Phylogenetic diversity and community structure of anaerobic gut fungi (phylum Neocallimastigomycota) in ruminant and non-ruminant herbivores. ISME J. 4:1225–1235.
- Makkar HP, Becker K, Abel H, Szegletti C. 1995. Degradation of condensed tannins by rumen microbes exposed to quebracho tannins (QT) in rumen simulation technique (RUSITEC) and effects of QT on fermentative processes in the RUSITEC. J Sci Food Agric. 69:495–500.
- Mané C, Sommerer N, Yalcin T, Cheynier V, Cole RB, Fulcrand H. 2007. Assessment of the molecular weight distribution of tannin fractions through MALDI-TOF MS analysis of protein − tannin complexes. Anal Chem. 79:2239–2248.
- McAllister T, Bae H, Jones G, Cheng K. 1994. Microbial attachment and feed digestion in the rumen. J Anim Sci. 72:3004–3018.
- McSweeney C, Palmer B, Bunch R, Krause D. 2001a. Effect of the tropical forage calliandra on microbial protein synthesis and ecology in the rumen. J Appl Microbiol. 90:78–88.
- McSweeney C, Palmer B, McNeill D, Krause D. 2001b. Microbial interactions with tannins: nutritional consequences for ruminants. Anim Feed Sci Technol. 91:83–93.
- Nicholson MJ, McSweeney CS, Mackie RI, Brookman JL, Theodorou MK. 2010. Diversity of anaerobic gut fungal populations analysed using ribosomal ITS1 sequences in faeces of wild and domesticated herbivores. Anaerobe. 16:66–73.
- Odenyo A, Osuji P. 1998. Tannin-tolerant ruminal bacteria from East African ruminants. Can J Microbiol. 44:905–909.
- Osborne NJT, McNeill DM. 2001. Characterisation of Leucaena condensed tannins by size and protein precipitation capacity. J Sci Food Agric. 81:1113–1119.
- Parks DH, Tyson GW, Hugenholtz P, Beiko RG. 2014. STAMP: statistical analysis of taxonomic and functional profiles. Bioinformatics. 30:3123–3124.
- Patra AK, Saxena J. 2009. Dietary phytochemicals as rumen modifiers: a review of the effects on microbial populations. A Van Leeuw. 96:363–375.
- Paul SS, Kamra DN, Sastry VR. 2010. Fermentative characteristics and fibrolytic activities of anaerobic gut fungi isolated from wild and domestic ruminants. Arch Anim Nutr. 64:279–292.
- Saminathan M, Gan HM, Abdullah N, Wong C, Ramiah SK, Tan HY, Sieo CC, Ho YW. 2017. Changes in rumen protozoal community by condensed tannin fractions of different molecular weights from a Leucaena leucocephala hybrid in vitro. J Appl Microbiol. 123:41–53.
- Saminathan M, Sieo CC, Abdullah N, Wong C, Ho YW. 2015. Effects of condensed tannin fractions of different molecular weights from a Leucaena leucocephala hybrid on in vitro methane production and rumen fermentation. J Sci Food Agric. 95:2742–2749.
- Saminathan M, Sieo CC, Gan HM, Abdullah N, Wong C, Ho YW. 2016. Effects of condensed tannin fractions of different molecular weights on population and diversity of bovine rumen methanogenic archaea in vitro, as determined by high-throughput sequencing. Anim Feed Sci Technol. 216:146–160.
- Saminathan M, Sieo CC, Gan HM, Ravi S, Venkatachalam K, Abdullah N, Wong C, Ho YW. 2016b. Modulatory effects of condensed tannin fractions of different molecular weights from a Leucaena leucocephala hybrid on the bovine rumen bacterial community in vitro. J Sci Food Agric. 96:4565–4574.
- Saminathan M, Tan HY, Sieo CC, Abdullah N, Wong C, Abdulmalek E, Ho YW. 2014. Polymerization degrees, molecular weights and protein-binding affinities of condensed tannin fractions from a Leucaena leucocephala hybrid. Molecules. 19:7990–8010.
- SAS. 2005. SAS/STAT software, version 9.2. Cary (NC): SAS Inst. Inc.
- Scalbert A. 1991. Antimicrobial properties of tannins. Phytochem. 30:3875–3883.
- Schloss PD, Westcott SL, Ryabin T, Hall JR, Hartmann M, Hollister EB, Lesniewski RA, Oakley BB, Parks DH, Robinson CJ, et al. 2009. Introducing mothur: open-source, platform-independent, community-supported software for describing and comparing microbial communities. Appl Environ Microbiol. 75:7537–7541.
- Sirohi SK, Choudhury PK, Puniya AK, Singh D, Dagar SS, Singh N. 2013. Ribosomal ITS1 sequence-based diversity analysis of anaerobic rumen fungi in cattle fed on high fiber diet. Ann Microbiol. 63:1571–1577.
- Smith JE, Mckay D, Brenner G, Mciver J, Spatafora JW. 2005. Early impacts of forest restoration treatments on the ectomycorrhizal fungal community and fine root biomass in a mixed conifer forest. J Appl Ecol. 42:526–535.
- Stöver BC, Müller KF. 2010. TreeGraph 2: combining and visualizing evidence from different phylogenetic analyses. BMC Bioinform. 11:7.
- Tavendale MH, Meagher LP, Pacheco D, Walker N, Attwood GT, Sivakumaran S. 2005. Methane production from in vitro rumen incubations with Lotus pedunculatus and Medicago sativa, and effects of extractable condensed tannin fractions on methanogenesis. Anim Feed Sci Technol. 123:403–419.
- Terrill T, Rowan A, Douglas G, Barry T. 1992. Determination of extractable and bound condensed tannin concentrations in forage plants, protein concentrate meals and cereal grains. J Sci Food Agric. 58:321–329.
- Tuckwell DS, Nicholson MJ, McSweeney CS, Theodorou MK, Brookman JL. 2005. The rapid assignment of ruminal fungi to presumptive genera using ITS1 and ITS2 RNA secondary structures to produce group-specific fingerprints. Microbiology. 151:1557–1567.
- Zhang J, Shi H, Wang Y, Li S, Cao Z, Ji S, Zhang H. 2017. Effect of dietary forage to concentrate ratios on dynamic profile changes and interactions of ruminal microbiota and metabolites in Holstein heifers. Front Microbiol. 8:2206.